:::danger 首先声明:下面大部分内容参考于 https://www.zhihu.com/question/22611929 ::: lect2.pdf
一维傅里叶变换
:::info 一维傅里叶变换就是一个基变换
- 在时域中,基是一族冲激信号激信号
- 在频域中,基是
,而且这组基是正交基。 :::
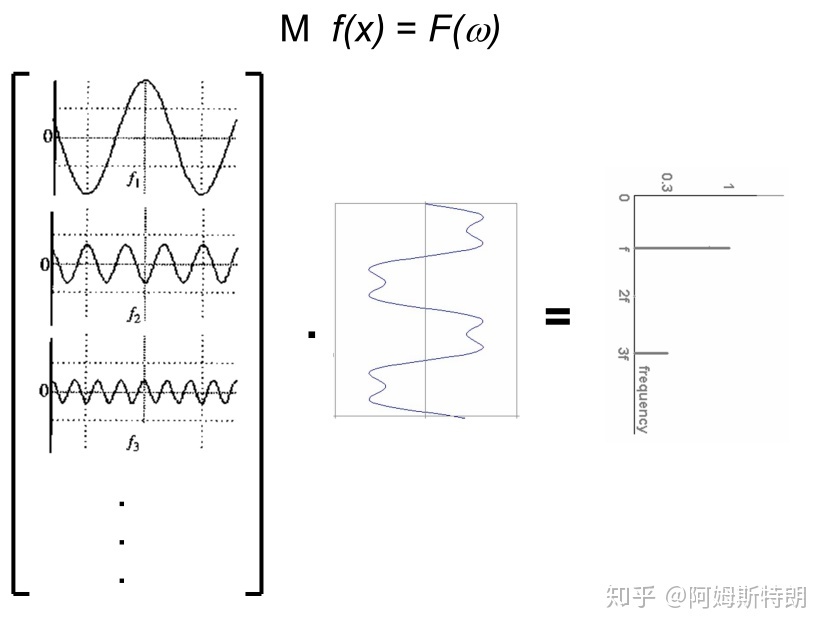
,基变换示意图
二维傅里叶变换
:::info
二维FT将一个图像分解成若干个复平面波 之和
:::
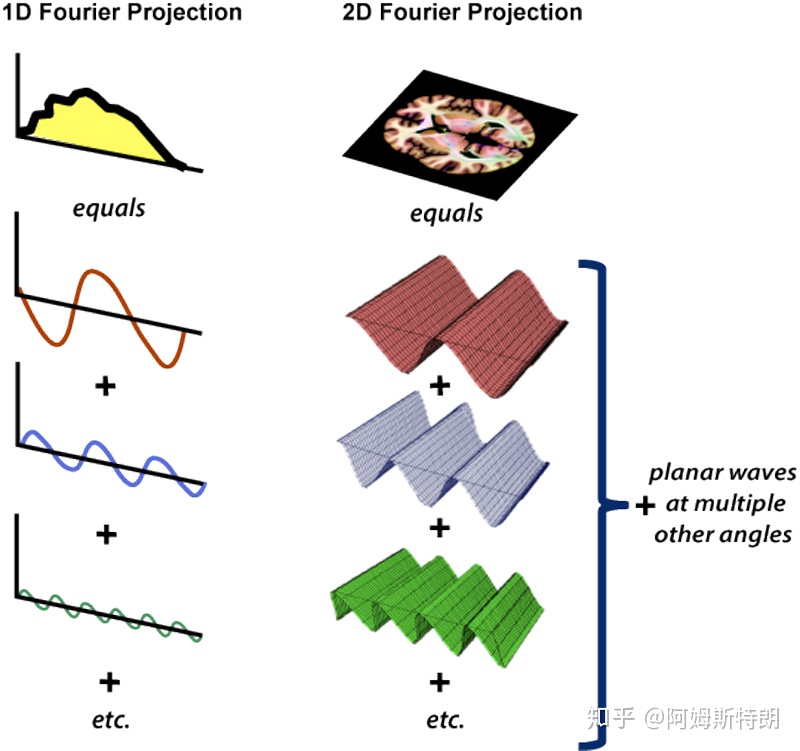
基变换
通过公式,我们可以计算出,每个平面波在图像中成分是多少。从公式也可以看到,二维傅里叶变换就是将图像与每个不同频率的不同方向的复平面波做内积(先点乘在求和),也就是一个求在基 上的投影的过程。
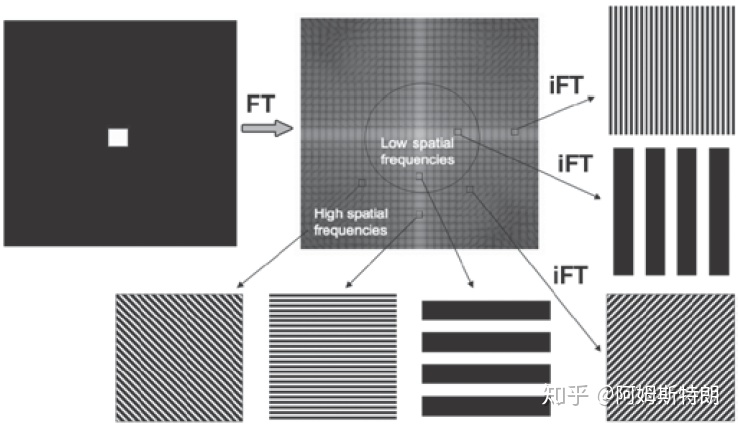
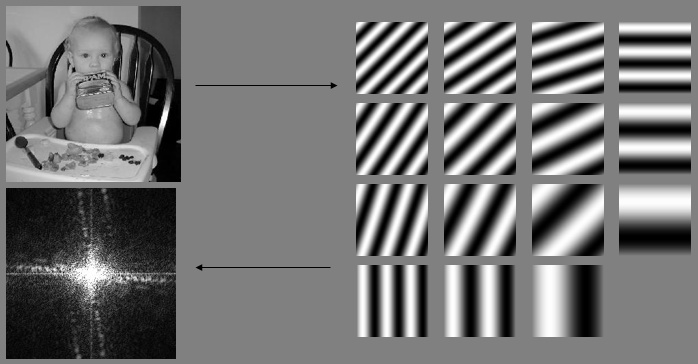
旋转不变性
从平面波的角度很容易理解,旋转没有改变平面波的幅度相位,只是将所有的平面波都旋转了一个角度。下面这个图像显示了二维傅里叶变换中,实空间旋转多少,频率空间也会相应旋转多少。这其实是高维傅里叶变换缩放定理的一种特殊情况。(连续的是可以证明的,离散的涉及插值 ,不一定完全准确)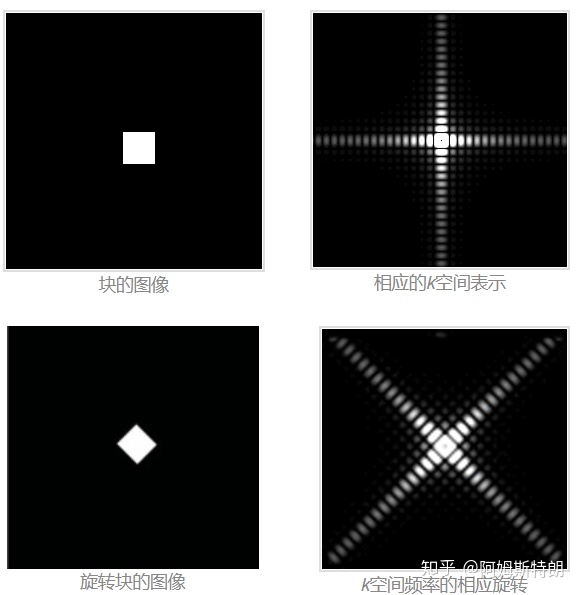
参考链接
https://www.cs.unm.edu/~brayer/vision/fourier.html
实验
import numpy as npimport matplotlib.pyplot as pltimport cv2%matplotlib inline%config InlineBackend.figure_formats=['svg']# Define gaussian, sobel, and laplacian (edge) filtersgaussian = (1/9)*np.array([[1, 1, 1],[1, 1, 1],[1, 1, 1]])sobel_x= np.array([[-1, 0, 1],[-2, 0, 2],[-1, 0, 1]])sobel_y= np.array([[-1,-2,-1],[0, 0, 0],[1, 2, 1]])# laplacian, edge filterlaplacian=np.array([[0, 1, 0],[1,-4, 1],[0, 1, 0]])filters = [gaussian, sobel_x, sobel_y, laplacian]filter_name = ['gaussian','sobel_x', \'sobel_y', 'laplacian']# perform a fast fourier transform on each filter# and create a scaled, frequency transform imagef_filters = [np.fft.fft2(x) for x in filters]fshift = [np.fft.fftshift(y) for y in f_filters]frequency_tx = [np.log(np.abs(z)+1) for z in fshift]# display 4 filtersfor i in range(len(filters)):plt.subplot(2,2,i+1),plt.imshow(frequency_tx[i],cmap = 'gray')plt.title(filter_name[i]), plt.xticks([]), plt.yticks([])plt.show()
image_copy = cv2.imread('images/brain_MR.jpg')image = cv2.cvtColor(image_copy, cv2.COLOR_BGR2RGB)image_gray = cv2.cvtColor(image, cv2.COLOR_RGB2GRAY)gray = image_gray #/255.0gray=np.fft.fft2(gray)gray=np.fft.fftshift(gray)imgae_fft=np.log(np.abs(gray)+1)f, ((ax1,ax2),(ax3,ax4),(ax5,ax6)) = plt.subplots(3,2, figsize=(10,10))ax1.imshow(image)ax2.imshow(imgae_fft)filter_x=np.pad(sobel_x, ((254, 255),(254, 255)), 'constant', constant_values=(0, 0))filter_x_fft = np.fft.fft2(filter_x)filter_x_fft = np.fft.fftshift(filter_x_fft)filter_x_f = np.log(np.abs(filter_x_fft)+1)ax3.imshow(sobel_x)ax4.imshow(filter_x_f)# img_fft=grayimg_fft=gray*filter_x_fftax6.imshow(np.log(np.abs(img_fft)+1))img=np.fft.ifft2(img_fft)img=np.fft.ifftshift(img)img=np.abs(img)img=img/np.max(img)*255ax5.imshow(img)
clc,clear,close all% im = double(imread('hand.jpg'))/255;im = double(imread('cameraman.tif'))/255;% im = rgb2gray(im); % “im” should be a gray-scale floating point image[imh, imw] = size(im);hs = 50; % filter half-sizefil = fspecial('gaussian', hs*2+1, 10);fftsize = 1024; % should be order of 2 (for speed) and include paddingim_fft = fft2(im, fftsize, fftsize); % 1) fft im with paddingfil_fft = fft2(fil, fftsize, fftsize); % 2) fft fil, pad to same size as imageim_fil_fft = im_fft .* fil_fft; % 3) multiply fft imagesim_fil = ifft2(im_fil_fft); % 4) inverse fft2im_fil = im_fil(1+hs:size(im,1)+hs, 1+hs:size(im, 2)+hs); % 5) remove padding%%subplot(2,3,4)imagesc(log(abs(fftshift(im_fft)))), colormap jet,axis off,axis equalsubplot(2,3,2)imagesc(log(fil+1)), colormap jet,axis off,axis equalsubplot(2,3,5)imagesc(log(abs(fftshift(fil_fft)))), colormap jet,axis off,axis equalsubplot(2,3,6)imagesc(log(abs(fftshift(im_fil_fft)))), colormap jet,axis off,axis equalsubplot(2,3,3)imshow(im_fil)subplot(2,3,1)imshow(im)


