类似SQL:
select city,max(temperature) from city_weather group by city;
groupby:先对数据分组,然后在每个分组上应用聚合函数、转换函数
本次演示:
一、分组使用聚合函数做数据统计
二、遍历groupby的结果理解执行流程
三、实例分组探索天气数据
四、工程实践groupby的test
1、创建数据和导入包
import pandas as pdimport numpy as np# 加上这一句,能在jupyter notebook展示matplot图表%matplotlib inlinedf = pd.DataFrame({'A': ['foo', 'bar', 'foo', 'bar', 'foo', 'bar', 'foo', 'foo'],'B': ['one', 'one', 'two', 'three', 'two', 'two', 'one', 'three'],'C': np.random.randn(8),'D': np.random.randn(8)})
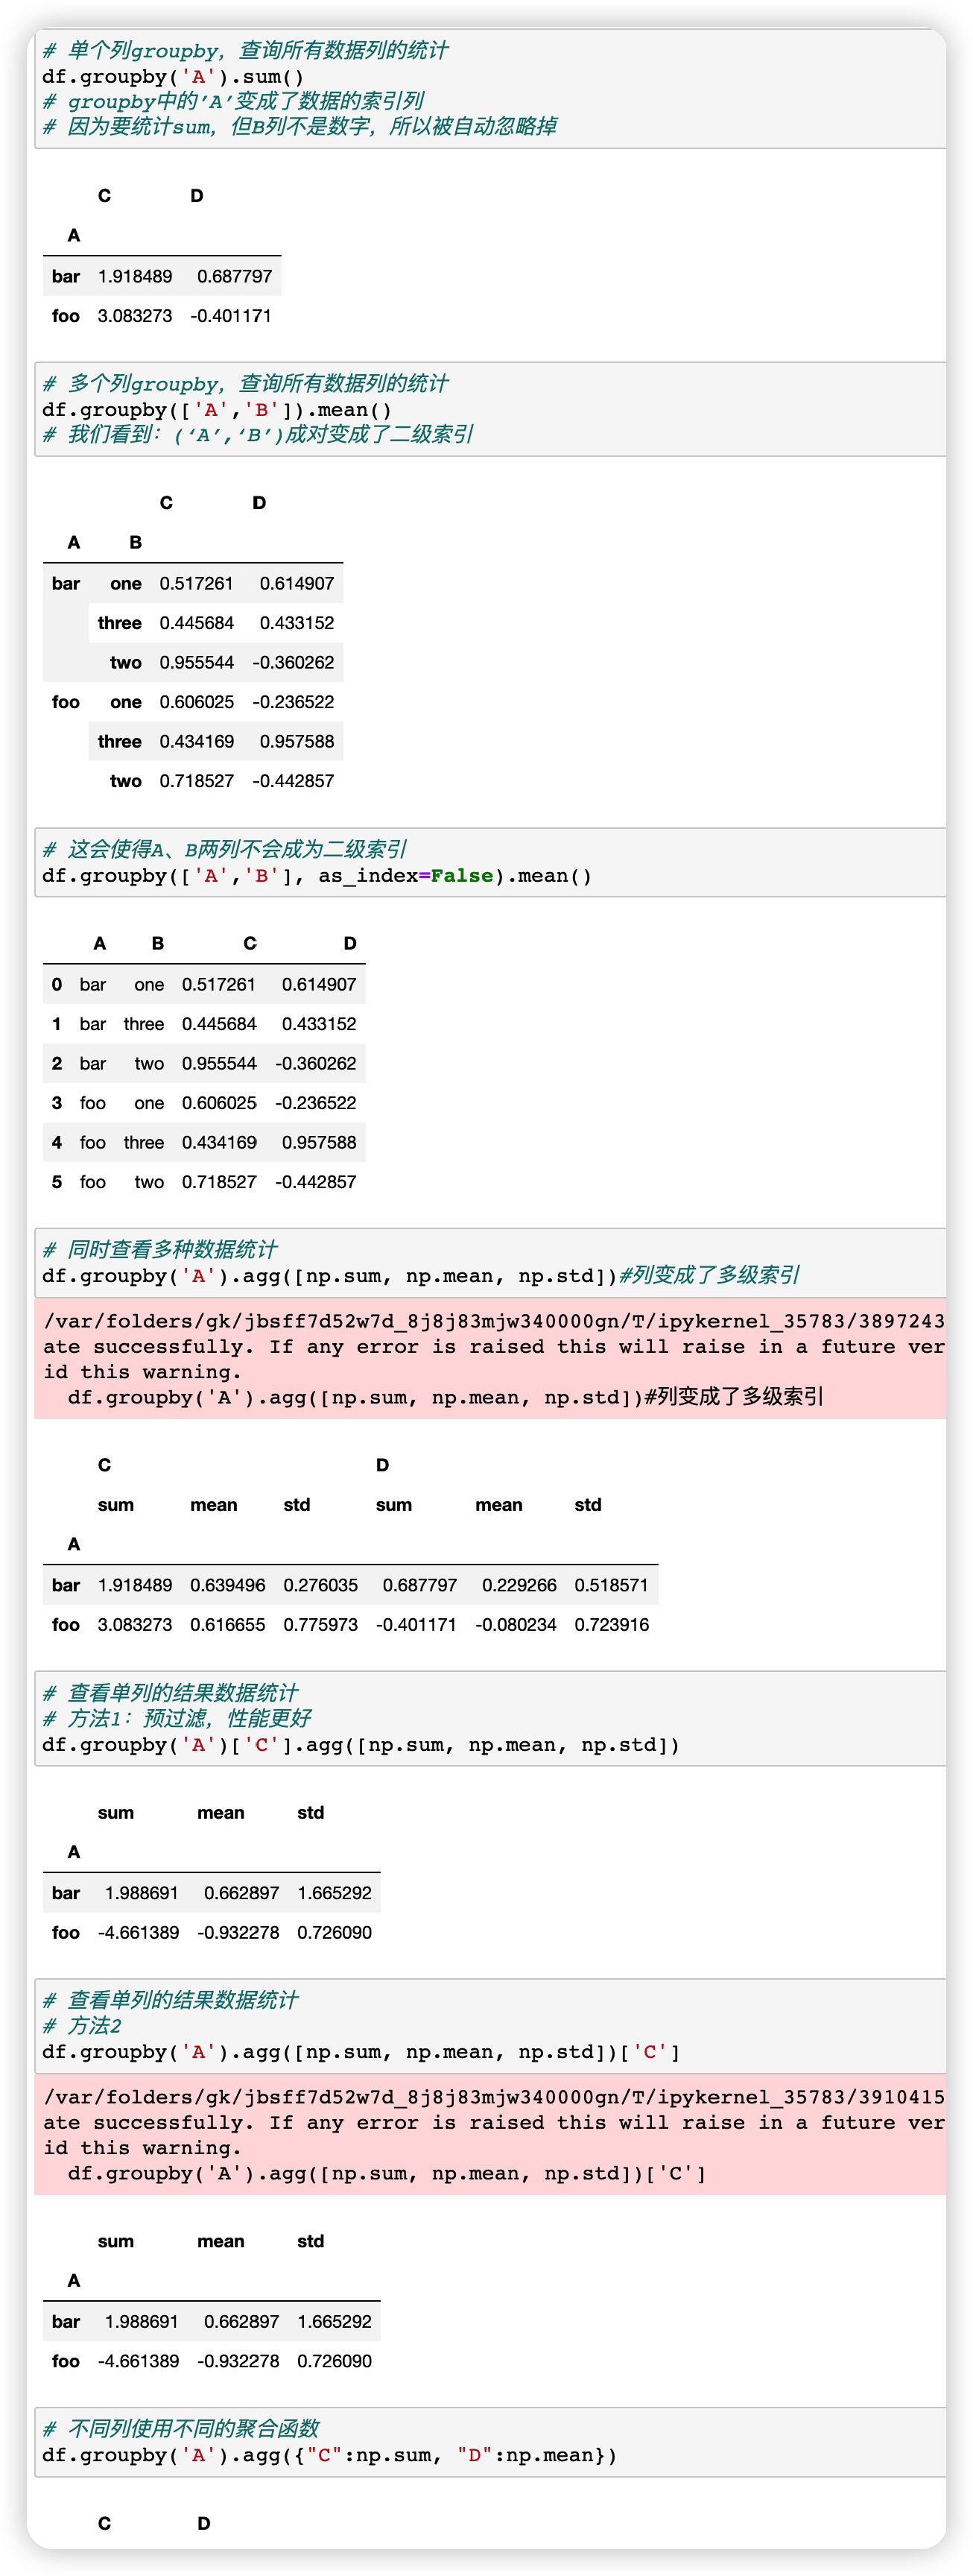
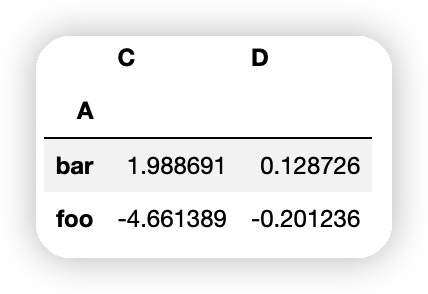
2、分组使用聚合函数做数据统计

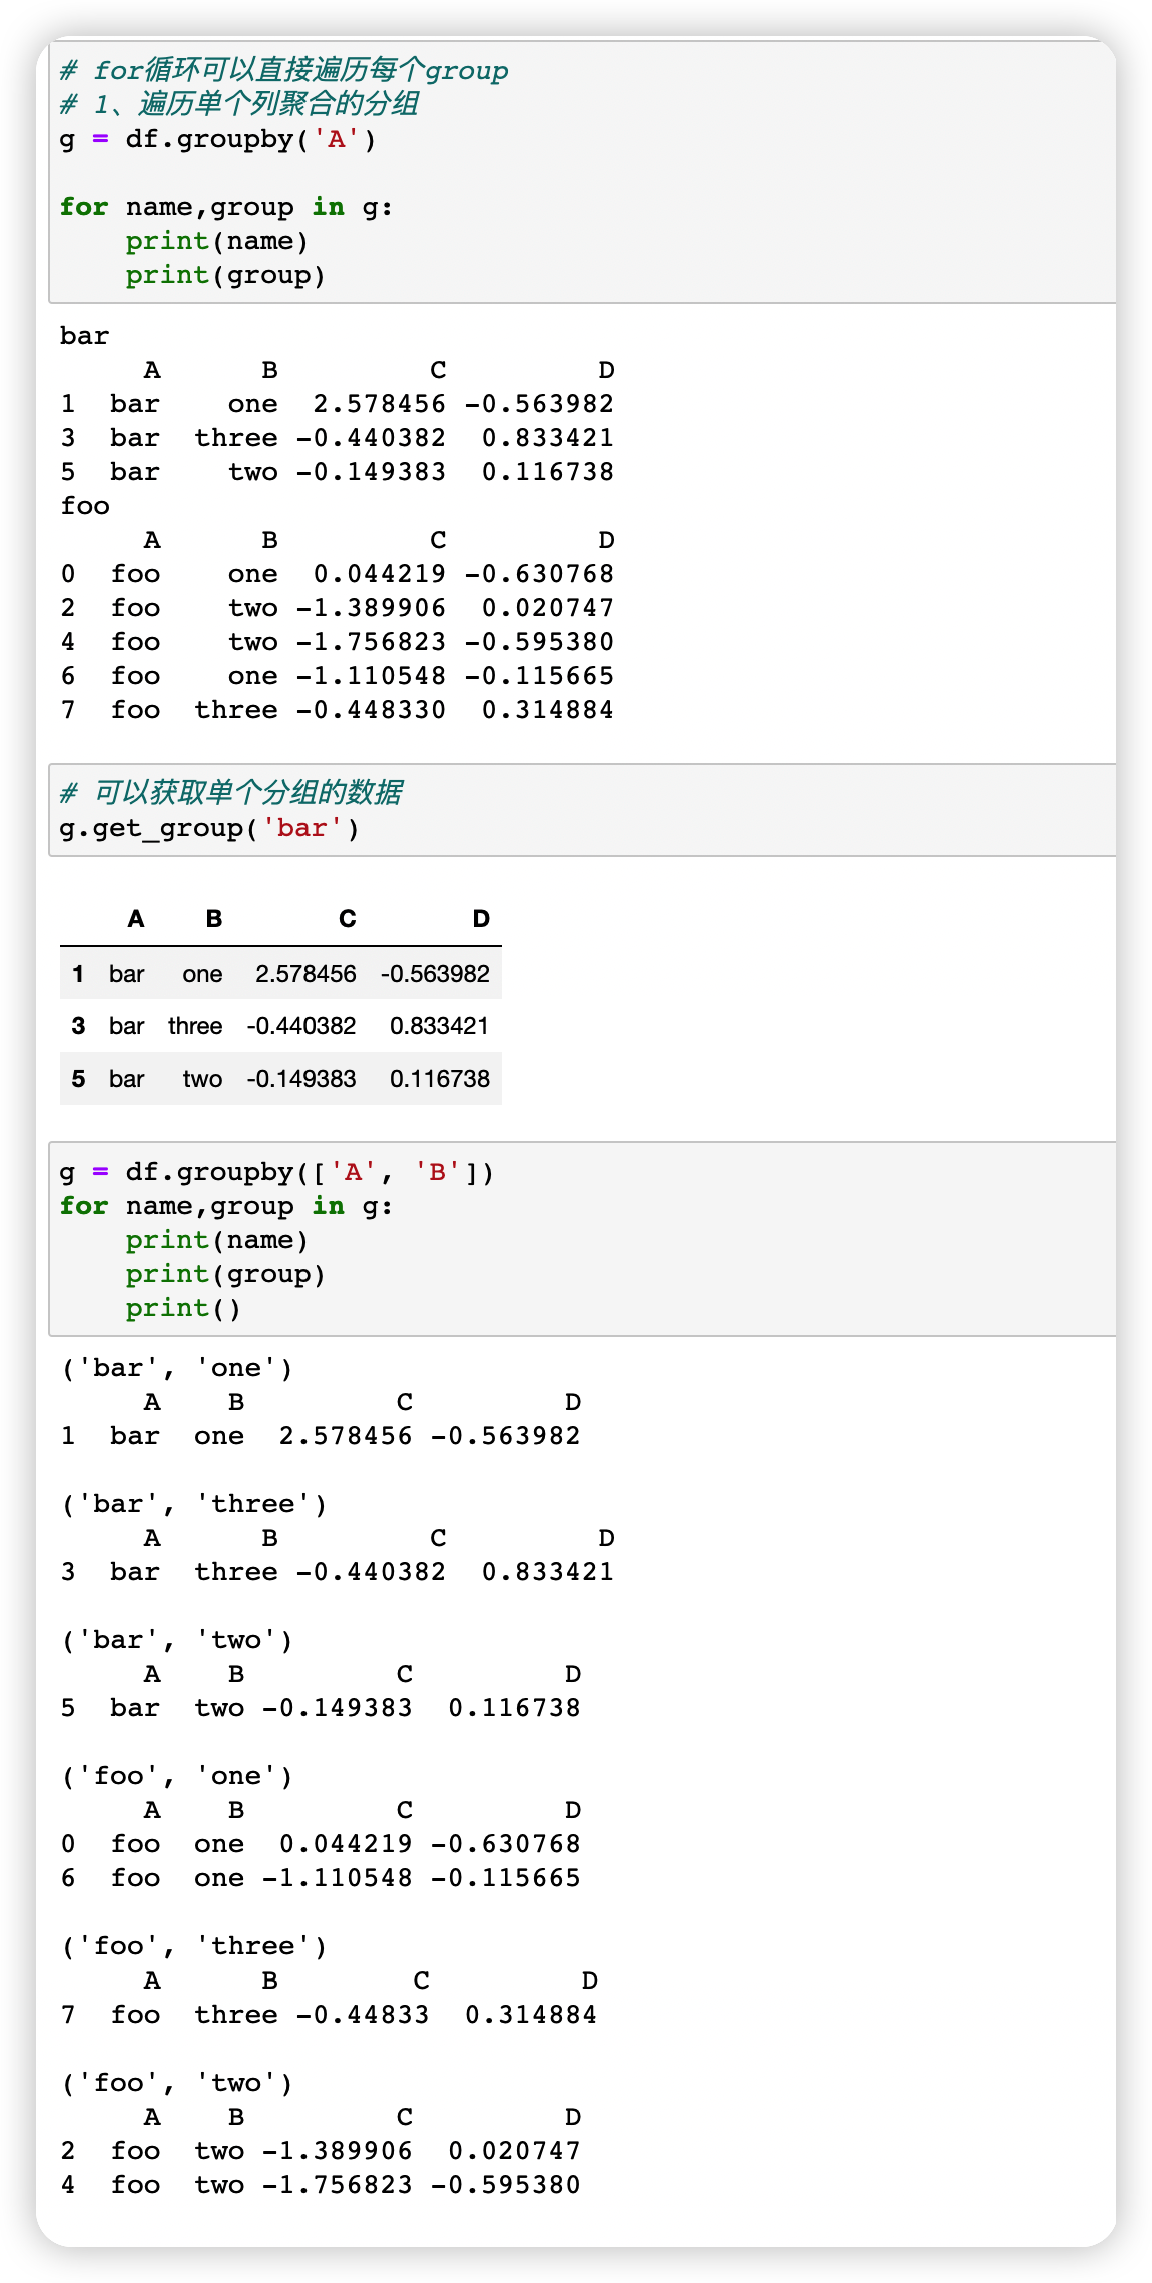
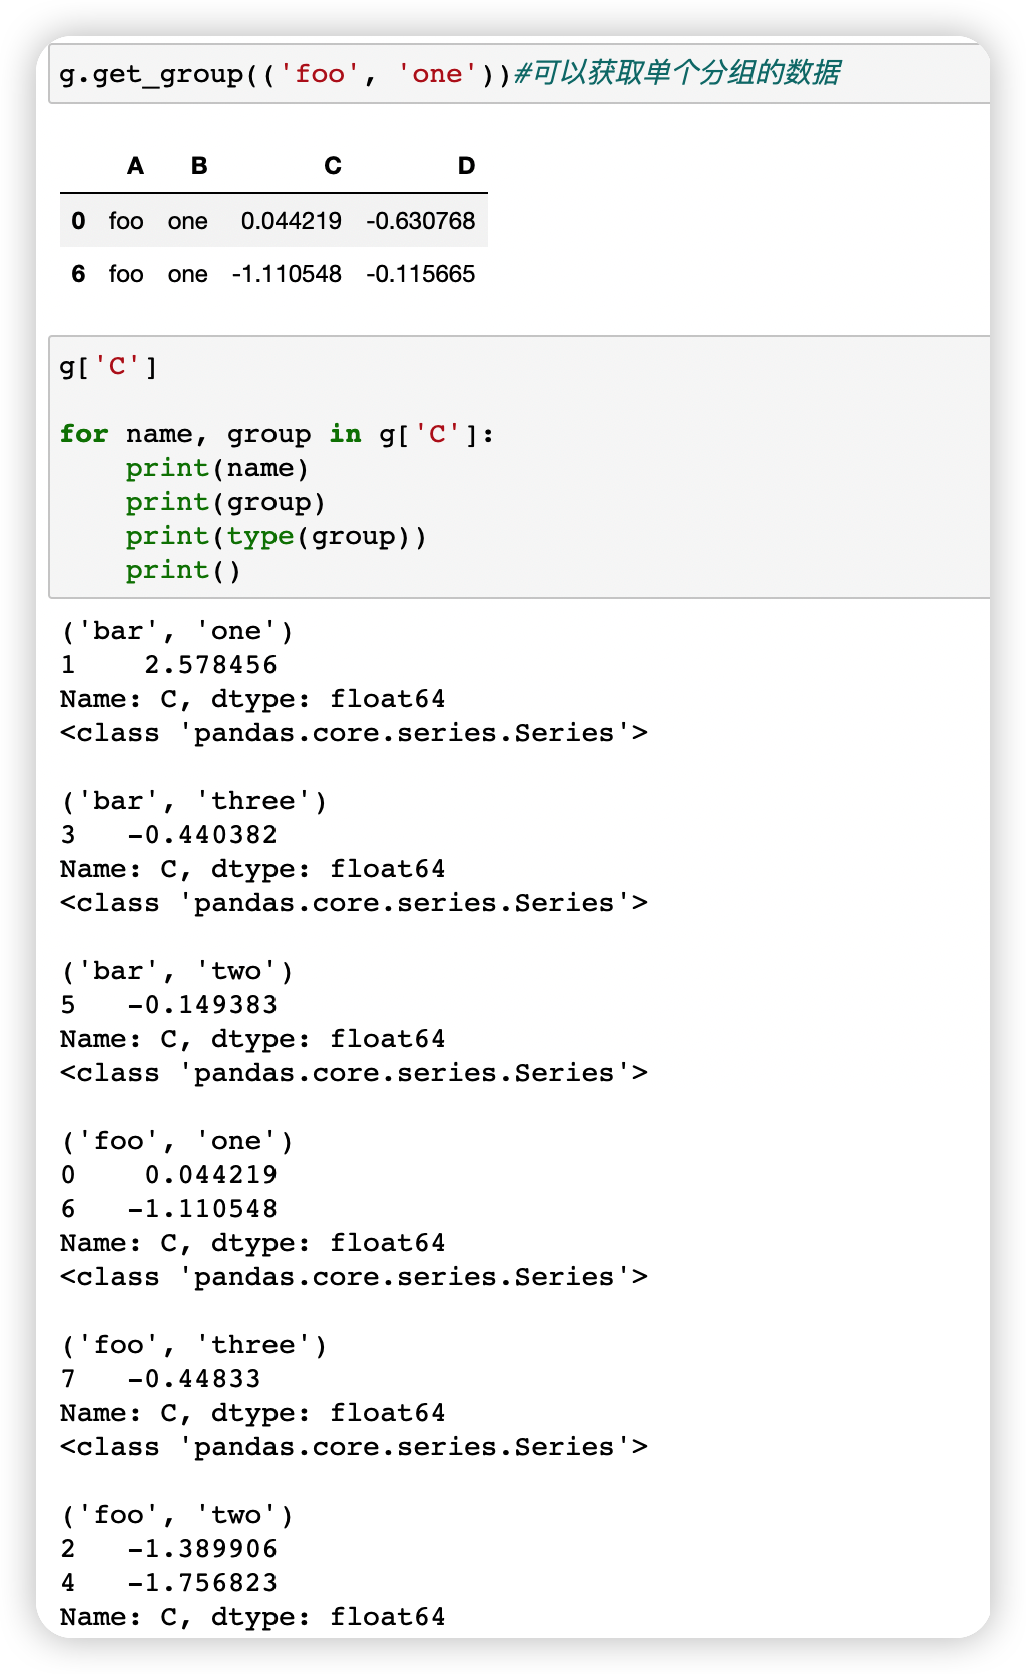
3、遍历groupby的结果理解执行流程
4、实例分组探索天气数据
fpath = "./datas/beijing_tianqi/beijing_tianqi_2018.csv"df = pd.read_csv(fpath)# 替换掉温度的后缀℃df.loc[:, "bWendu"] = df["bWendu"].str.replace("℃", "").astype('int32')df.loc[:, "yWendu"] = df["yWendu"].str.replace("℃", "").astype('int32')df.head()# 新增一列为月份df['month'] = df['ymd'].str[:7]df.head()
1、查看每个月的最高温度
data = df.groupby('month')['bWendu'].max()datadata.plot()#绘图
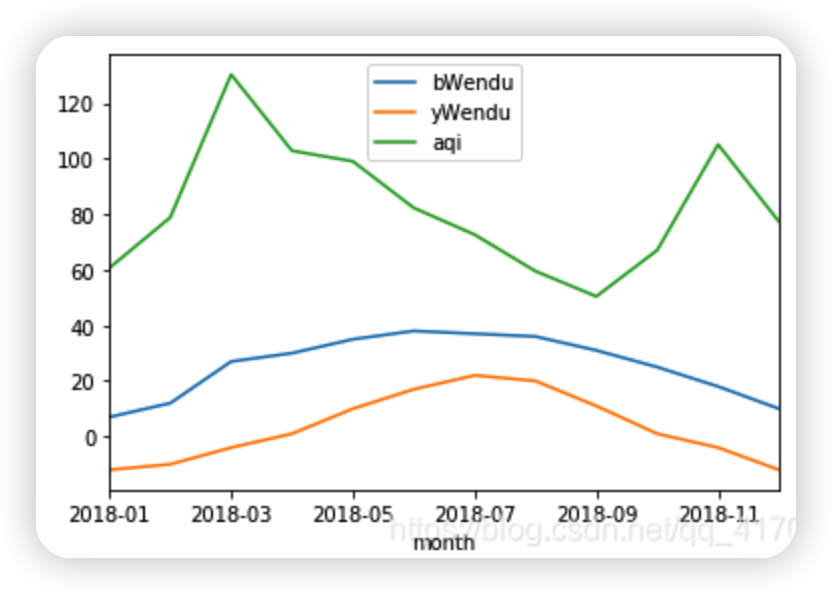
2、查看每个月的最高温度、最低温度、平均空气质量指数
group_data = df.groupby('month').agg({"bWendu":np.max, "yWendu":np.min, "aqi":np.mean})group_data.plot()
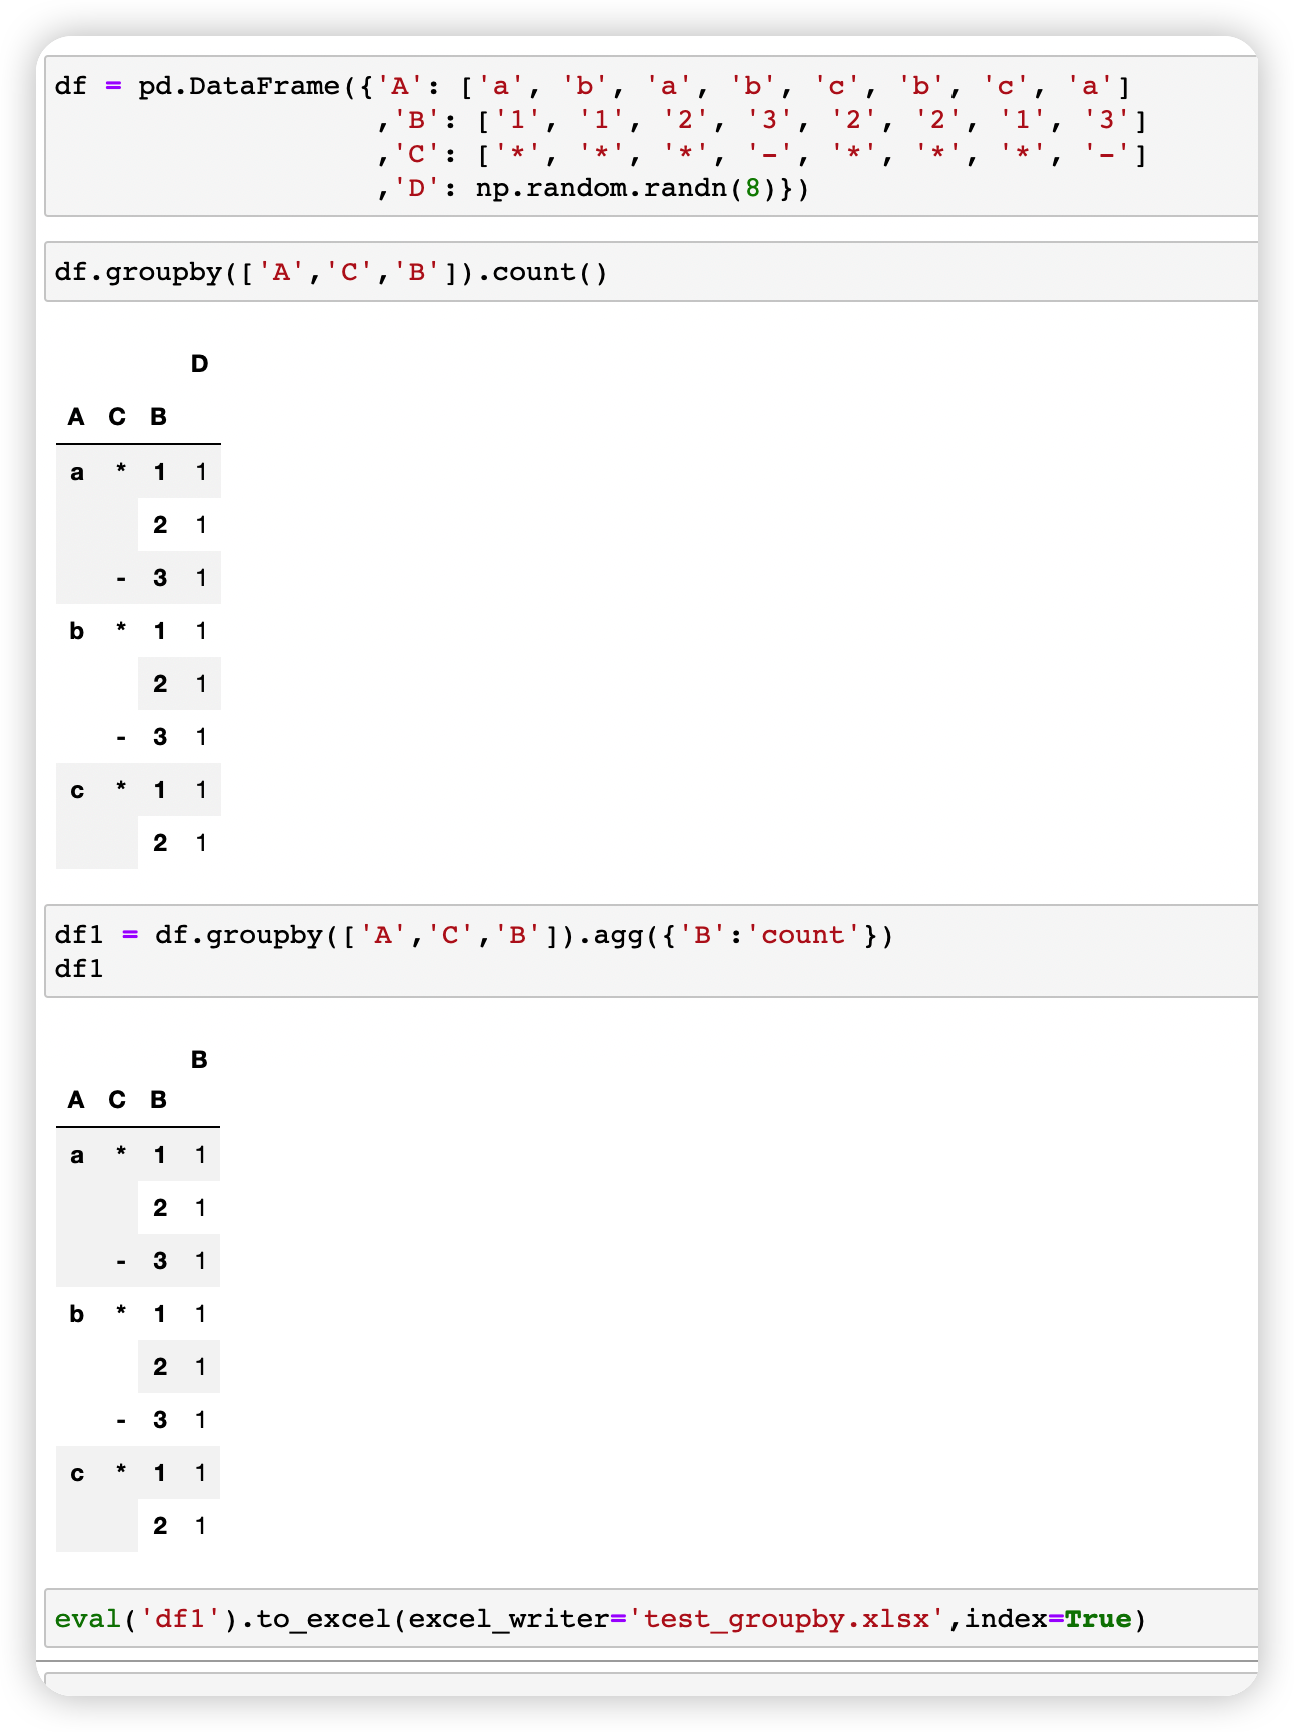
5、工程实践groupby的test1
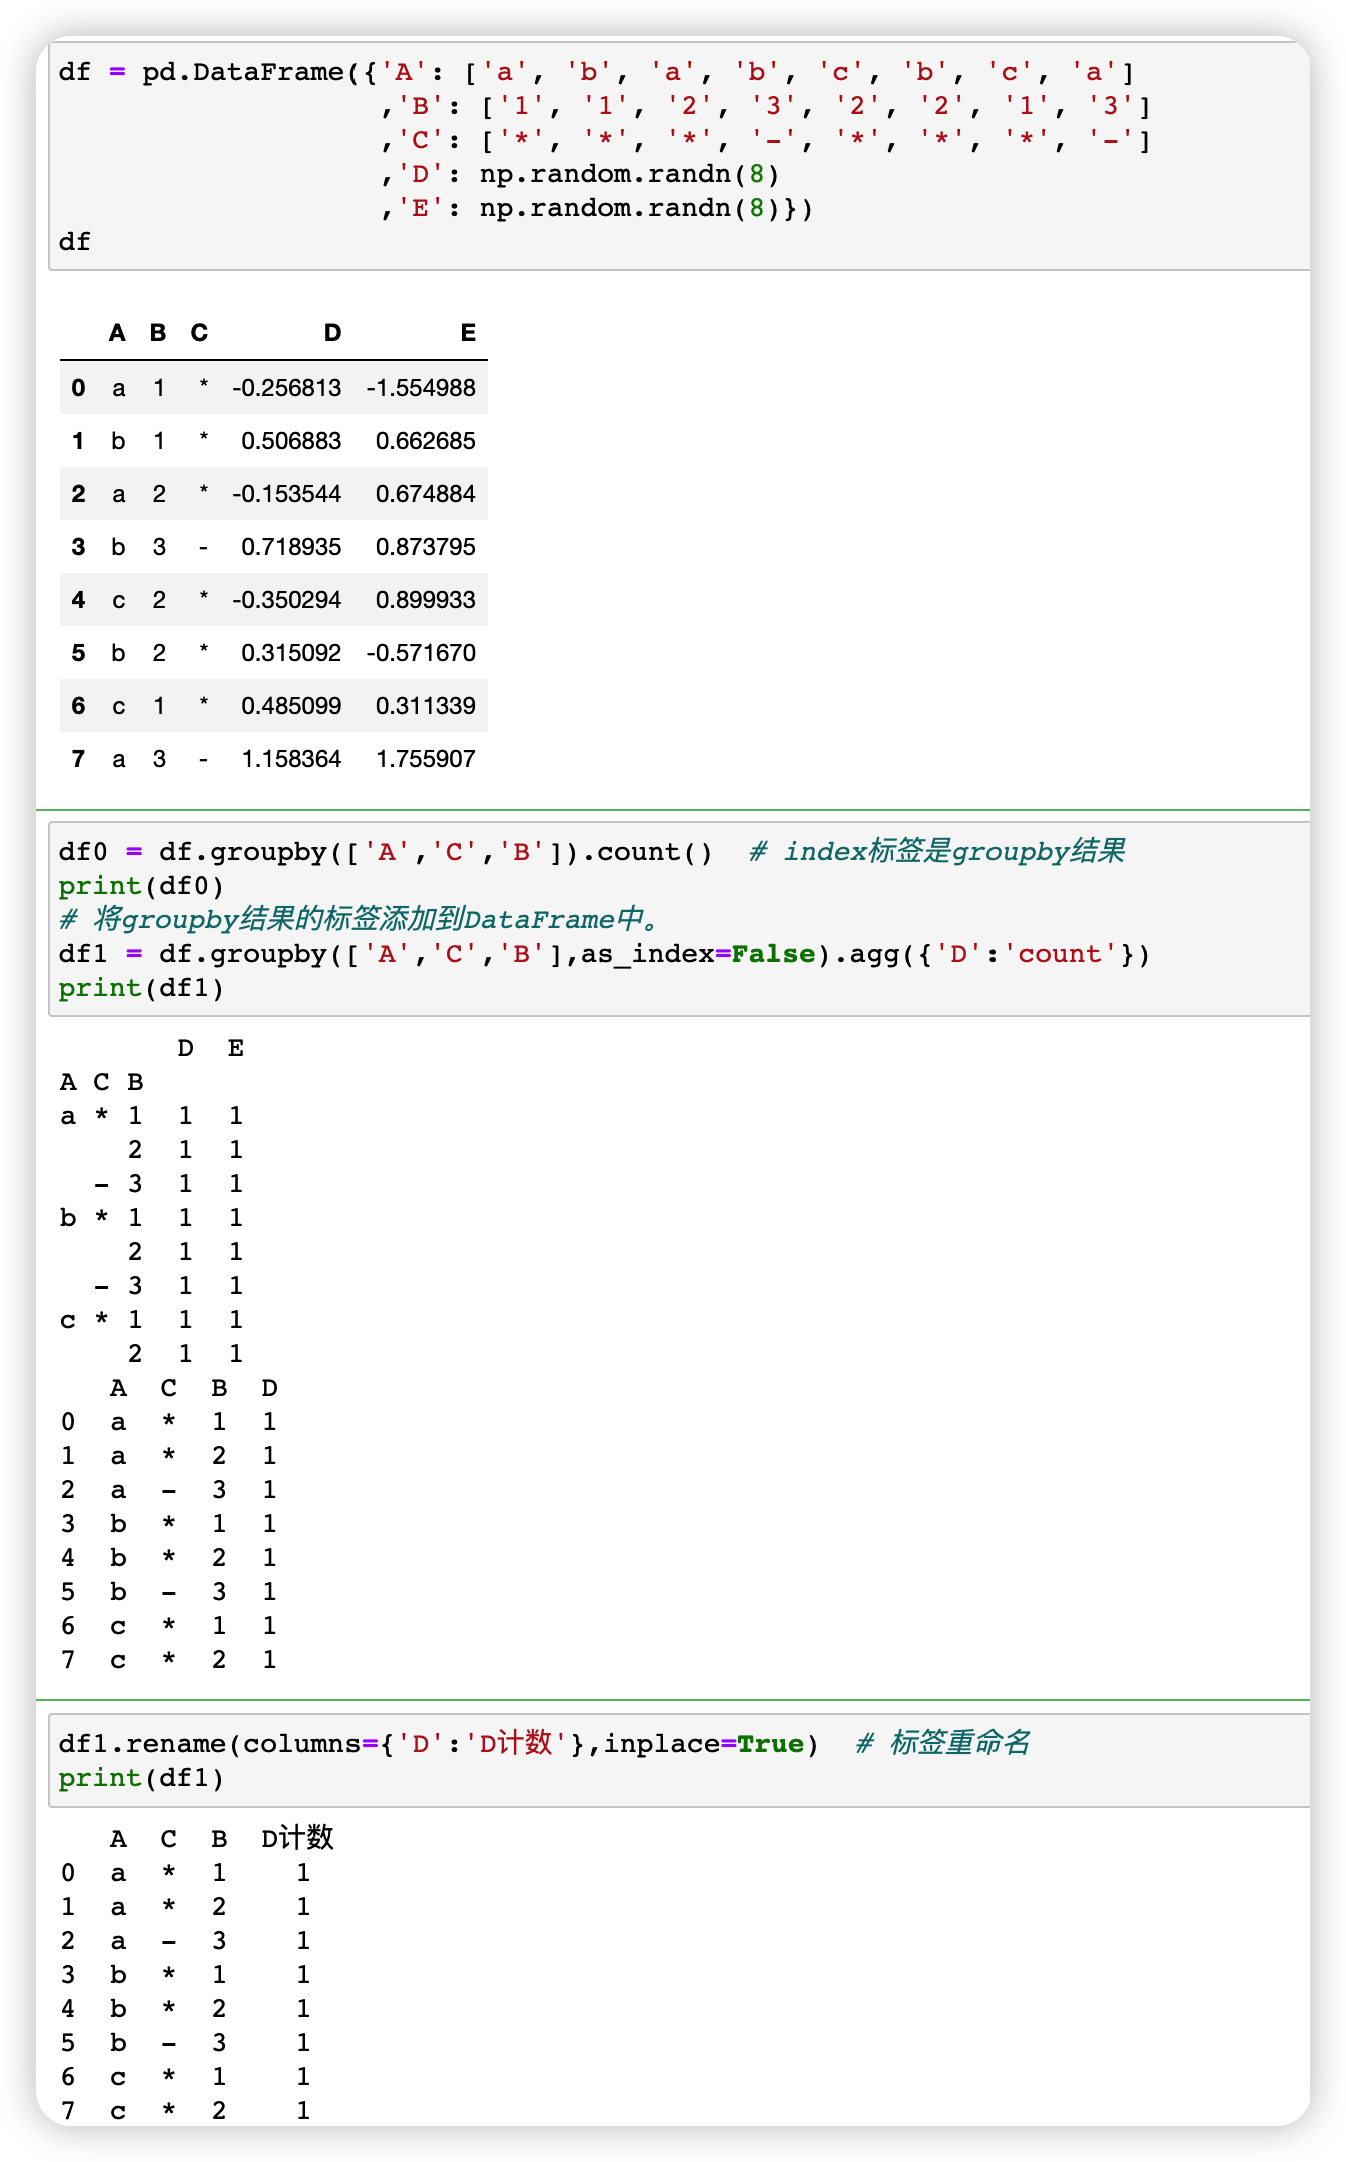
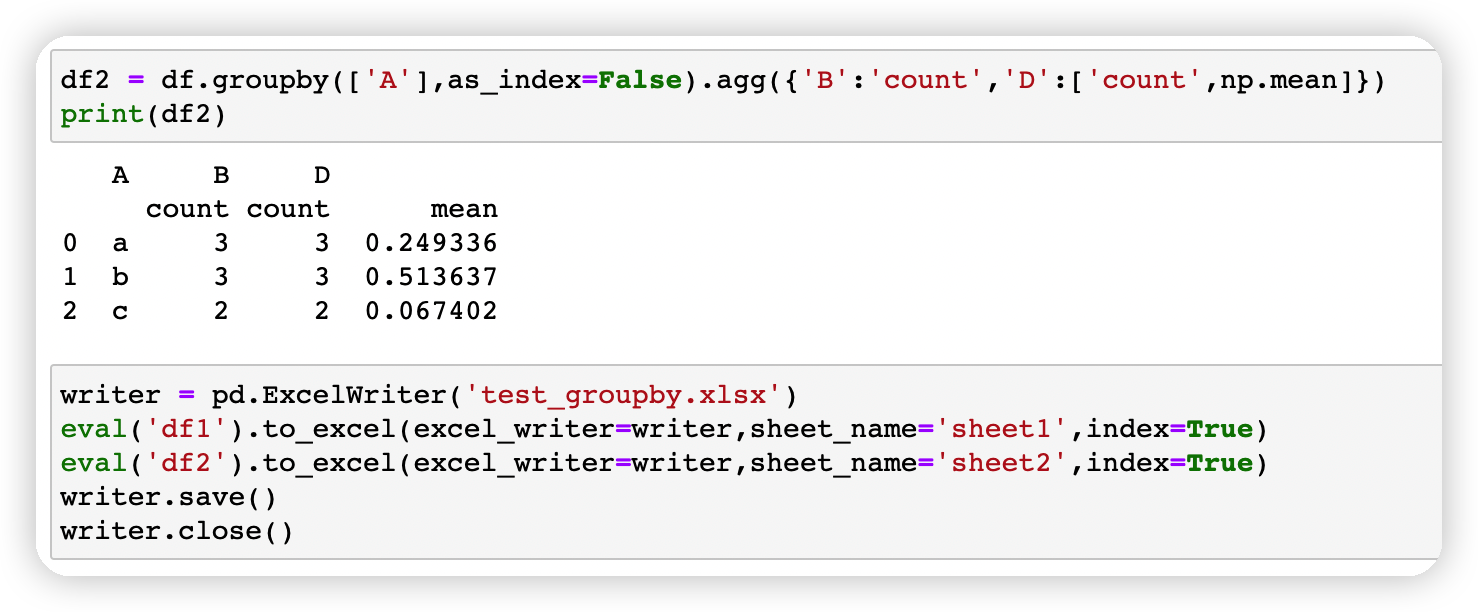
6、test2-as_index参数将分组结果标签加入到DataFrame中
————————————————
参考资料:https://blog.csdn.net/qq_41706810/article/details/105960139

若有收获,就点个赞吧
0 人点赞
