下载地址:https://prometheus.io/download/
安装 Prometheus Server
Prometheus 基于 Golang 编写,编译后的软件包,不依赖于任何的第三方依赖
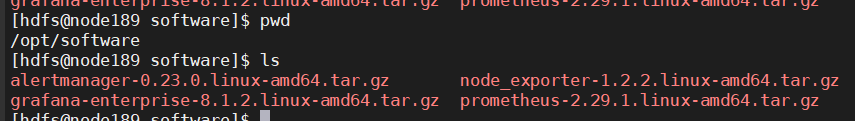
上传安装包
上传 prometheus-2.29.1.linux-amd64.tar.gz 到服务器的 /opt/software 目录
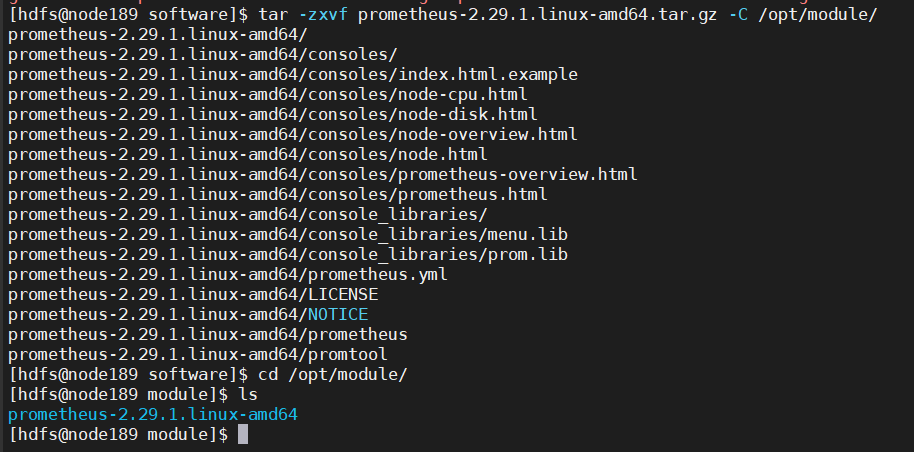
解压安装包
解压到 /opt/module 目录下
tar -zxvf prometheus-2.29.1.linux-amd64.tar.gz -C /opt/module/
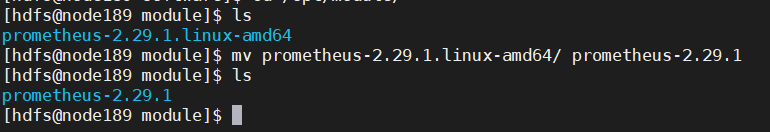
修改目录名
mv prometheus-2.29.1.linux-amd64 prometheus-2.29.1
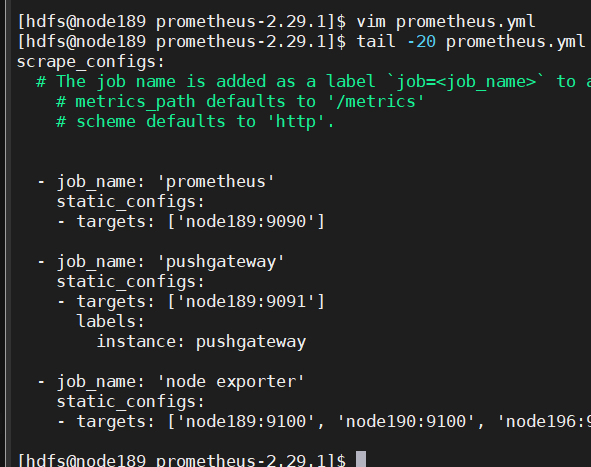
修改配置文件 prometheus.yml
vim prometheus.yml
在 scrape_configs 配置项下添加配置:
scrape_configs:
  - job_name: 'prometheus'
    static_configs:
    - targets: ['node189:9090']

  # 添加 PushGateway 监控配置
  - job_name: 'pushgateway'
    static_configs:
    - targets: ['node189:9091']
      labels:
        instance: pushgateway

  # 添加 Node Exporter 监控配置
  - job_name: 'node exporter'
    static_configs:
    - targets: ['node189:9100', 'node190:9100', 'node196:9100']
global 配置块:控制 Prometheus 服务器的全局配置
- scrape_interval:配置拉取数据的时间间隔,默认 : 1分钟
- evaluation_interval:规则验证(生成 alert )的时间间隔,默认 : 1分钟
rule_files 配置块:规则配置文件
scrape_configs 配置块:配置采集目标相关, prometheus 监视的目标。Prometheus自身的运行信息可以通过HTTP访问,所 Prometheus可以监控自己的运行数据。
- job_name:监控作业的名称
- static_configs:静态目标配置,就是固定从某个 target 拉取数据
- targets:指定监控的目标,其实就是从哪儿拉取数据。Prometheus会从 http://node189:9090/metrics 上拉取数据
Prometheus是可以在运行时自动加载配置的
启动时需要添加:
--web.enable-lifecycle
安装 Pushgateway
Prometheus 在正常情况下是采用拉模式从产生 metric 的作业或 exporter(如 : 专门监控主机的 NodeExporter)拉取监控数据
但要监控 Flink on YARN 作业,想要让 Prometheus 自动发现作业的提交、结束、自动拉取数据就比较困难
PushGateway 就是一个中转组件,通过配置 Flink on YARN 作业将 metric 推到 PushGateway,Prometheus 再从 PushGateway 拉取就可以
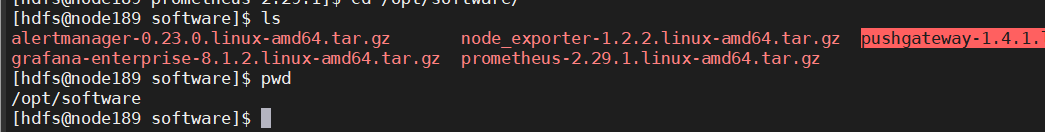
上传安装包
上传 pushgateway-1.4.1.linux-amd64.tar.gz 到虚拟机的 /opt/software 目录
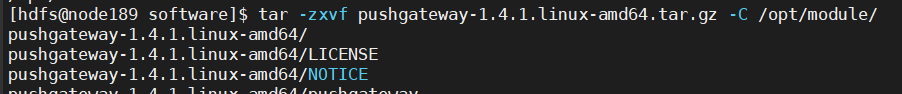
解压安装包
解压到 /opt/module 目录下
tar -zxvf pushgateway-1.4.1.linux-amd64.tar.gz -C /opt/module
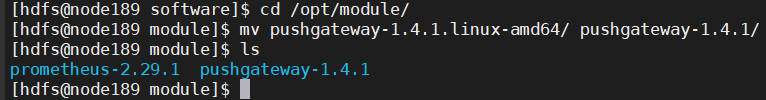
修改目录名
mv pushgateway-1.4.1.linux-amd64 pushgateway-1.4.1
安装 Alertmanager(选择性安装)
上传安装包
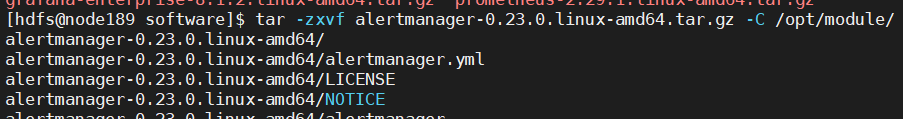
上传 alertmanager-0.23.0.linux-amd64.tar.gz 到虚拟机的 /opt/software 目录
解压安装包
解压到 /opt/module 目录下
tar -zxvf alertmanager-0.23.0.linux-amd64.tar.gz -C /opt/module
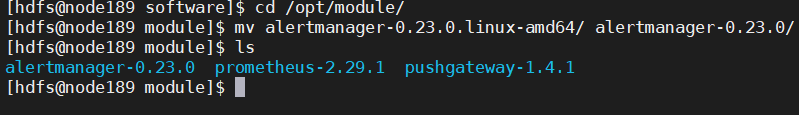
修改目录名
mv alertmanager-0.23.0.linux-amd64 alertmanager-0.23.0
安装 Node Exporter(选择性安装)
在 Prometheus 的架构设计中 , Prometheus Server 主要负责数据的收集,存储并且对外提供数据查询支持 , 而实际的监控样本数据的收集则是由 Exporter 完成
Prometheus 周期性的从 Exporter 暴露的 HTTP 服务地址(通常是 /metrics)拉取监控样本数据
使用 Node Exporter , 采集到主机的运行指标 , 如 : CPU, 内存,磁盘等信息
可以从https://prometheus.io/download/ 获取最新的 node exporter 版本的二进制包
上传安装包
上传 node_exporter-1.2.2.linux-amd64.tar.gz 到虚拟机的 /opt/software 目录
解压安装包
解压到 /opt/module 目录下
tar -zxvf node_exporter-1.2.2.linux-amd64.tar.gz -C /opt/module

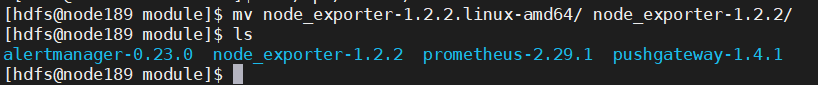
修改目录名
mv node_exporter-1.2.2.linux-amd64 node_exporter-1.2.2
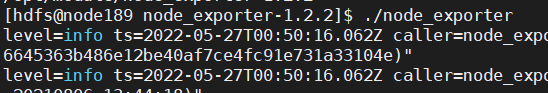
启动并通过页面查看是否成功
./node_exporter
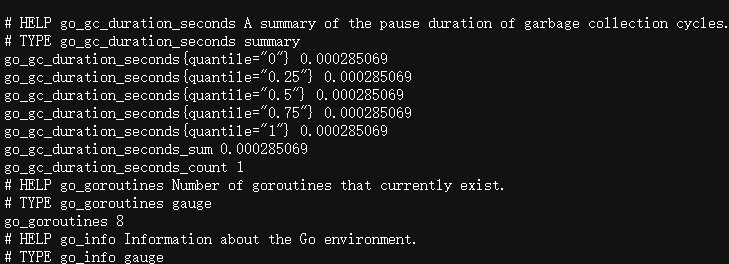
查看当前 node exporter 获取到的当前主机的所有监控数据
节点分发
将解压后的目录分发到要监控的节点
xsync node_exporter-1.2.2
设置为开机自启
创建service文件
sudo vim /usr/lib/systemd/system/node_exporter.service
[Unit]
Description=node_export
Documentation=https://github.com/prometheus/node_exporter
After=network.target

[Service]
Type=simple
User=hdfs
ExecStart= /opt/module/node_exporter-1.2.2/node_exporter
Restart=on-failure

[Install]
WantedBy=multi-user.target
分发文件
sudo xsync /usr/lib/systemd/system/node_exporter.service
设为开机自启动(所有机器都执行)
sudo systemctl enable node_exporter.service

启动服务(所有机器都执行)
sudo systemctl start node_exporter.service

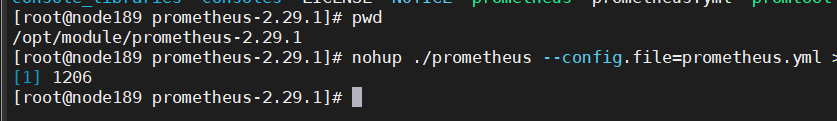
启动服务
Prometheus Server目录下执行启动命令
nohup ./prometheus --config.file=prometheus.yml > ./prometheus.log 2>&1 &
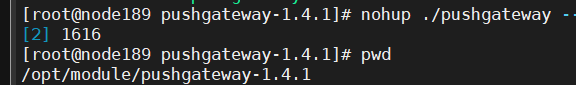
Pushgateway目录下执行启动命令
nohup ./pushgateway --web.listen-address :9091 > ./pushgateway.log 2>&1 &
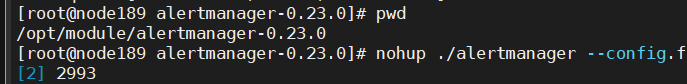
在 Alertmanager 目录下启动
nohup ./alertmanager --config.file=alertmanager.yml > ./alertmanager.log 2>&1 &
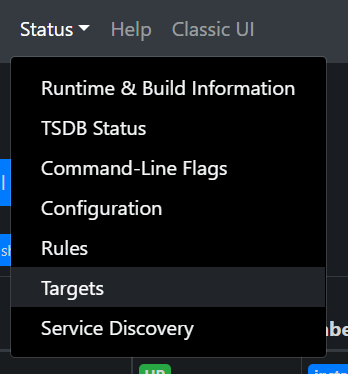
打开web页面查看
点击 Status,选中Targets:
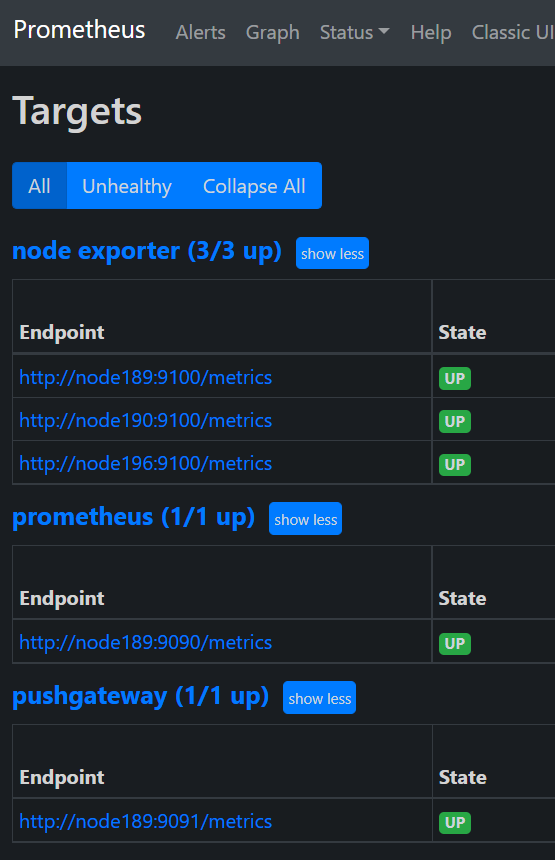
prometheus、pushgateway和node exporter都是up状态,表示安装启动成功:
与Grafana集成
grafana 是采用 Go 语言编写的开源应用,主要用于大规模指标数据的可视化展现,是网络架构和应用分析中最流行的时序数据展示工具,目前已经支持绝大部分常用的时序数据库
下载地址:https://grafana.com/grafana/download
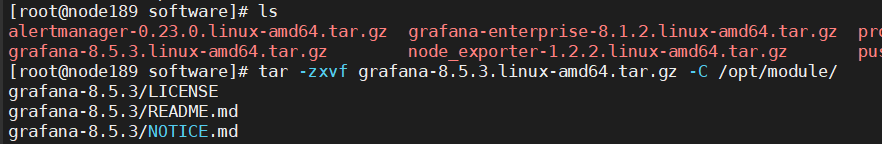
上传并解压
将 grafana-8.5.3.linux-amd64.tar.gz 上传至 /opt/software/ 目录下,解压:
tar -zxvf grafana-8.5.3.linux-amd64.tar.gz -C /opt/module/
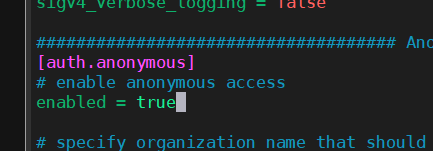
vim defaults.ini
设置为允许匿名访问
enabled = true
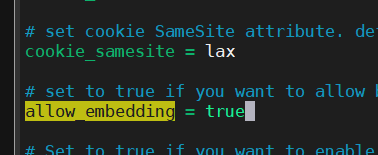
允许通过iframe访问
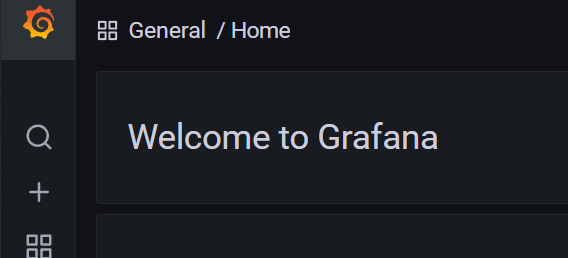
启动Grafana
nohup ./bin/grafana-server web > ./grafana.log 2>&1 &
- 打开web:http://node189:3000
- 默认用户名和密码:admin

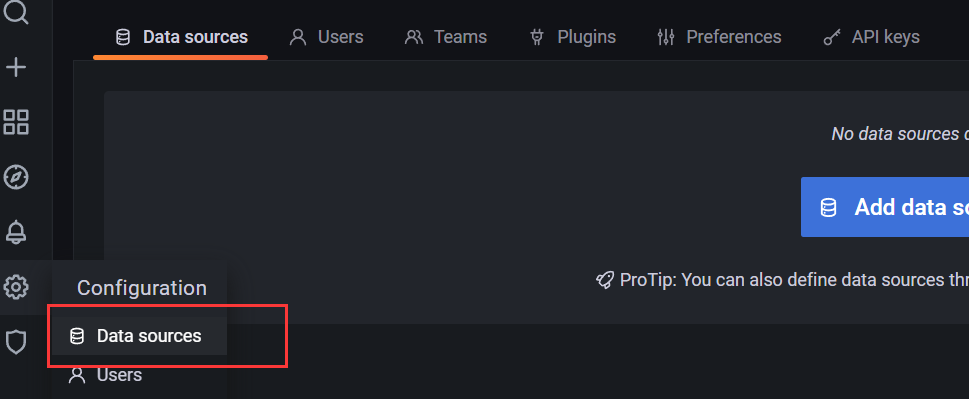
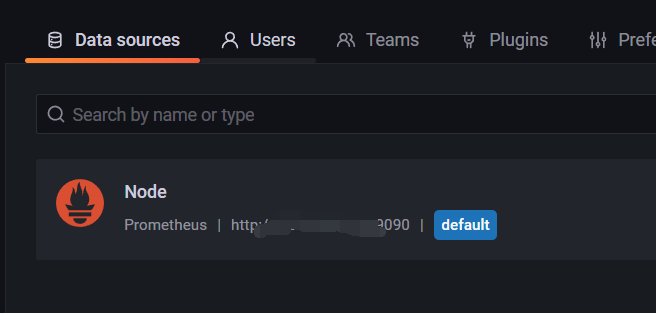
添加数据源 Prometheus
点击配置,点击Data Sources:
点击添加按钮:
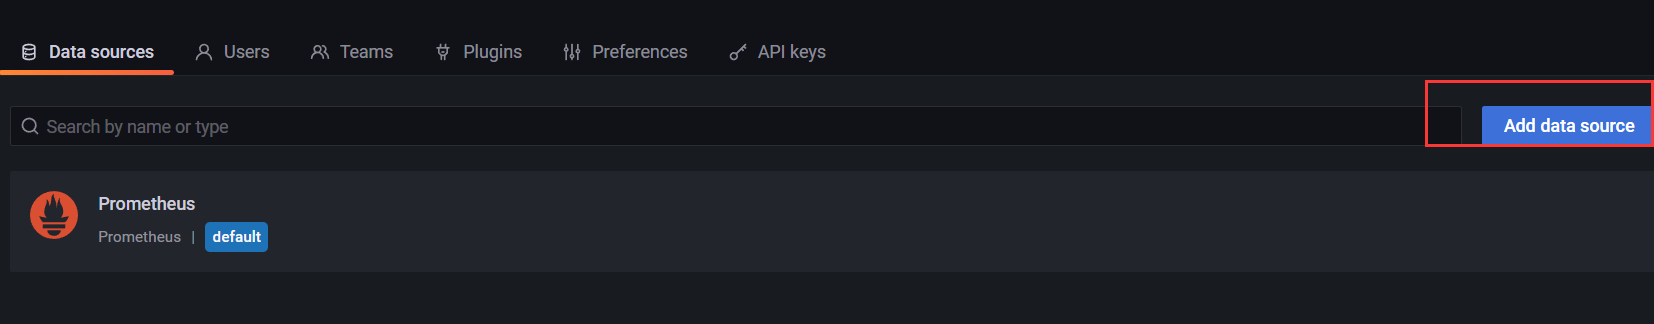
找到Prometheus,点击Select
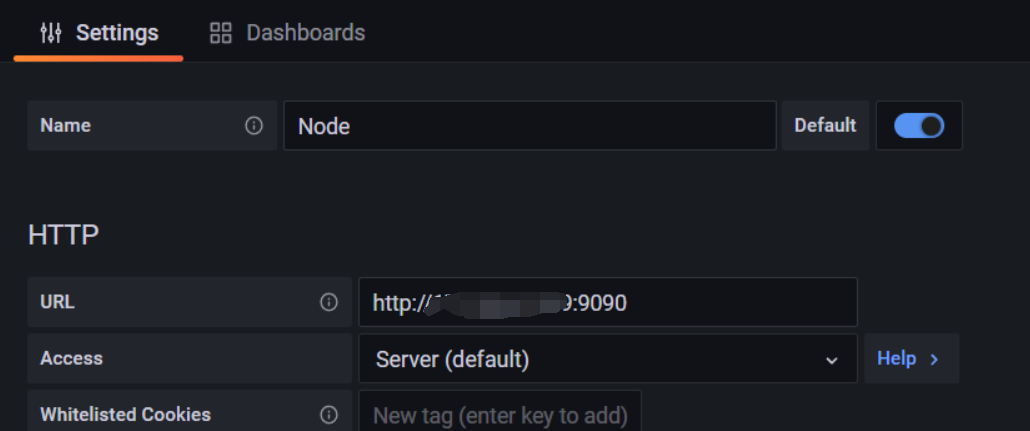
配置Prometheus Server地址:
http://xxx.xx.xx.xx:9090
点击下方的Save&Test:
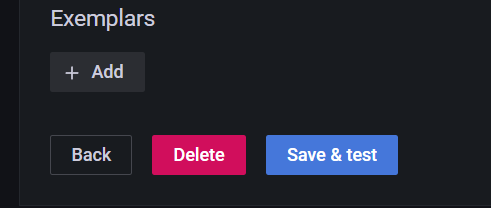
出现绿色的提示框,表示与Prometheus正常联通:
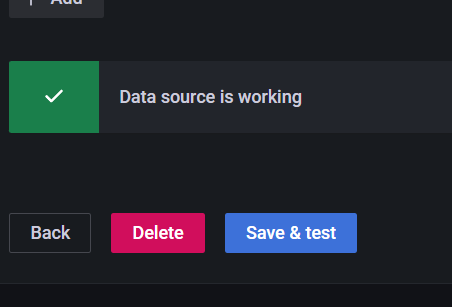
点击Back返回即可,可以看到Data Sources页面,出现了添加的Prometheus:
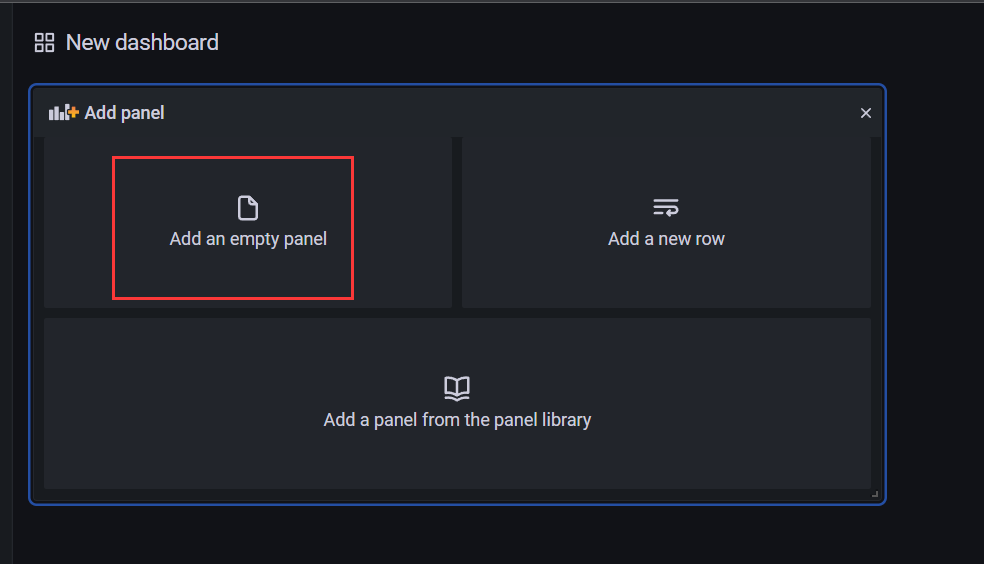
手动创建仪表盘Dashboard
点击左边栏的 “+”号,选择Dashboard:

添加新的仪表板,点击Add an empty panel:
配置仪表板监控项:
一个仪表板可以配置多个监控项,添加其他监控项:
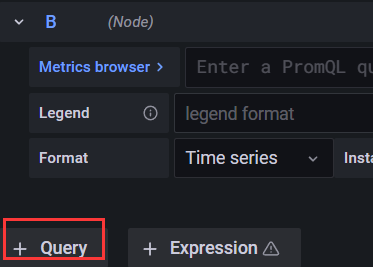
配置新的监控项:
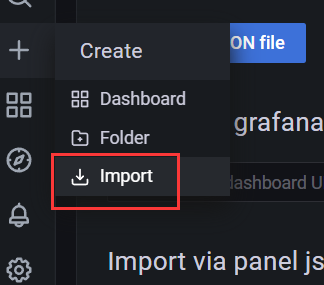
添加 Node Exporter 模板
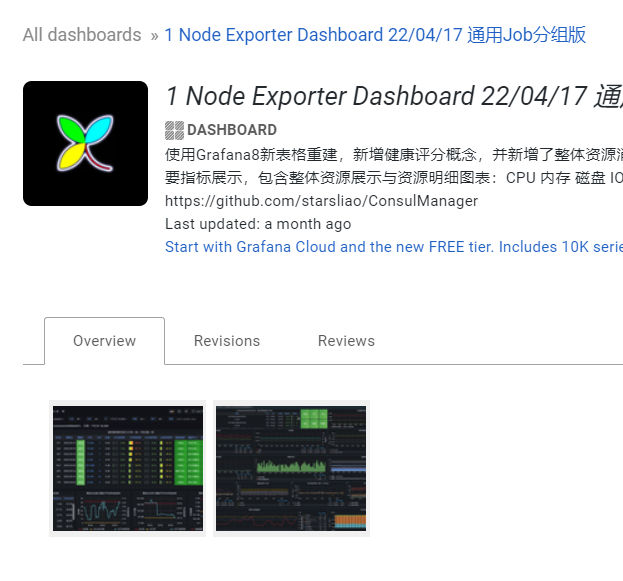
进入https://grafana.com/dashboards 页面
搜索Node Exporter,选择下载量最高的中文版本
https://grafana.com/grafana/dashboards/16098
下载模板 json 文件

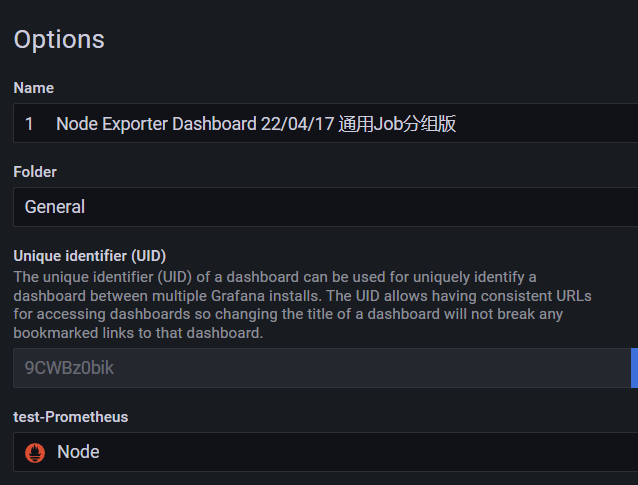
在Grafana中导入模板:
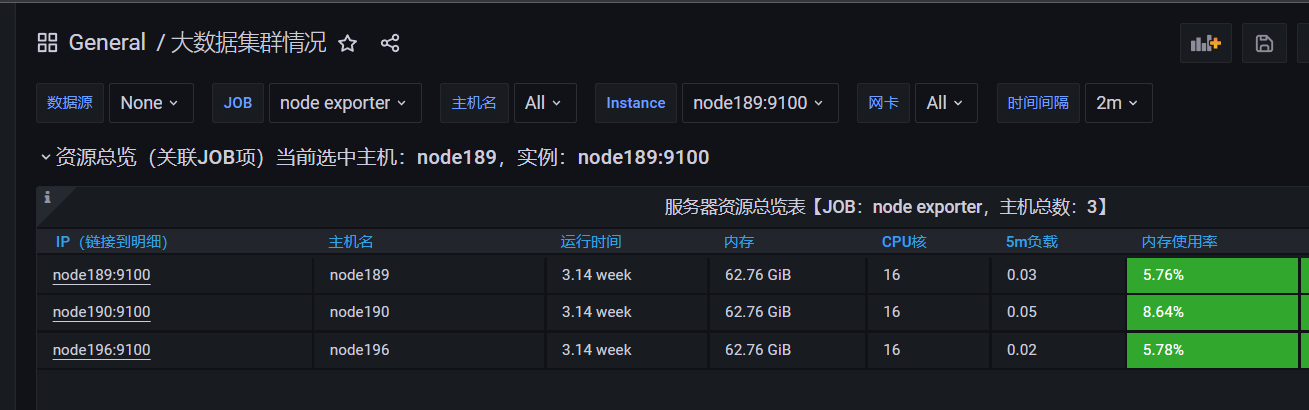
欣赏酷炫又详细的监控页:
组件启停脚本
vim monitor.sh
#!/bin/bash
case $1 in
"start"){
  echo '----- 启动 prometheus -----'
  nohup /opt/module/prometheus-2.29.1/prometheus --web.enable-lifecycle --web.enable-admin-api --config.file=/opt/module/prometheus-2.29.1/prometheus.yml > /opt/module/prometheus-2.29.1/prometheus.log 2>&1 &
  echo '----- 启动 pushgateway -----'
  nohup /opt/module/pushgateway-1.4.1/pushgateway --web.listen-address :9091 > /opt/module/pushgateway-1.4.1/pushgateway.log 2>&1 &
  echo '----- 启动 grafana -----'
  nohup /opt/module/grafana-8.5.6/bin/grafana-server --homepath /opt/module/grafana-8.5.6 web > /opt/module/grafana-8.5.6/grafana.log 2>&1 &
};;
"stop"){
  echo '----- 停止 grafana -----'
  pgrep -f 'grafana' | xargs kill
  echo '----- 停止 pushgateway -----'
  pgrep -f 'pushgateway-1.4.1' | xargs kill
  echo '----- 停止 prometheus -----'
  pgrep -f 'prometheus-2.29.1' | xargs kill
};;
esac
- 脚本添加执行权限
chmod 777 monitor.sh
curl -X POST http://localhost:9090/-/reload

若有收获,就点个赞吧
0 人点赞
