Overview
In this example, we’ll study trip animation widget functionality.
This widget might be useful for different use cases, but mainly it might be used for a Tracking in a realtime, researching movement of the entities and visualizing it.
This guide was written for cloud, so some steps will be a little different from Community Edition.
It’s capable of all further versions.
Setting up Trip Animation Widget
Firstly you need to create a device from which will collect telemetry.
Also, you may use any device you have with a coordinates telemetry (longitude and latitude).
This can be any device which receives its coordinates in a realtime.
Our device receives its longitude, latitude, speed, status, and coordinates of polygon.
Longitude and latitude are the key data for map visualization so that you’ll see it on a widget at the dashboard which you chose.
In our example, we use an emulator written in javascript to receive telemetry and visualize it on the dashboard.
Creating a dashboard
We need to create a dashboard where our telemetry will be visualized. It might be useful if your goal is to track how your entity moved in a specific period.
We can use an existing one or create a new dashboard for our new use case.
In our example, we create a new dashboard called “Dashboard1” for our guide reasons.
Adding widget
Now we will open our empty dashboard and edit it.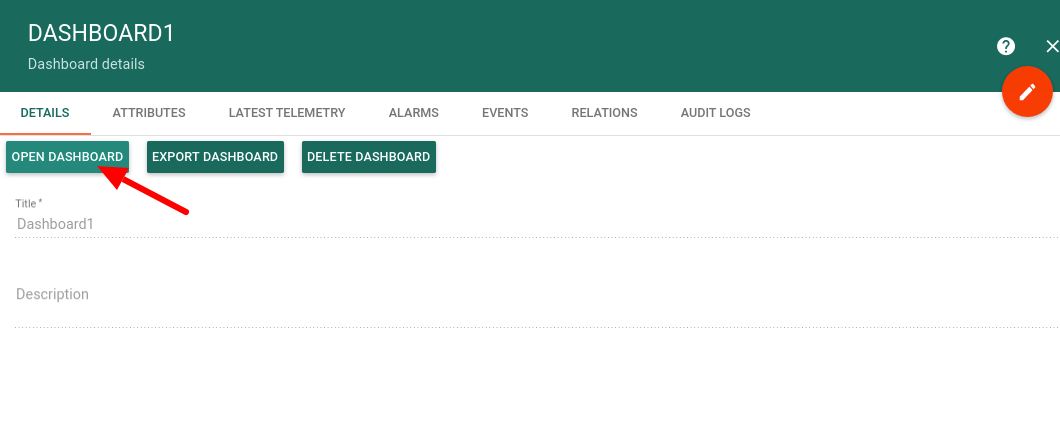
Now we have an empty dashboard. Let’s fill it with some content.
Firstly we need to create an alias to specify entity from which we’ll receive telemetry data.
Our entity in this guide will be “Tracker1” device which we created previously. We’ll give “GeoData1” name to our alias.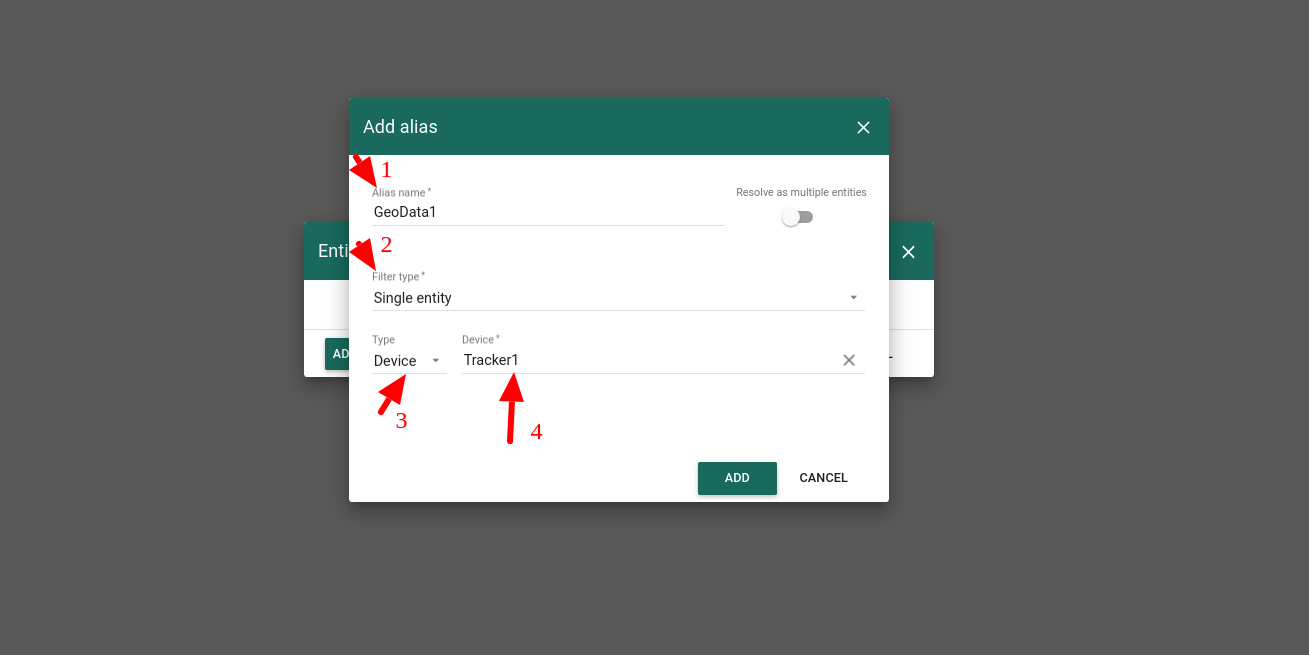
Now we go for adding a widget!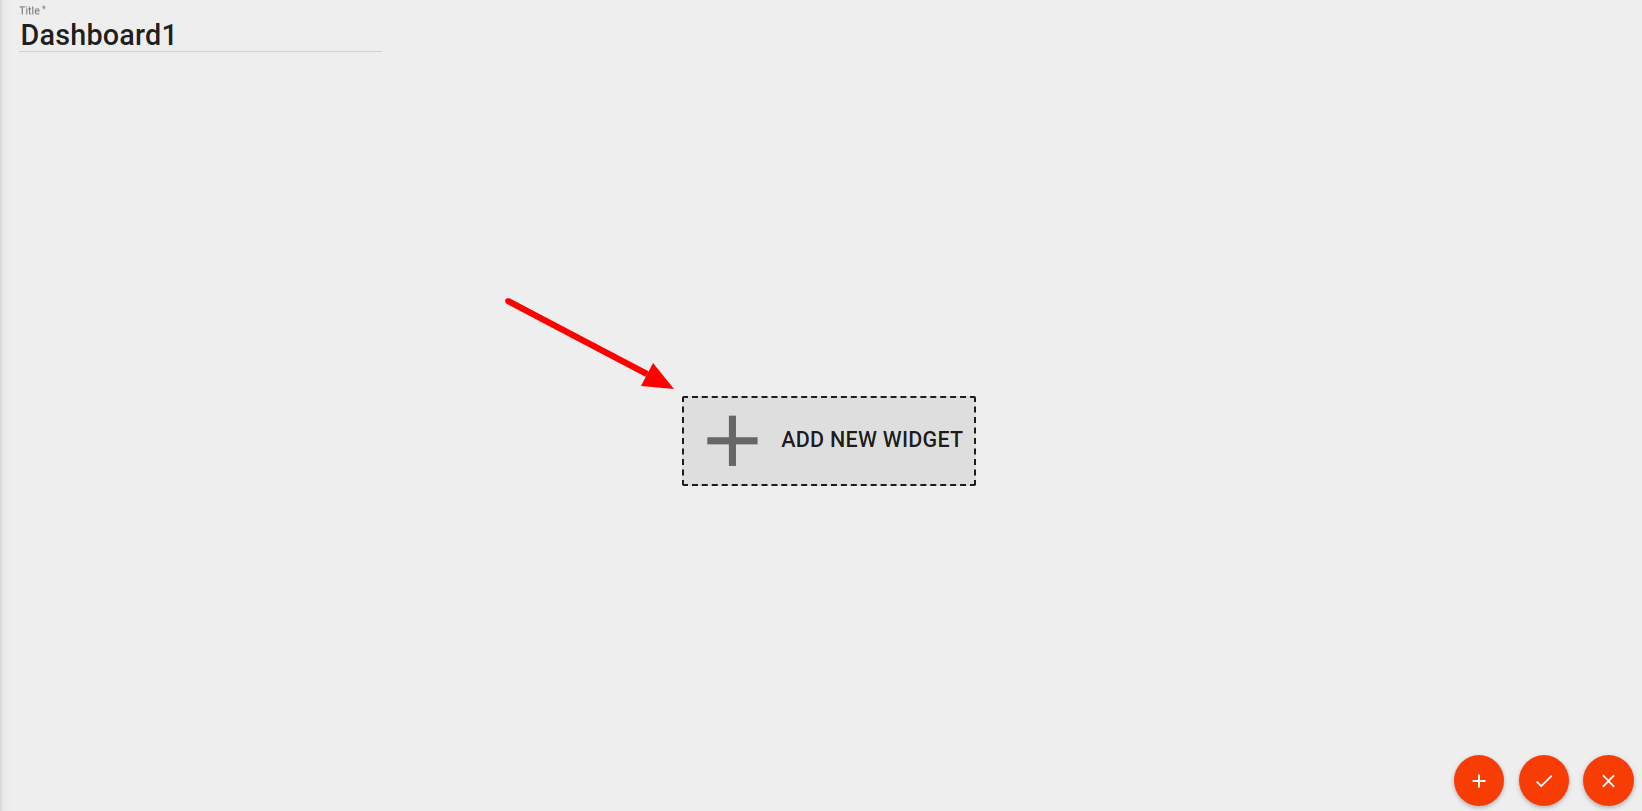
Trip animation widget is located in Maps bundle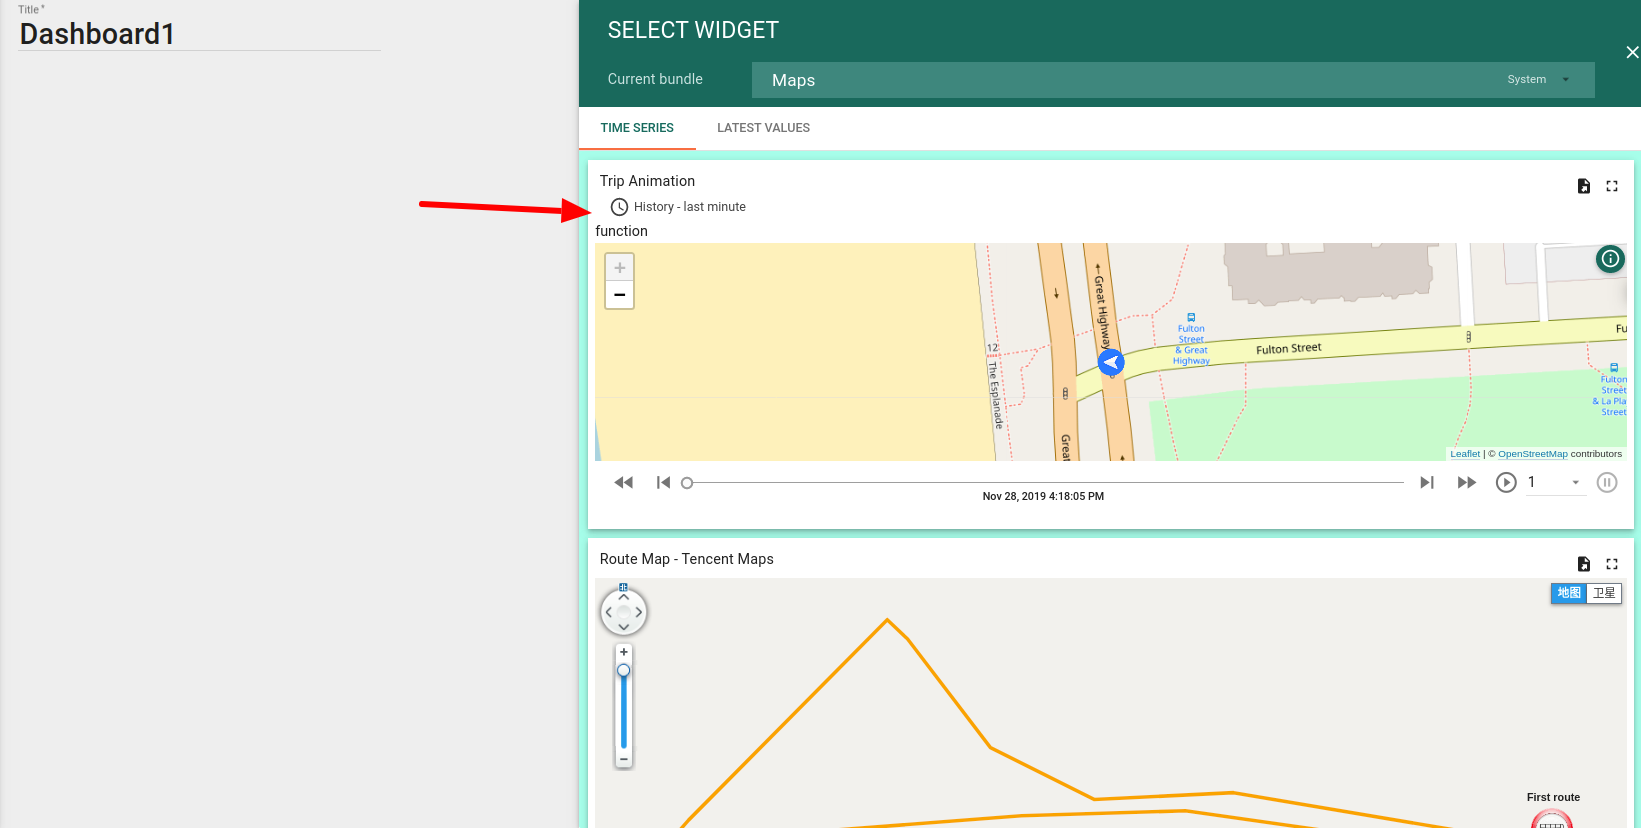
In our widget we add coordinates, latitude, longitude, speed and status from our alias “GeoData1” as our parameters.
They have the same labels as their keys are. Secondly, we create a widget on which we will visualize our telemetry.
We use Trip Animation Widget in our guide. It’s located in Maps Bundle, Time series tab.
Also, we’ll go for “Use dashboard timewindow” so that we’ll make it easier to synchronise our data.
In addition to this, we’ll use last minute received data to visualize and change aggregation function to None, because we don’t need to guess possible data value for the next time period, we receive data in realtime without any errors.
Finally, we turn on our emulator (link on it you may find below, in “Device emulator” section).
Widget is ready
Now we can take a look at how our device is being moving for the last minute in a realtime.
We also can speed up our timeline cursor up to 1,5,10,25 times so that we can make a check on its routing much faster.
Don’t forget to press the “Start” button.
Customization
Settings tab
Now, when we got the basics of what our widget can provide, let us go for editing its settings to make it more functional and eye-catching. Firstly we go to settings, there we can specify:
- Title of widget, its style
- Title icon, icon colour, icon size in a px
- Title tooltip Show/Hide
- Enable/disable drop shadow
- Enable/disable fullscreen mode for widget
- Change widget style
- Enable/disable data export
- Background color, text color, padding, margin
- Specify mobile settings
Advanced tab
In a settings tab, we can specify unique parametres for Trip animation widget for functionality that only it can provide. We have:
- Map provider

- Normalization data step (ms)
- Latitude & Longitude key names - you can specify name based on which widget will be updated. It uses data based on the label of the data. So that you may specify label “data-1” for the longitude key value and get longitude from the alias after we edit longitude key name as “data-1”.

- Widget label, or specify label function (you may change data contained in a widget label based on data, dsData, dsIndex)

Label function:
var speed = dsData['speed'];var res;if (speed > 55) {res = "Too Fast"} else {res = "Everything is OK"}return res;
- Show/Hide Tooltip, its color, its font color,the opacity of tooltip and tooltip text or use tooltip function (you may change data contained in a tooltip based on data, dsData, dsIndex)
Tooltip function:
var speed = dsData['speed'];var res;if (speed > 0) {res = "${entityName} <b>Speed:</b> " + String(speed)} else {res = "On The stop"}return res;
- Path color or specify path color function (you may change data contained in a tooltip based on data, dsData, dsIndex) - the color of the marker moves
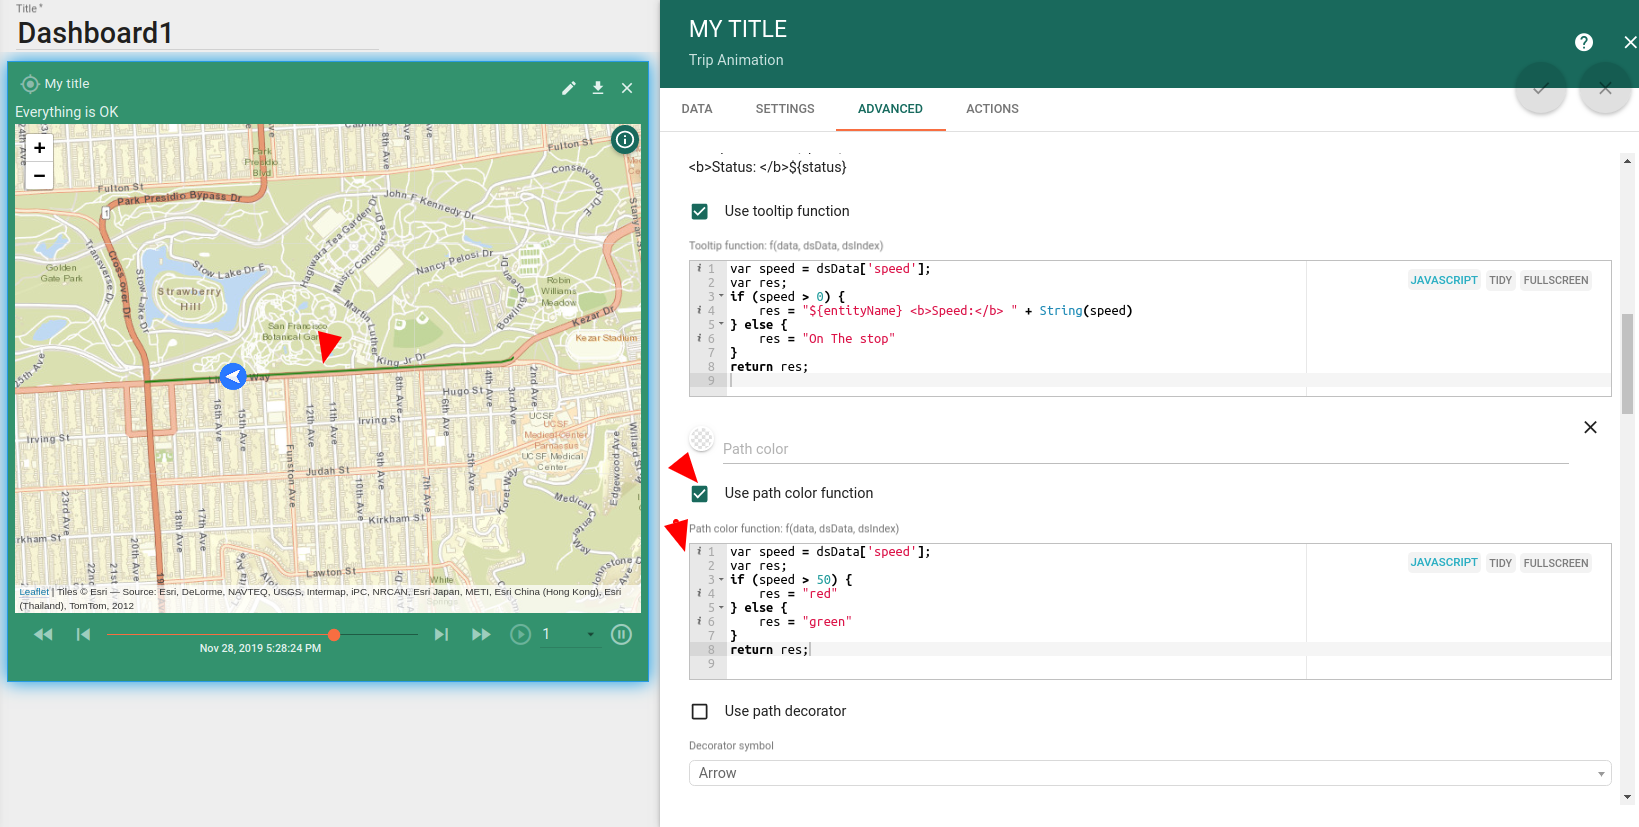
Path color function:
var speed = dsData['speed'];var res;if (speed > 50) {res = "red"} else {res = "green"}return res;
- Path decorator, its size in px, end/beginning offset, decorator repeater, stroke weight and stroke opacity

Polygon options
What’s a polygon? It’s a plane figure that’s described by a finite number of dots. We use polygon which is based on coordinates that are specified within the device we use, but you can use any other entity.
You may mark your assets and any other entities with a polygon option. For the polygon, we can specify the next settings. Polygon coordinates are being received in a format:
[[1CoordinateLatitude,1CoordinateLatitude],[2CoordinateLatitude,2CoordinateLatitude]...[nCoordinateLatitude,nCoordinateLatitude]]
where n - number of coordinates which polygon is described by.
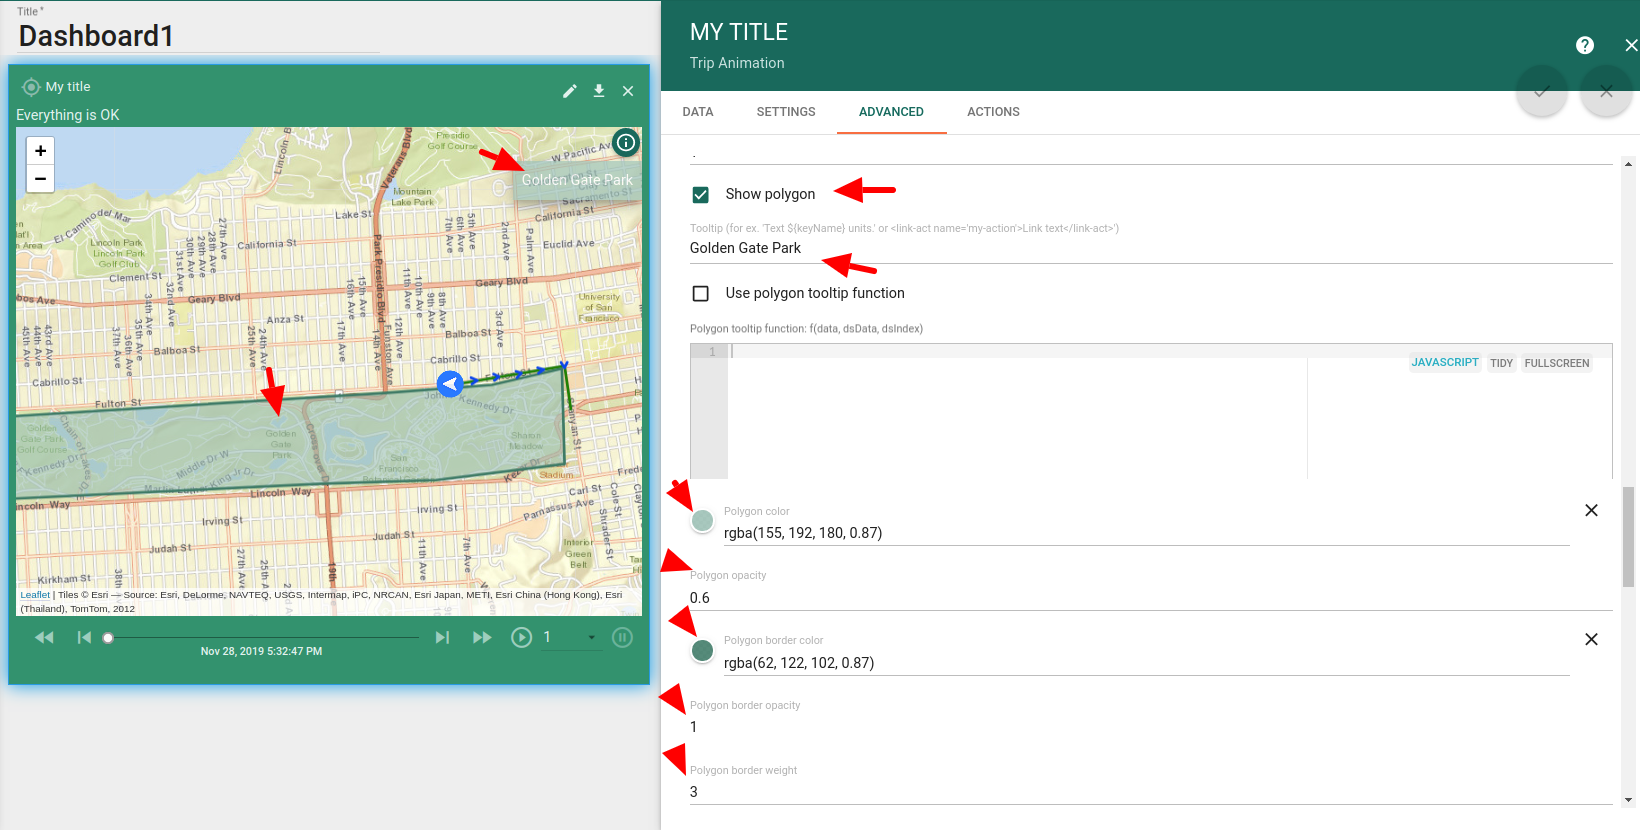
- Show/Hide polygon
- Polygon tooltip text or polygon tooltip function (you may change data contained in a polygon tooltip based on data, dsData, dsIndex)
- Polygon color, opacity
- Polygon border color, opacity, weight
- Polygon color function (you may change polygon color based on data, dsData, dsIndex)
Points options
The next option is a show points option. Points are a telemetry data updates so that you can check each. For the points next options are available.
- Show/Hide points
- Point color
- Point size px
- Use point as an anchor, point as an anchor function (you may change data contained in a polygon tooltip based on data, dsData, dsIndex)
- Independent point tooltip
- Auto-close point popup
Marker options
In addition to all of this, there are some settings for the marker and you can specify next settings for it:
- Color for default marker
- Custom marker image
- Custom marker image size px
- Set additional rotation angle for marker
- Marker image function (you may change marker image, marker image color based on data, dsData, dsIndex)
- Specify other possible marker images, which can be used in a marker image function

Marker image function:
var speed = dsData['speed'];var res;if (speed > 55) {res = images[0];} else {res = images[1];}return res;
Video tutorial
We also recommend you to review this video tutorial.
Device emulator
Emulator
In order to execute script go for a command line:
node timeseries-map-bus.js $ACCESSTOKEN
Where $ACCESSTOKEN is your Device access token.
$ACCESSTOKEN is located in a Device details. 
Emulator is capable with Node.js v8.10.0

若有收获,就点个赞吧
0 人点赞
