adaboost.py
元算法是对其他算法进行组合的一种方式。
bagging:自举汇聚法(bootstrap aggregating),在原始数据集中选取S次得到S个新数据集的方法。类似于放回取样。
boosting:集中关注被已有分类器错分的数据获得新的分类器。
bagging分类器的权重相等,而boosting中的分类器权重并不相等,每个权重代表分类器在上一轮迭代中的成功度。
AdaBoost是其中一种boosting算法。
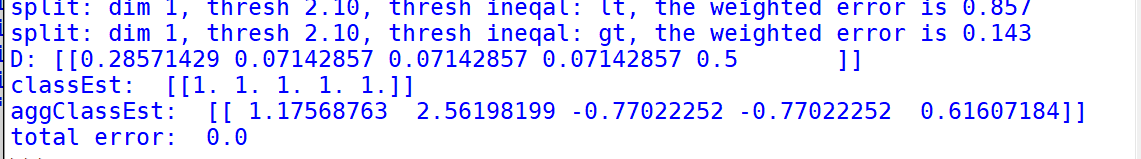
基于单层决策树构建弱分类器
只有单层,根据单个特征进行分类,因此类似于一个树桩。
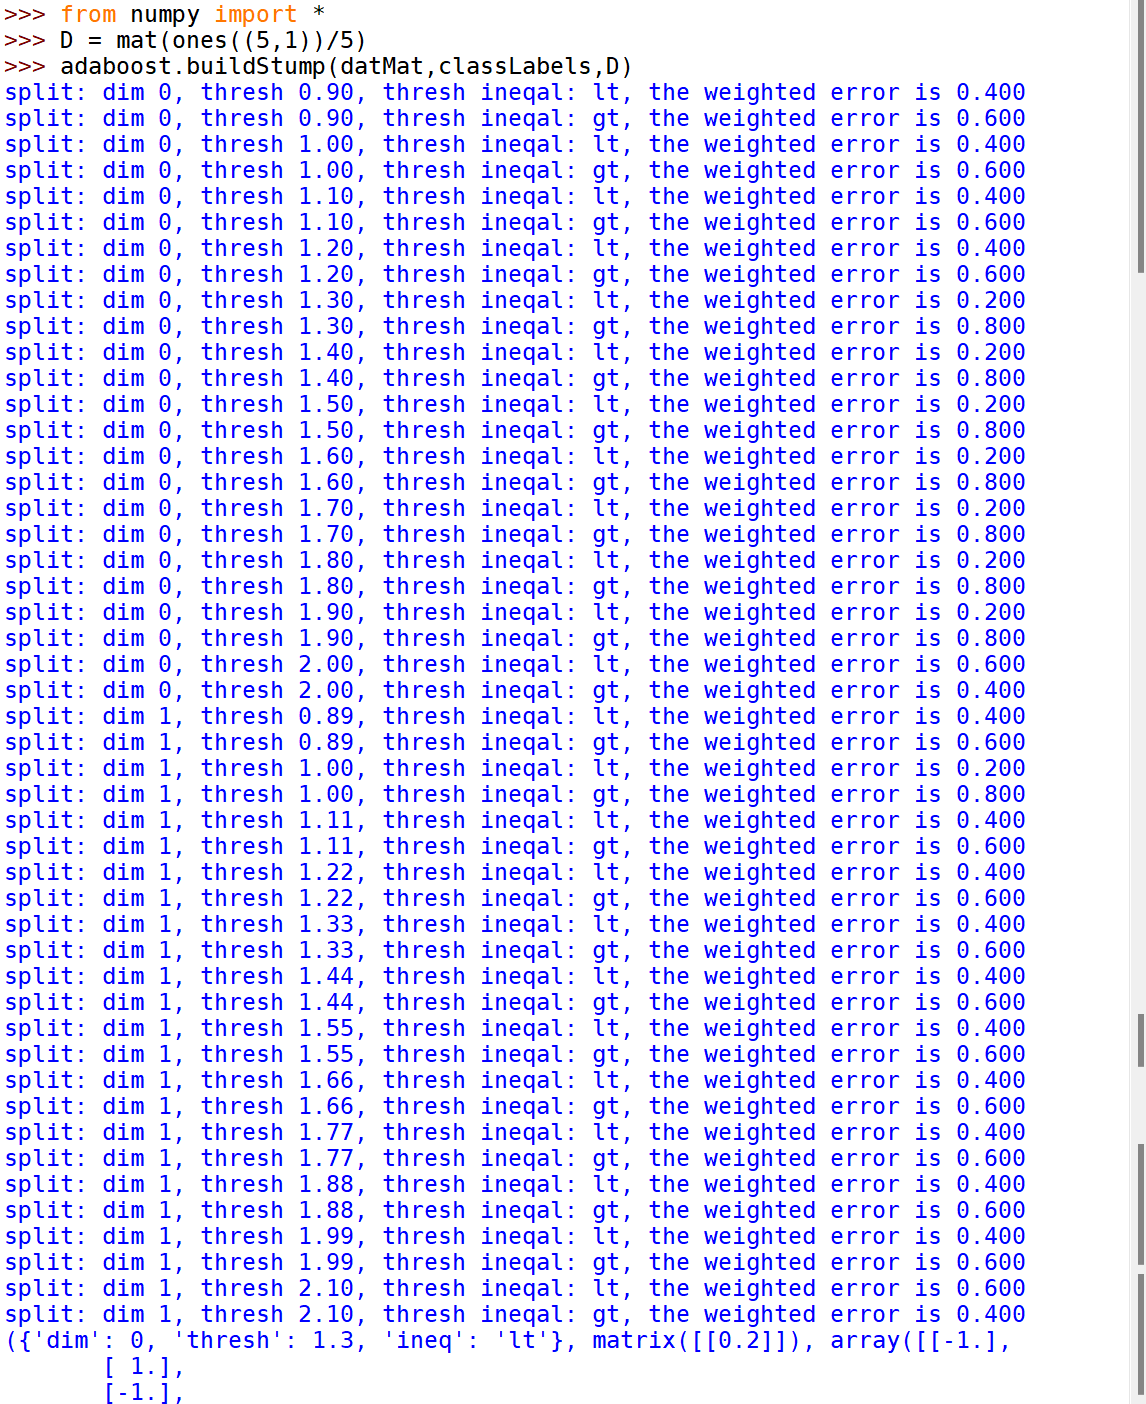
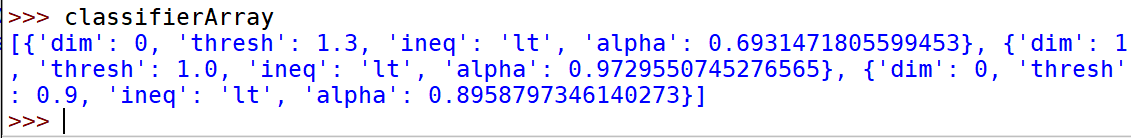
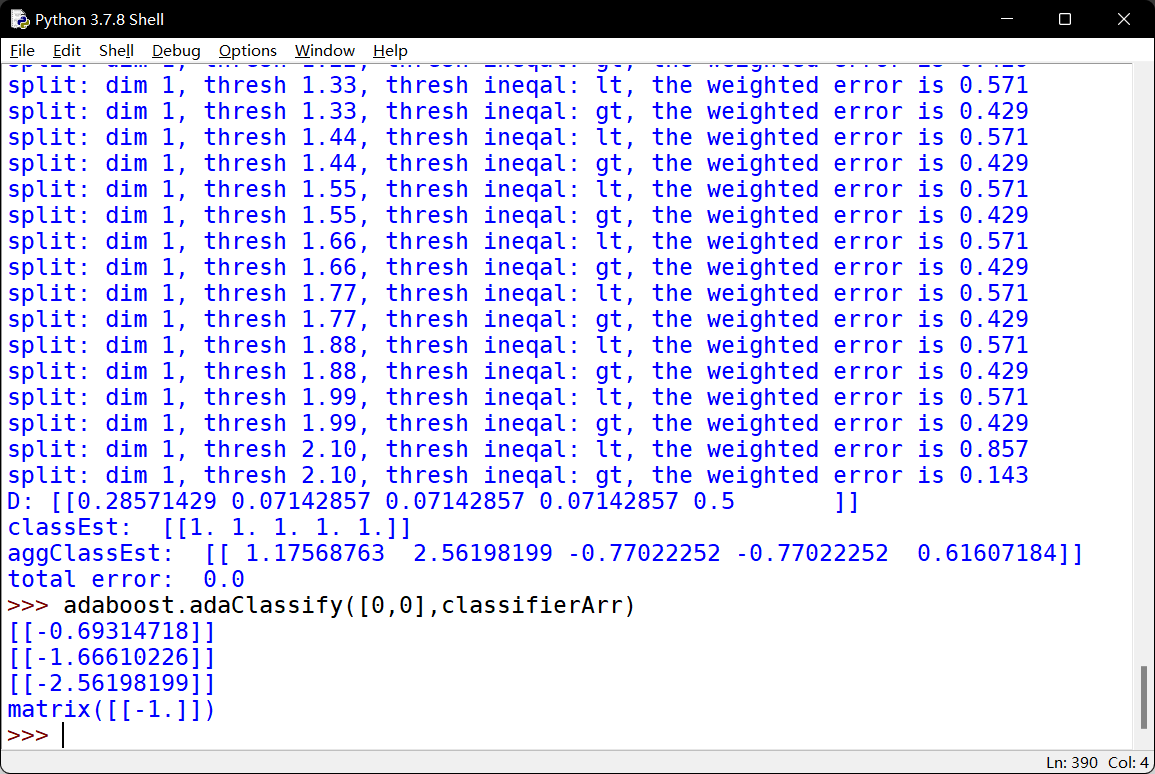
完整AdaBoost算法的实现

测试算法:基于AdaBoost的分类
示例:在一个难数据集上应用AdaBoost
非均衡分类的问题:
很多时候分类的代价并不相等,例如判断癌症
其他分类性能度量指标:正确率,召回率及ROC曲线
混淆矩阵:
真阳TP
真阴TN
假阳FP
假阴FN
正确率=TP/(TP+FP)
召回率=TP/(TP+FN)
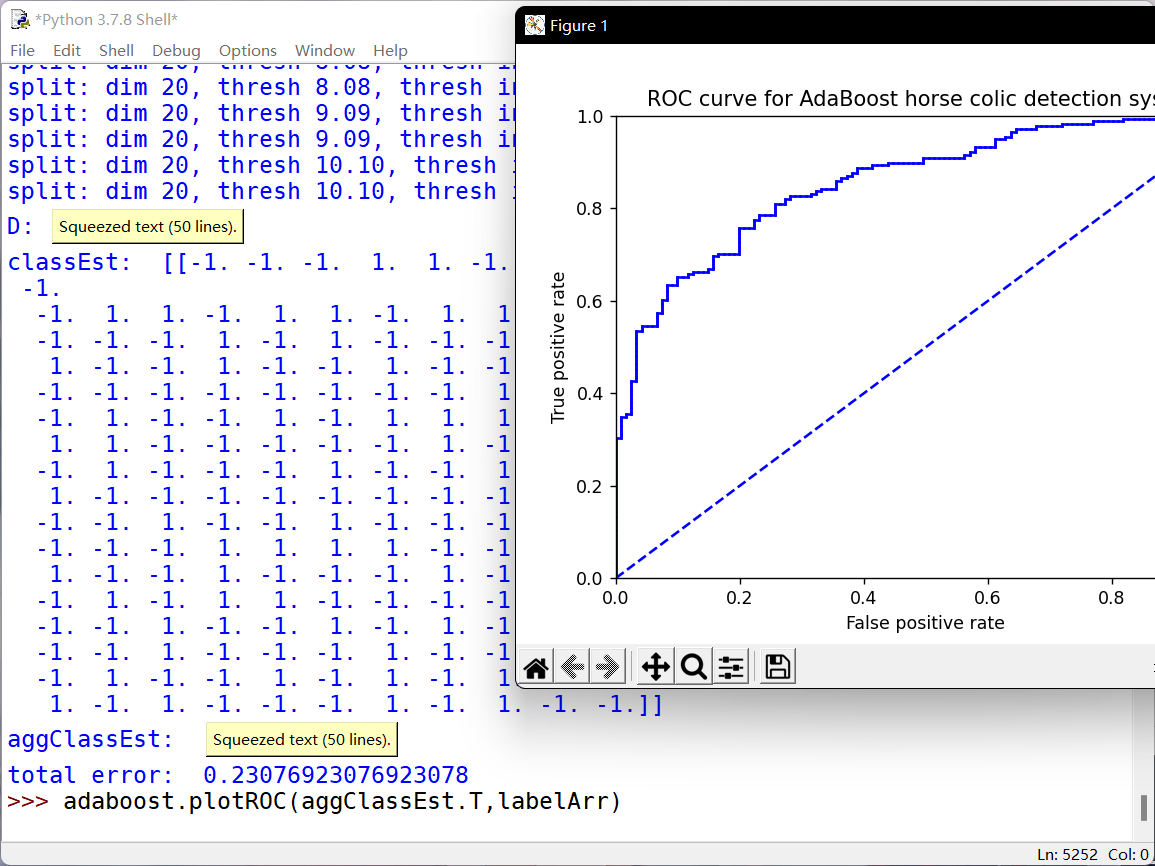
ROC曲线:当阈值变化时真阳率与假阳率的变化情况
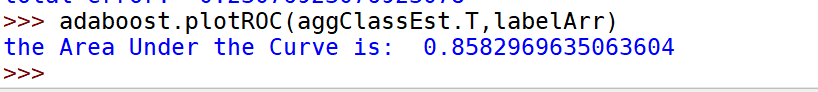
AUC:在图线下面的面积大小。完美分类器的AUC为1.0,随机猜测的为0.5
def plotROC(predStrengths, classLabels):import matplotlib.pyplot as pltcur = (1.0,1.0) #cursorySum = 0.0 #variable to calculate AUCnumPosClas = sum(array(classLabels)==1.0)yStep = 1/float(numPosClas); xStep = 1/float(len(classLabels)-numPosClas)sortedIndicies = predStrengths.argsort()#get sorted index, it's reversefig = plt.figure()fig.clf()ax = plt.subplot(111)#loop through all the values, drawing a line segment at each pointfor index in sortedIndicies.tolist()[0]:if classLabels[index] == 1.0:delX = 0; delY = yStep;else:delX = xStep; delY = 0;ySum += cur[1]#draw line from cur to (cur[0]-delX,cur[1]-delY)ax.plot([cur[0],cur[0]-delX],[cur[1],cur[1]-delY], c='b')cur = (cur[0]-delX,cur[1]-delY)ax.plot([0,1],[0,1],'b--')plt.xlabel('False positive rate'); plt.ylabel('True positive rate')plt.title('ROC curve for AdaBoost horse colic detection system')ax.axis([0,1,0,1])plt.show()print("the Area Under the Curve is: ",ySum*xStep)

若有收获,就点个赞吧
0 人点赞
