ID3算法:
香农熵:
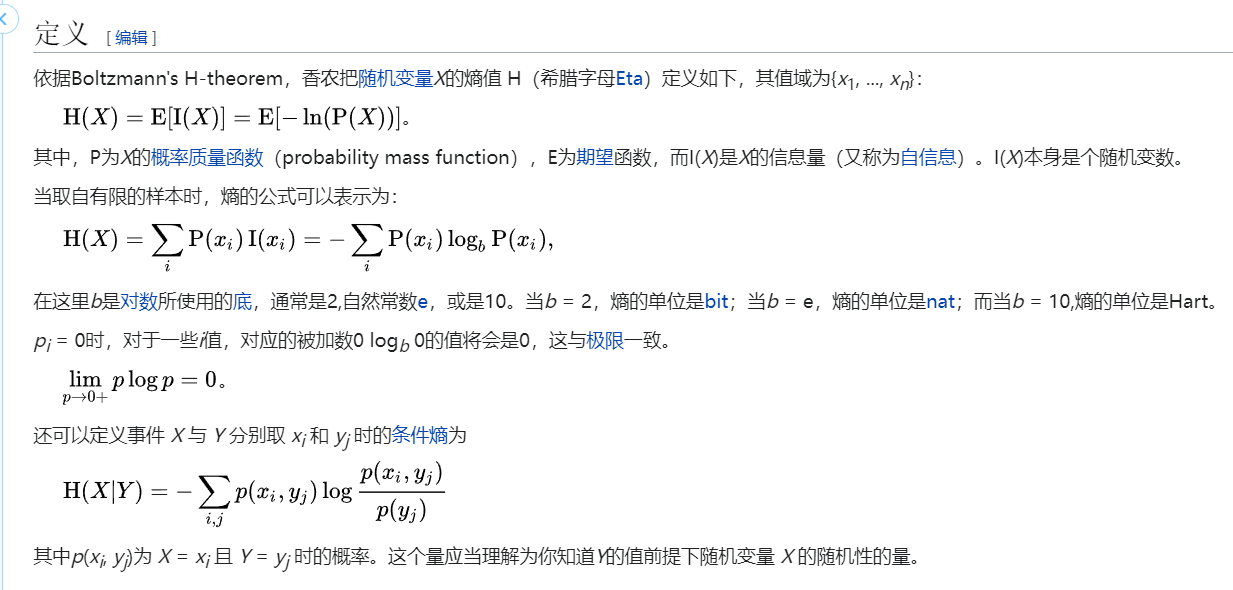
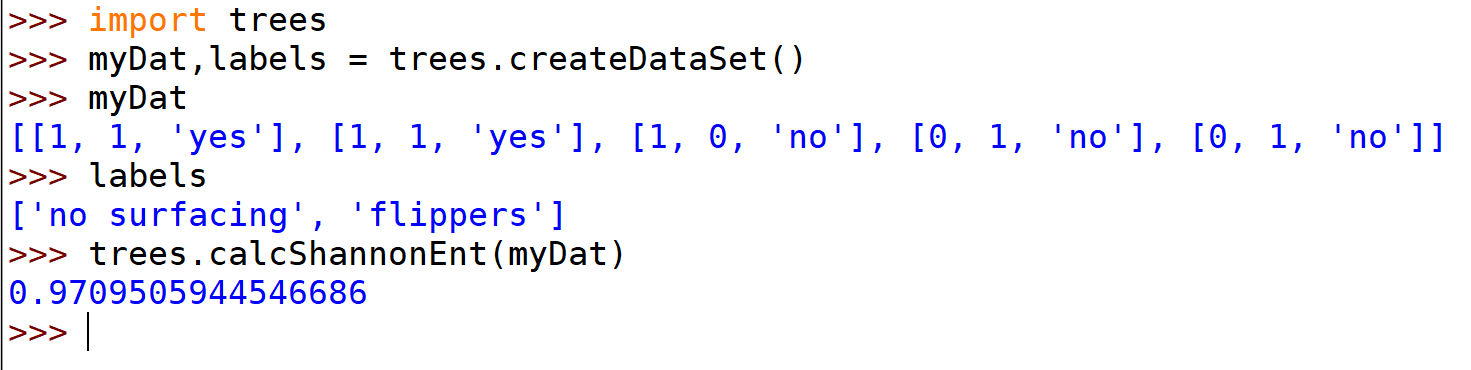
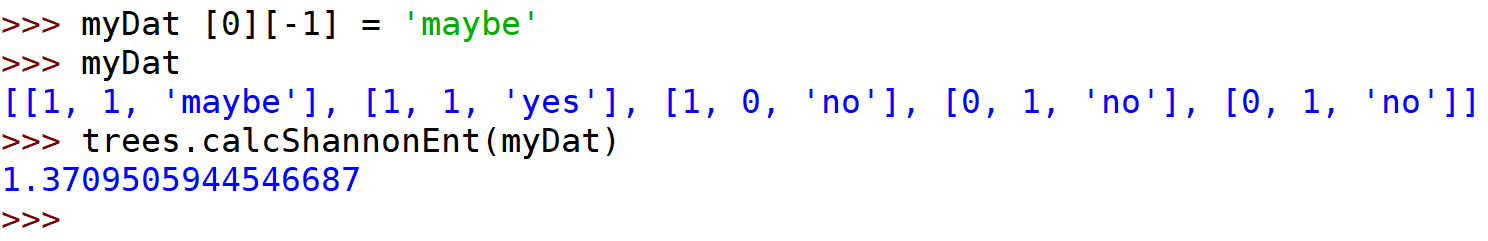
计算给定数据集的香农熵:
from math import logdef calcShannonEnt(dataSet):numEntries = len(dataSet)labelCounts = {}for featVec in dataSet: #the the number of unique elements and their occurancecurrentLabel = featVec[-1]if currentLabel not in labelCounts.keys(): labelCounts[currentLabel] = 0labelCounts[currentLabel] += 1shannonEnt = 0.0for key in labelCounts:prob = float(labelCounts[key])/numEntriesshannonEnt -= prob * log(prob, 2) #log base 2return shannonEnt
即:输入一个数据集,计算其中每个类别的概率,代入公式求香农熵。
按照给定特征划分数据集:
def splitDataSet(dataSet, axis, value):retDataSet = []for featVec in dataSet:if featVec[axis] == value:reducedFeatVec = featVec[:axis] #chop out axis used for splittingreducedFeatVec.extend(featVec[axis+1:])retDataSet.append(reducedFeatVec)return retDataSet
(dataSet, axis, value) 参数:数据集,划分数据集的特征,需要返回的特征的值
??为什么不直接写reducedFeatVec = featVec[:],有什么区别?
>>>>>因为切片区间是左闭右开!!!!!!
选择最好的数据集划分方式:
def chooseBestFeatureToSplit(dataSet):numFeatures = len(dataSet[0]) - 1 #the last column is used for the labelsbaseEntropy = calcShannonEnt(dataSet)bestInfoGain = 0.0; bestFeature = -1for i in range(numFeatures): #iterate over all the featuresfeatList = [example[i] for example in dataSet]#create a list of all the examples of this featureuniqueVals = set(featList) #get a set of unique valuesnewEntropy = 0.0for value in uniqueVals:subDataSet = splitDataSet(dataSet, i, value)prob = len(subDataSet)/float(len(dataSet))newEntropy += prob * calcShannonEnt(subDataSet)infoGain = baseEntropy - newEntropy #calculate the info gain; ie reduction in entropyif (infoGain > bestInfoGain): #compare this to the best gain so farbestInfoGain = infoGain #if better than current best, set to bestbestFeature = ireturn bestFeature #returns an integer
python中set()函数的用法
上面的代码分别用每一个特征划分数据集,计算与原始的数据集之间的香农熵的差,用来比较信息增益,选取出最大的信息增益的特征。
def majorityCnt(classList):classCount={}for vote in classList:if vote not in classCount.keys(): classCount[vote] = 0classCount[vote] += 1sortedClassCount = sorted(classCount.items(), key=operator.itemgetter(1), reverse=True)return sortedClassCount[0][0]
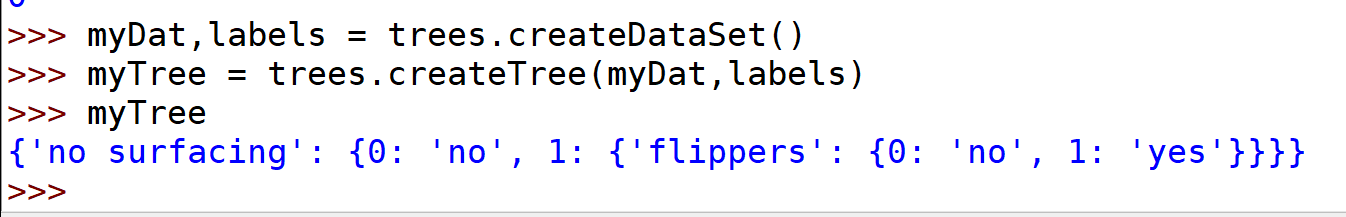
def createTree(dataSet, labels):classList = [example[-1] for example in dataSet]if classList.count(classList[0]) == len(classList):return classList[0]#stop splitting when all of the classes are equalif len(dataSet[0]) == 1: #stop splitting when there are no more features in dataSetreturn majorityCnt(classList)bestFeat = chooseBestFeatureToSplit(dataSet)bestFeatLabel = labels[bestFeat]myTree = {bestFeatLabel:{}}del(labels[bestFeat])featValues = [example[bestFeat] for example in dataSet]uniqueVals = set(featValues)for value in uniqueVals:subLabels = labels[:] #copy all of labels, so trees don't mess up existing labelsmyTree[bestFeatLabel][value] = createTree(splitDataSet(dataSet, bestFeat, value), subLabels)return myTree
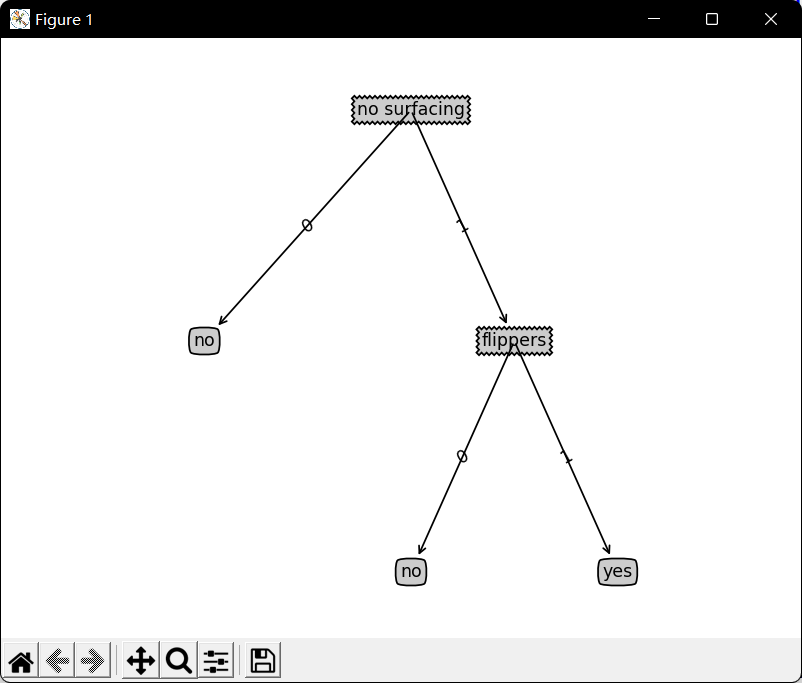
使用matplotlib绘制树:
import matplotlib.pyplot as plt#定义文本框和箭头格式:decisionNode = dict(boxstyle="sawtooth", fc="0.8")leafNode = dict(boxstyle="round4", fc="0.8")arrow_args = dict(arrowstyle="<-")#绘制带箭头的注解:def plotNode(nodeTxt, centerPt, parentPt, nodeType):createPlot.ax1.annotate(nodeTxt, xy=parentPt, xycoords='axes fraction',xytext=centerPt, textcoords='axes fraction',va="center", ha="center", bbox=nodeType, arrowprops=arrow_args)def createPlot(inTree):fig = plt.figure(1, facecolor='white')fig.clf()axprops = dict(xticks=[], yticks=[])createPlot.ax1 = plt.subplot(111, frameon=False, **axprops) #no ticks#createPlot.ax1 = plt.subplot(111, frameon=False) #ticks for demo puropsesplotTree.totalW = float(getNumLeafs(inTree))plotTree.totalD = float(getTreeDepth(inTree))plotTree.xOff = -0.5/plotTree.totalW; plotTree.yOff = 1.0plotTree(inTree, (0.5, 1.0), '')plt.show()
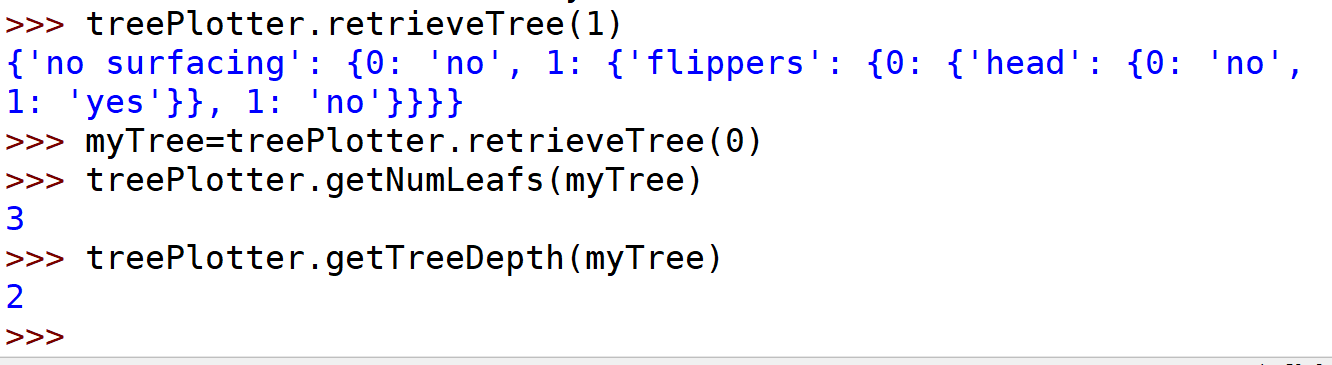
def getNumLeafs(myTree):numLeafs = 0firstStr = list(myTree)[0]secondDict = myTree[firstStr]for key in secondDict.keys():if type(secondDict[key]).__name__ == 'dict':#test to see if the nodes are dictonaires, if not they are leaf nodesnumLeafs += getNumLeafs(secondDict[key])else: numLeafs += 1return numLeafsdef getTreeDepth(myTree):maxDepth = 0firstStr = list(myTree)[0]secondDict = myTree[firstStr]for key in secondDict.keys():if type(secondDict[key]).__name__ == 'dict':#test to see if the nodes are dictonaires, if not they are leaf nodesthisDepth = 1 + getTreeDepth(secondDict[key])else: thisDepth = 1if thisDepth > maxDepth: maxDepth = thisDepthreturn maxDepth
测试算法:使用决策树执行分类
def classify(inputTree, featLabels, testVec):firstStr = list(inputTree)[0]secondDict = inputTree[firstStr]featIndex = featLabels.index(firstStr)key = testVec[featIndex]valueOfFeat = secondDict[key]if isinstance(valueOfFeat, dict):classLabel = classify(valueOfFeat, featLabels, testVec)else: classLabel = valueOfFeatreturn classLabel
使用算法:决策树的构建
def storeTree(inputTree, filename):import picklefw = open(filename, 'wb')pickle.dump(inputTree, fw)fw.close()def grabTree(filename):import picklefr = open(filename, 'rb')return pickle.load(fr)

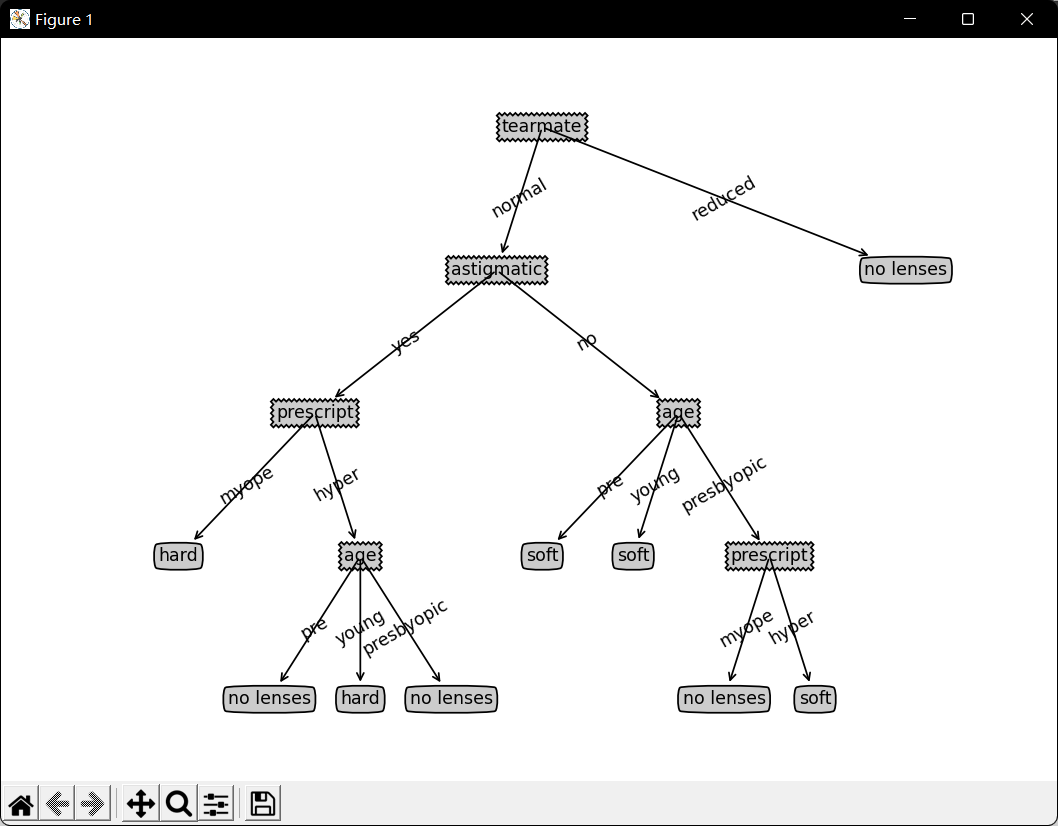
测试隐形眼镜数据: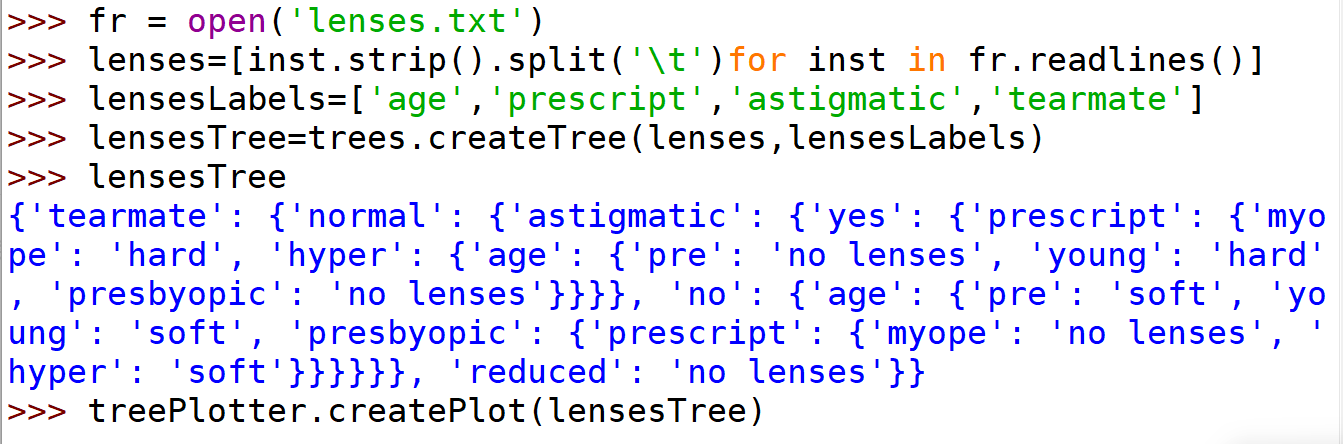

若有收获,就点个赞吧
0 人点赞
