面向移动端的图表追求生动性,因此 F2 提供了一套动画机制。但同时移动端对大小有一定的要求,因此针对不同的场景,F2 提供了两种动画版本:
群组入场动画
精细动画,以 shape 为对象单位的动画,包含
appear、enter两种入场动画、update更新动画以及leave销毁动画
当图表仅用于展示时,为了缩减代码体量,用户可以选择第一种动画策略,即仅包含入场动画。如果需要更丰富的动画,可以选择第二种动画策略。
另外 F2 还提供了自定义动画机制,帮助用户定制更加生动、更具场景的动画。
完整版的 F2 我们默认提供的是精细动画,当然用户也可以使用按需引用策略,选择适合自己场景的动画:
如何按需引用
- 群组入场动画
const F2 = require('@antv/f2/lib/core');const GroupAnimation = require('@antv/f2/lib/animation/group');F2.Chart.plugins.register(GroupAnimation); // 这里进行全局注册,也可以给 chart 的实例注册
- 精细动画版本
const F2 = require('@antv/f2/lib/core');const Animation = require('@antv/f2/lib/animation/detail');F2.Chart.plugins.register(Animation); // 这里进行全局注册,也可以给 chart 的实例注册
注意:
两个版本的动画择其一即可。
当你引用
require('@antv/f2')版本时,提供的是精细动画。
动画配置详解
动画分类
在 F2 的动画中,围绕图表数据的变化,我们将图形元素的动画划分为以下四种类型:
| 动画类型 | 解释 | 触发时机 |
|---|---|---|
| appear | 图表第一次加载时的入场动画 | 第一次 chart.render() |
| enter | 图表绘制完成,数据发生变更后,产生的新图形的进场动画 | chart.changeData(data) |
| update | 图表绘制完成,数据发生变更后,有状态变更的图形的更新动画 | chart.changeData(data) |
| leave | 图表绘制完成,数据发生变更后,被销毁图形的销毁动画 | chart.changeData(data) |
第一次 chart.render() 时会触发 appear 类型的动画,而 chart.changeData(data) 即数据发生变更时,会触发 update、leave、enter 类型的动画。
如果用户使用的是仅包含群组入场动画版本,那么仅提供了 appear 类型的动画。在精细动画版本中,完整提供了以上四种动画类型机制。具体的配置方法在下文进行说明。
chart.animate()
图表动画的整体配置。
chart.animate(false)
关闭图表动画。
chart.animate(cfg)
对 chart 上的图形元素进行具体的动画配置。
参数:
cfg类型: Object
返回: 当前 chart 实例
具体配置参考如下:
chart.animate({'axis-label': {appear: {animation: {String} || {Function}, // 定义动画执行函数easing: {String} || {Function}, // 动画缓动函数delay: {Number} || {Function}, // 动画延迟执行时间,单位 msduration: {Number} // 动画执行时间,单位 ms}, // 初始化入场动画配置update: {}, // 更新动画配置,配置属性同 appearenter: {}, // 数据变更后,新产生的图形的入场动画配置,配置属性同 appearleave: {} // 销毁动画配置,配置属性同 appear}, // 对坐标轴文本进行动画配置'axis-tick': {} // 对坐标轴刻度线进行动画配置,配置属性同 axis-label'axis-grid': {} // 对坐标轴网格线进行动画配置,配置属性同 axis-label'axis-line': {} // 对坐标轴线进行动画配置,配置属性同 axis-labelline: {} // 对折线图进行动画配置,配置属性同 axis-labelarea: {} // 对面积图进行动画配置,配置属性同 axis-labelinterval: {} // 对柱状图进行动画配置,配置属性同 axis-labelpath: {} // 对路径图进行动画配置,配置属性同 axis-labelpoint: {} // 对点图进行动画配置,配置属性同 axis-labelpolygon: {} // 对多边形进行动画配置,配置属性同 axis-labelschema: {} // 对自定义图形进行动画配置,配置属性同 axis-label});
关闭动画的方式如下:
// 关闭图表所有动画chart.animate(false);// 关闭某种图形元素的动画,如线图 linechart.animate({line: false // 关闭线图动画});// 关闭某种图形元素下某一类动画,如线图的出场动画chart.animate({line: {appear: false}});
目前对动画开放的图形元素包括:
| 图形元素名 | 解释 |
|---|---|
axis-label |
坐标轴文本 |
axis-grid |
坐标轴网格线 |
axis-tick |
坐标轴刻度线 |
axis-line |
坐标轴线 |
line |
折线图 |
area |
面积图 |
interval |
柱状图 |
path |
路径图 |
point |
点图 |
polygon |
多边形 |
schema |
自定义图形 |
每一种图形元素均包含以上四种动画类型(appear、enter、update、leave),而每一种动画类型,可进行如下属性的配置:
// 对首次出场动画的配置appear: {animation: 'fadeIn', // 执行的具体动画easing: 'elasticIn', // 动画缓动函数delay: 1000, // 动画延迟执行时间,单位 msduration: 600 // 动画执行时间,单位 ms}// 或者直接关闭 appear 类型动画appear: false
animation,类型:String/Function,定义动画的具体执行动作
该属性用于定义动画执行函数,可以指定动画名称,该动画名称可以是 F2 默认提供的动画(见以下列表),也可以是用户通过动画注册机制进行注册之后的动画名称。
// 指定动画名称animation: 'groupWaveIn'
也可以直接定义回调函数,使用如下:
/*** 定义动画执行函数* @param {Shape} shape 指定动画的 shape* @param {Object} animateCfg 动画的配置,包含 easing、duration 等* @param {Coord} coord 当前的坐标系对象* @return {null} 不需要返回*/animation: (shape, animateCfg, coord) {}
默认我们提供了如下几种动画:
| 动画名称 | 描述 | 效果 |
|---|---|---|
groupWaveIn |
整体动画,不同坐标系下效果不同 | 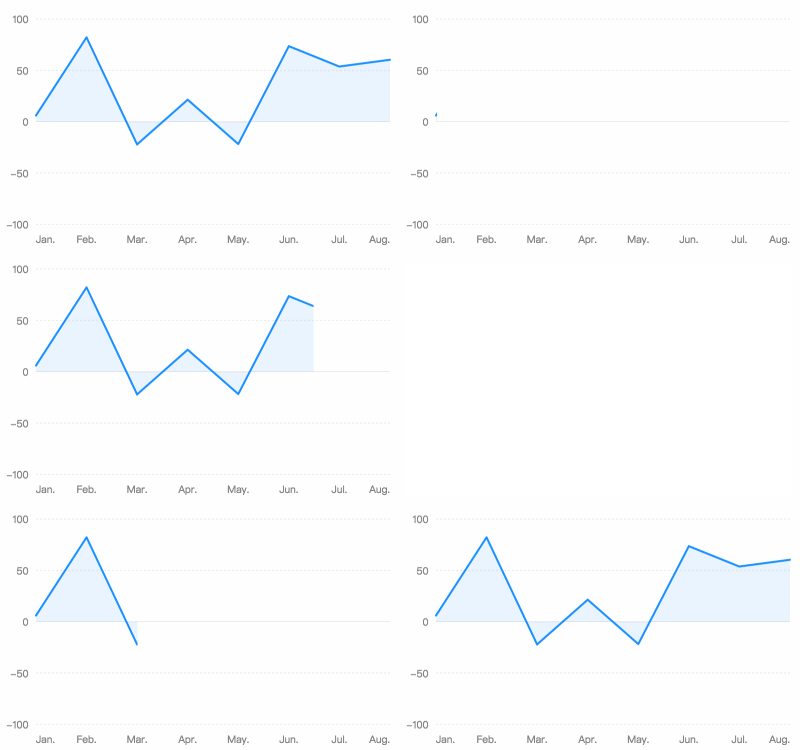 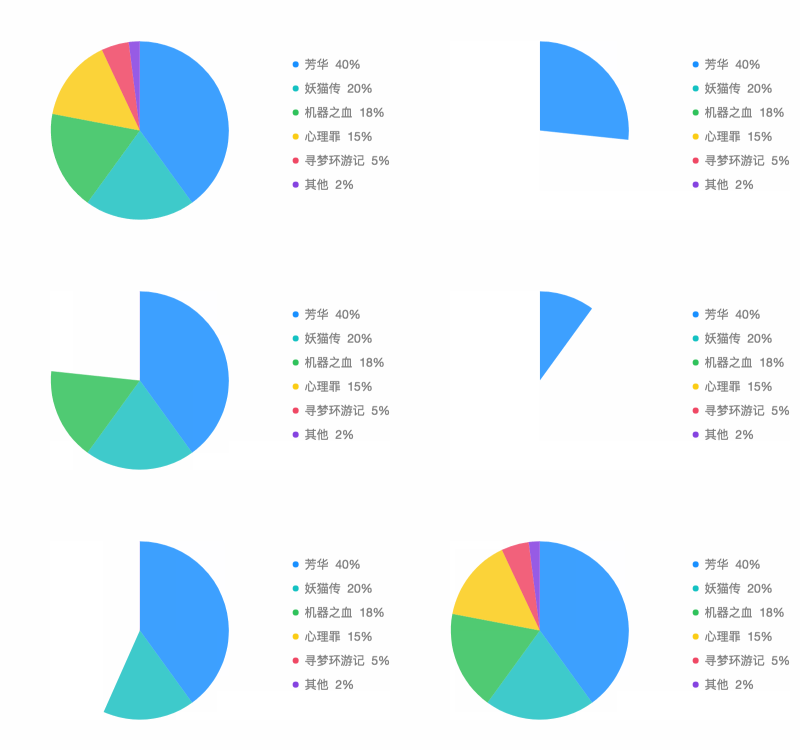 |
groupScaleInX |
整体动画 | 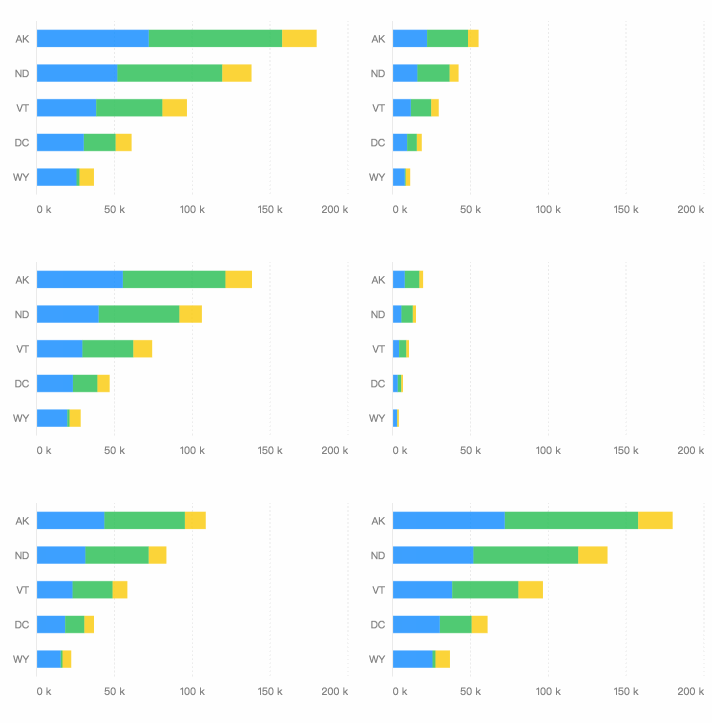 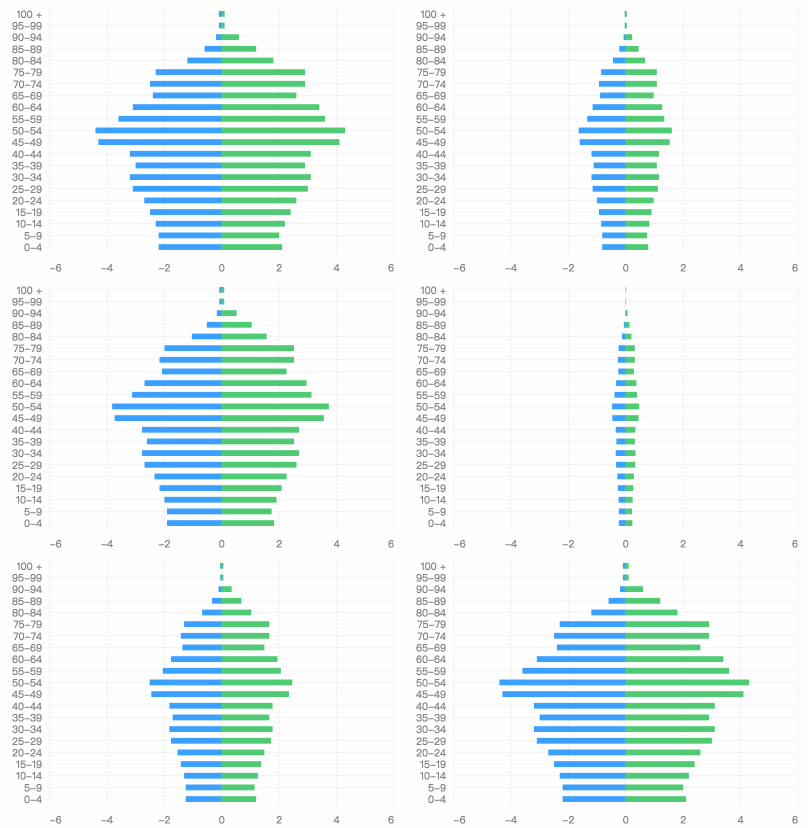 |
groupScaleInY |
整体动画 | 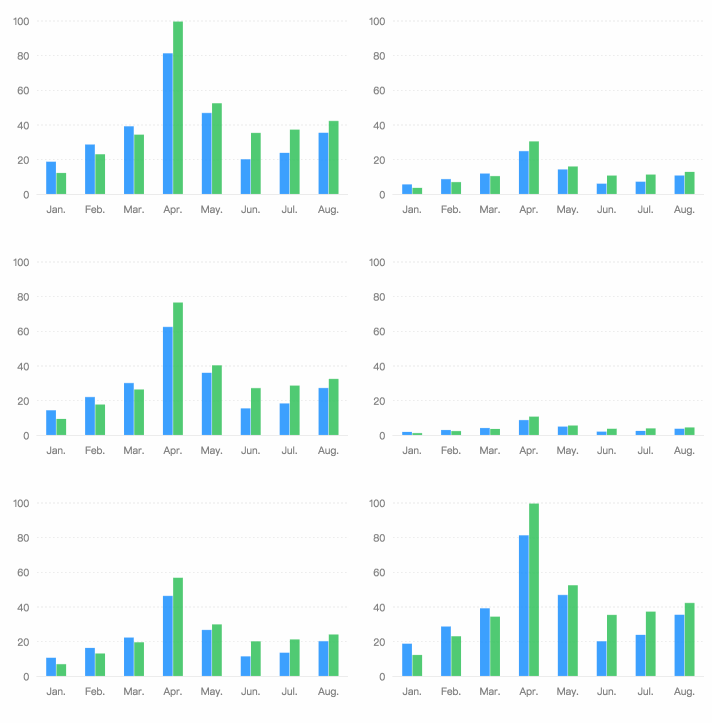 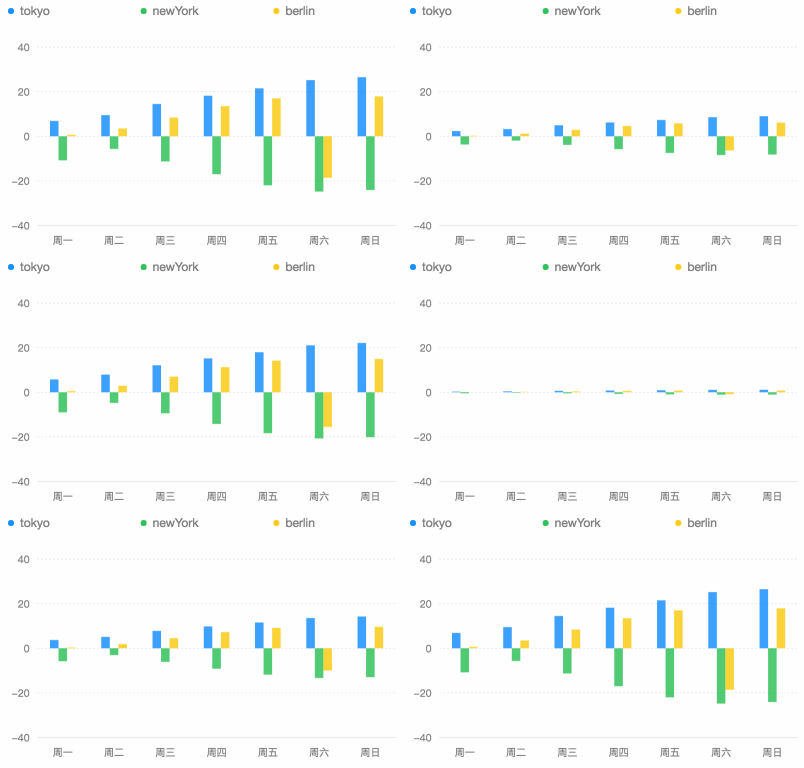 |
groupScaleInXY |
整体动画 | 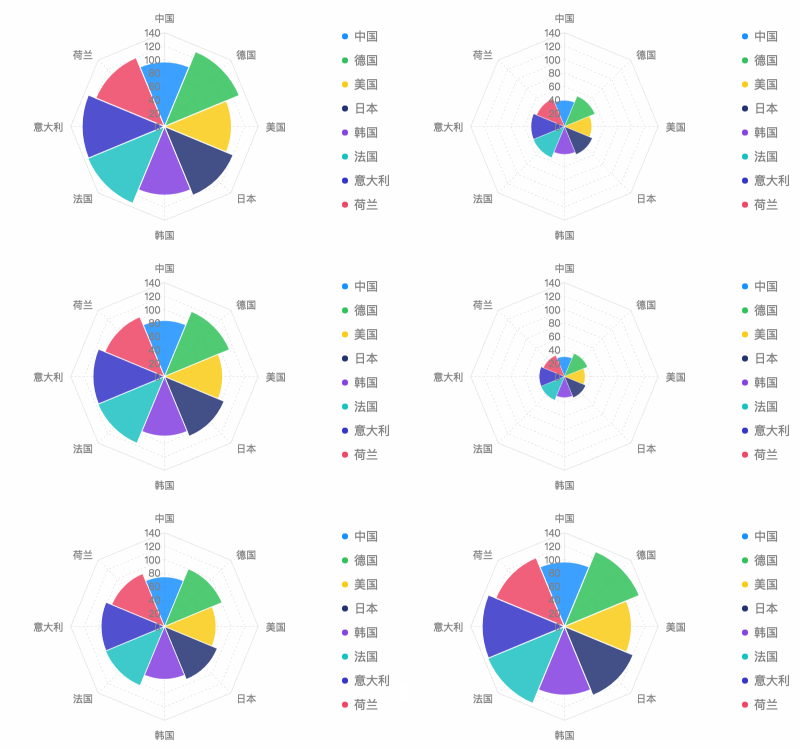 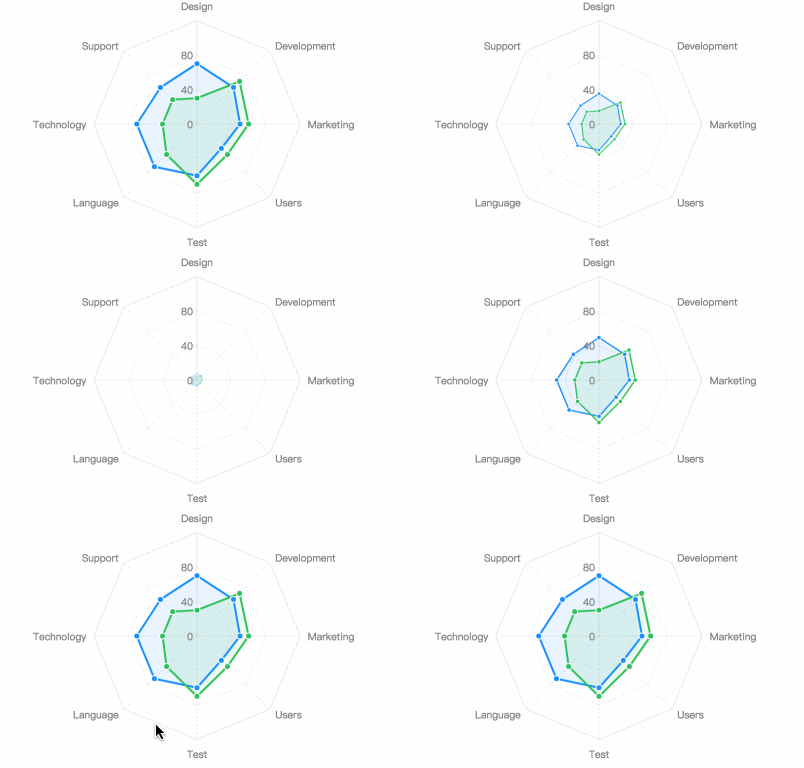 |
shapesScaleInX |
整体动画,不同于 groupScale,每个 shape 都会参与 | 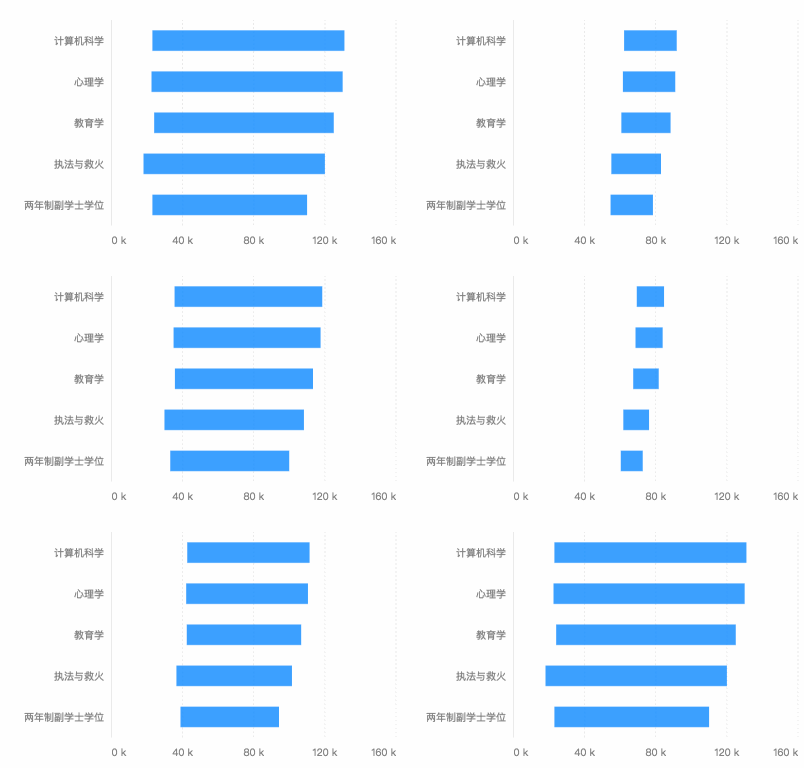 |
shapesScaleInY |
整体动画,不同于 groupScale,每个 shape 都会参与 | 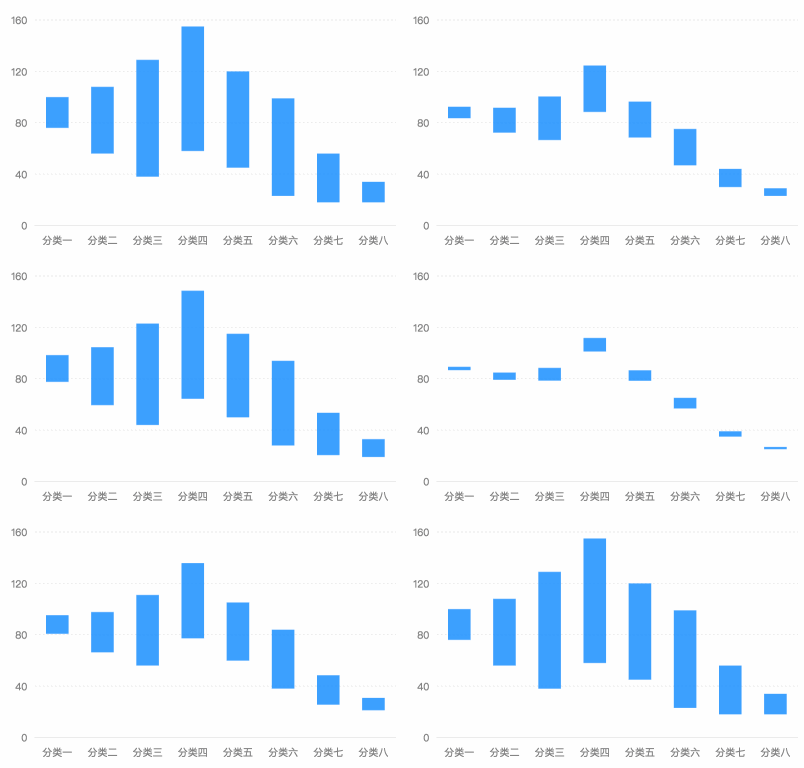 |
shapesScaleInXY |
整体动画,不同于 groupScale,每个 shape 都会参与 | 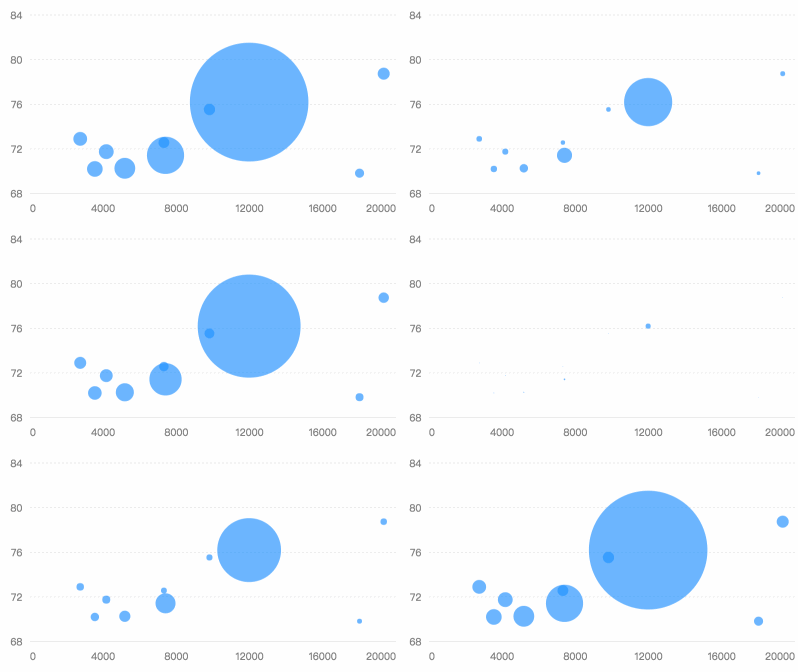 |
fadeIn |
单个 shape 的动画 | 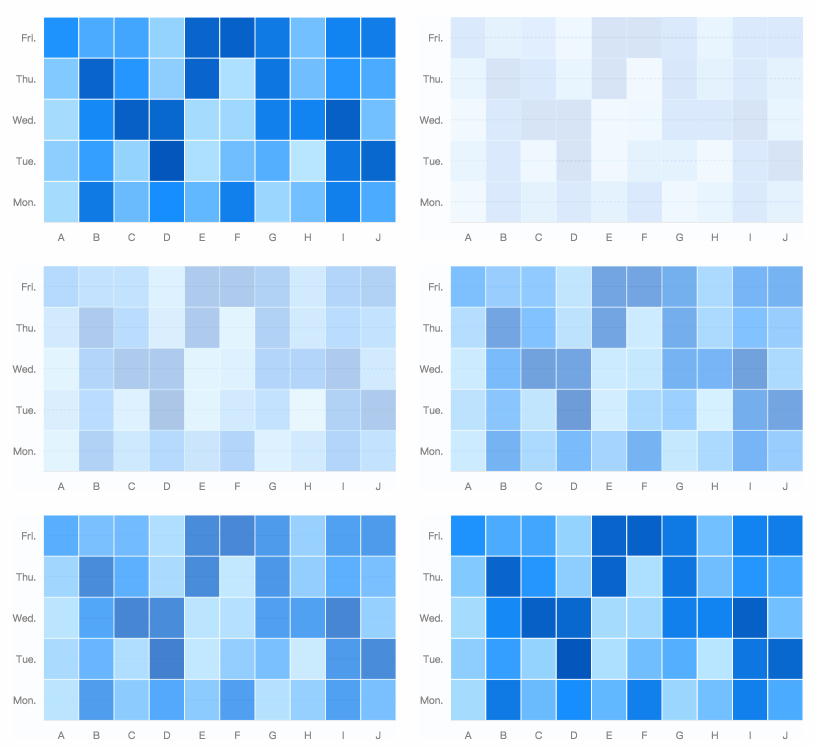 |
easing,类型:String/Function,定义动画的缓动函数
使用 F2 默认提供的缓动函数名,或者直接传入缓动函数:
// 方式一:指定缓动函数名称easing: 'quadraticOut',// 方式二:直接传入缓动函数easing: (t) => {return Math.sqrt(1 - --t * t);}
默认提供的缓动函数名为:linear quadraticIn quadraticOut quadraticInOut cubicIn cubicOut cubicInOut elasticIn elasticOut elasticInOut backIn backOut backInOut bounceIn bounceOut bounceInOut
各个函数的缓动效果可参考:http://sole.github.io/tween.js/examples/03_graphs.html
delay,类型:Number/Function,指定动画的延迟执行时间
该属性支持回调函数,回调函数的使用如下:
// 方式一,直接指定延迟时间,单位为 msdelay: 1000,// 方式二,使用回调函数/*** 返回动画延迟执行时间* @param {Number} index 当前 shape 的索引值(相对于数据集中的顺序)* @param {String} id 当前 shape 的 id* @return {Number} 返回延迟执行时间,单位为 ms*/delay: (index, id) {}
duration,类型:Number,动画的执行时间,单位为 ms
geom.animate()
为 geometry 图形元素进行具体的动画配置,默认 F2 已针对各个 geometry 设定了动画类型以及配置,用户可以通过该接口进行动画的个性化配置。
注意:
当用户调用
chart.animate(false)关闭了图表动画之后,geom.animate()方法上的配置不生效。当用户在
chart.animate()和geom.animate()两个接口上均对该 geometry 进行了动画配置时,以geom.animate()的配置为准。
具体可配置的属性为 animation easing delay duration,具体的使用见上文:
geom.animate({appear: {animation: {String} || {Function}, // 定义动画执行函数easing: {String} || {Function}, // 动画缓动函数delay: {Number} || {Function}, // 动画延迟执行时间,单位 msduration: {Number} // 动画执行时间,单位 ms},enter: {animation: {String} || {Function}, // 定义动画执行函数easing: {String} || {Function}, // 动画缓动函数delay: {Number} || {Function}, // 动画延迟执行时间,单位 msduration: {Number} // 动画执行时间,单位 ms},update: {animation: {String} || {Function}, // 定义动画执行函数easing: {String} || {Function}, // 动画缓动函数delay: {Number} || {Function}, // 动画延迟执行时间,单位 msduration: {Number} // 动画执行时间,单位 ms},leave: {animation: {String} || {Function}, // 定义动画执行函数easing: {String} || {Function}, // 动画缓动函数delay: {Number} || {Function}, // 动画延迟执行时间,单位 msduration: {Number} // 动画执行时间,单位 ms},});
shape.animate()
我们为每个 shape 实例提供了 animate 接口,用于执行具体的动画行为,具体使用如下:
shape.animate().to({attrs: {Object}, // shape 最终的图形属性easing: {String} || {Function}, // 缓动函数duration: {Number}, // 动画持续时间,单位为 msdelay: {Number} // 动画延迟时间,单位为 ms}) // 定义动画行为.onStart(function() {// 动画开始的回调函数}).onUpdate(function() {// 动画进行时的回调函数}).onEnd(function() {// 动画结束时的回调函数}).onFrame(t => {// t 为 0 - 1 范围的数字,表示当前执行的进度// 用户自定义每一帧的动画操作});

