- SS02 Quantitative Methods (1)
- R06 The Time Value of Money
- a interpret interest rates as required rates of return, discount rates, or opportunity costs;
- b explain an interest rate as the sum of a real risk-free rate and premiums that compensate investors for bearing distinct types of risk;
- c calculate and interpret the effective annual rate, given the stated annual interest rate and the frequency of compounding;
- d solve time value of money problems for different frequencies of compounding;
- e calculate and interpret the future value (FV) and present value (PV) of a single sum of money, an ordinary annuity, an annuity due, a perpetuity (PV only), and a series of unequal cash flows;
- f demonstrate the use of a time line in modeling and solving time value of money problems.
- R07 Statistical Concepts and Market Returns
- a distinguish between descriptive statistics and inferential statistics, between a population and a sample, and among the types of measurement scales;
- b define a parameter, a sample statistic, and a frequency distribution;
- c calculate and interpret relative frequencies and cumulative relative frequencies, given a frequency distribution;
- d describe the properties of a data set presented as a histogram or a frequency polygon;
- e calculate and interpret measures of central tendency, including the population mean, sample mean, arithmetic mean, weighted average or mean, geometric mean, harmonic mean, median, and mode;
- f calculate and interpret quartiles, quintiles, deciles, and percentiles;
- g calculate and interpret 1) a range and a mean absolute deviation and 2) the variance and standard deviation of a population and of a sample;
- h calculate and interpret the proportion of observations falling within a specified number of standard deviations of the mean using Chebyshev’s inequality;
- i calculate and interpret the coefficient of variation;
- j explain skewness and the meaning of a positively or negatively skewed return distribution;
- k describe the relative locations of the mean, median, and mode for a unimodal, nonsymmetrical distribution;
- l explain measures of sample skewness and kurtosis;
- m compare the use of arithmetic and geometric means when analyzing investment returns.
- R08 Probability Concepts
- a define a random variable, an outcome, an event, mutually exclusive events, and exhaustive events;
- b state the two defining properties of probability and distinguish among empirical, subjective, and a priori probabilities;
- c state the probability of an event in terms of odds for and against the event;
- d distinguish between unconditional and conditional probabilities;
- e explain the multiplication, addition, and total probability rules;
- f calculate and interpret 1) the joint probability of two events, 2) the probability that at least one of two events will occur, given the probability of each and the joint probability of the two events, and 3) a joint probability of any number of independent events;
- g distinguish between dependent and independent events;
- h calculate and interpret an unconditional probability using the total probability rule;
- i explain the use of conditional expectation in investment applications;
- j explain the use of a tree diagram to represent an investment problem;
- k calculate and interpret covariance and correlation and interpret a scatterplot;
- l calculate and interpret the expected value, variance, and standard deviation of a random variable and of returns on a portfolio;
- m calculate and interpret covariance given a joint probability function;
- n calculate and interpret an updated probability using Bayes’ formula;
- o identify the most appropriate method to solve a particular counting problem and solve counting problems using factorial, combination, and permutation concepts.
- R06 The Time Value of Money
- Quantitative Methods (2)
- R09 Common Probability Distributions
- a define a probability distribution and distinguish between discrete and continuous random variables and their probability functions;
- b describe the set of possible outcomes of a specified discrete random variable;
- c interpret a cumulative distribution function;
- d calculate and interpret probabilities for a random variable, given its cumulative distribution function;
- e define a discrete uniform random variable, a Bernoulli random variable, and a binomial random variable;
- f calculate and interpret probabilities given the discrete uniform and the binomial distribution functions;
- g construct a binomial tree to describe stock price movement;
- h define the continuous uniform distribution and calculate and interpret probabilities, given a continuous uniform distribution;
- i explain the key properties of the normal distribution;
- j distinguish between a univariate and a multivariate distribution and explain the role of correlation in the multivariate normal distribution;
- k determine the probability that a normally distributed random variable lies inside a given interval;
- l define the standard normal distribution, explain how to standardize a random variable, and calculate and interpret probabilities using the standard normal distribution;
- m define shortfall risk, calculate the safety-first ratio, and select an optimal portfolio using Roy’s safety-first criterion;
- n explain the relationship between normal and lognormal distributions and why the lognormal distribution is used to model asset prices;
- o distinguish between discretely and continuously compounded rates of return and calculate and interpret a continuously compounded rate of return, given a specific holding period return;
- p explain Monte Carlo simulation and describe its applications and limitations;
- q compare Monte Carlo simulation and historical simulation
- R10 Sampling and Estimation
- a define simple random sampling and a sampling distribution;
- b explain sampling error;
- c distinguish between simple random(LOS10.a) and stratified random sampling;
- d distinguish between time-series and cross-sectional data;
- e explain the central limit theorem and its importance;
- f calculate and interpret the standard error of the sample mean;
- g identify and describe desirable properties of an estimator;
- h distinguish between a point estimate and a confidence interval estimate of a population parameter;
- i describe properties of Student’s t-distribution and calculate and interpret its degrees of freedom;
- j calculate and interpret a confidence interval for a population mean, given a normal distribution with 1) a known population variance, 2) an unknown population variance, or 3) an unknown population variance and a large sample size;
- k describe the issues regarding selection of the appropriate sample size, datamining bias, sample selection bias, survivorship bias, look-ahead bias, and timeperiod bias.
- R11 Hypothesis Testing
- a define a hypothesis, describe the steps of hypothesis testing, and describe and interpret the choice of the null and alternative hypotheses;
- b distinguish between one-tailed and two-tailed tests of hypotheses;
- c explain a test statistic, Type I and Type II errors, a significance level, and how significance levels are used in hypothesis testing;
- d explain a decision rule, the power of a test, and the relation between confidence intervals and hypothesis tests;
- e distinguish between a statistical result and an economically meaningful result;
- f explain and interpret the p-value as it relates to hypothesis testing;
- g identify the appropriate test statistic and interpret the results for a hypothesis test concerning the population mean of both large and small _samples when the population is _normally or approximately normally distributed and the variance is 1) known or 2) unknown;
- h identify the appropriate test statistic and interpret the results for a hypothesis test concerning the equality of the population means of two at least approximately normally distributed populations, based on independent random samples with 1) equal or 2) unequal assumed variances;
- i identify the appropriate test statistic and interpret the results for a hypothesis test concerning the mean difference of two normally distributed populations;
- j identify the appropriate test statistic and interpret the results for a hypothesis test concerning 1) the variance of a normally distributed population, and 2) the equality of the variances of two normally distributed populations based on two independent random samples;
- k formulate a test of the hypothesis that the population correlation coefficient equals zero and determine whether the hypothesis is rejected at a given level of significance;
- l distinguish between parametric and nonparametric tests and describe situations in which the use of nonparametric tests may be appropriate.
- R09 Common Probability Distributions
SS02 Quantitative Methods (1)
R06 The Time Value of Money
a interpret interest rates as required rates of return, discount rates, or opportunity costs;
- Equilibrium interest rates are the required rate of return for a particular investment, in the sense that the market rate of return is the return that investors and savers require to get them to willingly lend their funds.
投资者出借资本的租金
- Interest rates are also referred to as discount rates and, in fact, the terms are often used interchangeably. If an individual can borrow funds at an interest rate of 10%, then that individual should discount payments to be made in the future at that rate in order to get their equivalent value in current dollars or other currency.
使未来现金流入(还款),与当期现金流入(借款)相等的利率
- we can also view interest rates as the opportunity cost of current consumption. If the market rate of interest on 1-year securities is 5%, earning an additional 5% is the opportunity forgone when current consumption is chosen rather than saving (postponing consumption).
b explain an interest rate as the sum of a real risk-free rate and premiums that compensate investors for bearing distinct types of risk;
The real risk-free rate of interest is a theoretical rate on a single-period loan that has no expectation of inflation in it.
- nominal **risk-free rate** = real risk-free rate + expected inflation rate __(an approximate relation!)
- Default risk. The risk that a borrower will not make the promised payments in a timely manner.
- Liquidity risk. The risk of receiving less than fair value for an investment if it must be sold for cash quickly.
- Maturity risk. The prices of longer-term bonds are more volatile than those of shorter-term bonds. Longer maturity bonds have more maturity risk than shorter-term bonds and require a maturity risk premium.
required interest rate on a security = nominal **risk-free rate
+ default risk premium
+ liquidity premium
+ maturity risk premium **
c calculate and interpret the effective annual rate, given the stated annual interest rate and the frequency of compounding;
Financial institutions usually quote rates as __stated annual interest rates, along with a __compounding frequency, as opposed to quoting rates as periodic rate(the rate of interest earned over a single compounding period)__.
- Effective Annual Rate (**EAR**) or Effective Annual Yield (**EAY**) : The rate of interest that investors actually realize as a result of compounding:
perodic rate=stated annual rate/m
m=the number of compounding periods per year
d solve time value of money problems for different frequencies of compounding;
For non-annual time value of money problems, divide the stated annual interest rate by the number of compounding periods per year, m, and multiply the number of years by the number of compounding periods per year.
例:零息债券的相关计算
e calculate and interpret the future value (FV) and present value (PV) of a single sum of money, an ordinary annuity, an annuity due, a perpetuity (PV only), and a series of unequal cash flows;
- FV, future value of a single sum of money
PV = amount of money invested today (the present value)
I/Y = rate of return per compounding period
N = total number of compounding periods
future value factor/future value interest factor:
- PV present value of a single sum of money
discount rate/opportunity cost/required rate of return/and the cost of capital
present value factor, present value interest factor, or discount factor
- Annuity
annuity: a stream of equal cash flows that occurs at equal intervals over a given period.
ordinary annuities: cash flows that occur at the end of each compounding period.
annuities due: payments or receipts occur at the beginning of each period
两种年金之间的转换:
因为相同的数额due总比ordinary要提前收到,所以D的PV和FV都要比O的要高
- perpetuity 永续年金
perpetuity: pays a fixed amount of money at set intervals over an infinite period of time
- uneven cash flows
以计算零息债券的方式计算单个现金流的PV or FV,然后进行加和
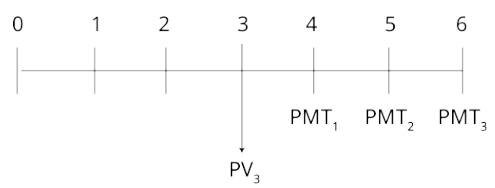
f demonstrate the use of a time line in modeling and solving time value of money problems.
Constructing a time line showing future cash flows will help in solving many types of TVM problems.
- Cash flows occur at the end of the period depicted on the time line.
- The end of one period is the same as the beginning of the next period.
R07 Statistical Concepts and Market Returns
a distinguish between descriptive statistics and inferential statistics, between a population and a sample, and among the types of measurement scales;
- descriptive statistics&inferential statistics
- Descriptive statistics are used to summarize the important characteristics of large data sets
描述统计:总结数据集的特性
- Inferential statistics pertain to the procedures used to make forecasts, estimates, or judgments about a large set of data on the basis of the statistical characteristics of a smaller set (a sample).
统计推断:根据子集(即样本)的统计特性对整个几何数据进行预测、估计与判断
- population and sample
- population: the set of ALL possible members of a stated group
- sample: subset of the population of interest
- types of measurement scales
Different statistical methods use different levels of measurement, or measurement scales.
- Nominal scales. Nominal scales are the level of measurement that contains the least information. Observations are classified or counted with no particular order. 无序分类
- Ordinal scales. every observation is assigned to one of several categories. Then these categories are ordered with respect to a specified characteristic. 有序分类
- Interval scale measurements provide relative ranking, like ordinal scales, plus the assurance that differences between scale values are equal. 有序、有尺度,但零无意义
- Ratio scales. Ratio scales provide ranking and equal differences between scale values, have a true zero point as the origin. Order, intervals, and ratios all make sense with a ratio scale. 有序、有尺度,零有意义
b define a parameter, a sample statistic, and a frequency distribution;
- parameter: A measure used to describe a characteristic of a population
- sample stastic: is used to measure a characteristic of a sample.
frequency distribution a tabular presentation of statistical data that aids the analysis of large data sets. Frequency distributions summarize statistical data by assigning it to specified groups, or intervals.
c calculate and interpret relative frequencies and cumulative relative frequencies, given a frequency distribution;
relative frequency
The relative frequency is calculated by
也就是: the percentage of total observations falling within each interval
- cumulative relative frequencies
The cumulative absolute frequency or cumulative relative frequency for any given interval is the sum of the absolute or relative frequencies up to and including the given interval.
d describe the properties of a data set presented as a histogram or a frequency polygon;
- histogram 直方图
A histogram is the graphical presentation of the absolute frequency distribution.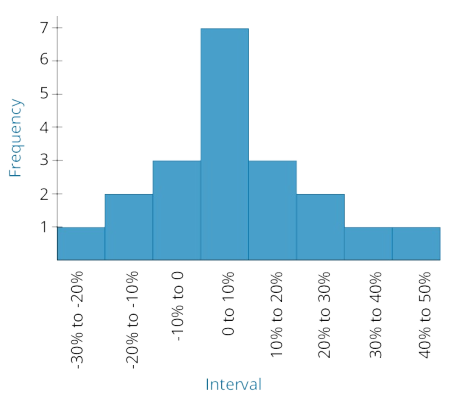
- frequency polygon
To construct a frequency polygon, the midpoint of each interval is plotted on the horizontal axis, and the absolute frequency for that interval is plotted on the vertical axis. Each point is then connected with a straight line. 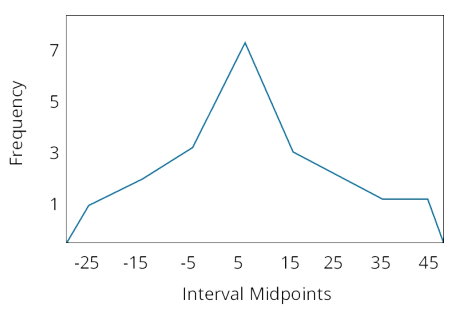
e calculate and interpret measures of central tendency, including the population mean, sample mean, arithmetic mean, weighted average or mean, geometric mean, harmonic mean, median, and mode;
arithmetic mean
population mean
 <br /> b. sample mean<br /> 
weighted average
geometric mean
often used when calculating investment returns over multiple periods or when measuring compound growth rates.
🎯计算收益率的几何平均值:
harmonic mean
<br />For values that are not all equal:** ****harmonic mean ****<**** geometric mean ****< ****arithmetic mean**** **median
median: the midpoint of a data set when the data is arranged in ascending or descending order
- mode
mode: the value that occurs most frequently in a data set.
A data set may have more than one mode or even no mode. unimodal. bimodal. trimodal.
f calculate and interpret quartiles, quintiles, deciles, and percentiles;
Quantile is the general term for a value at or below which a stated proportion of the data in a distribution lies.
- Quartiles—the distribution is divided into quarters. 四分位数
- Quintile—the distribution is divided into fifths. 五分位数
- Decile—the distribution is divided into tenths. 十分位数
- Percentile—the distribution is divided into hundredths (percents). 百分位数
The position of the observation at a given percentile, y, with n data points sorted in ascending order is:
Quantiles and measures of central tendency are known collectively as measures of location_.
g calculate and interpret 1) a range and a mean absolute deviation and 2) the variance and standard deviation of a population and of a sample;
- range and MAD
- range: is the distance between the largest and the smallest value in the data set
- mean absolute deviation (MAD): the average of the absolute values of the deviations of individual observations from the arithmetic mean
- variance and standard deviation
- population variance,σ: the average of the squared deviations from the mean.
- population standard deviation,σ: the square root of the population variance
- sample variance,s2: the measure of dispersion when evaluating a sample of n observations from a population
- The sample standard deviation
h calculate and interpret the proportion of observations falling within a specified number of standard deviations of the mean using Chebyshev’s inequality;
- Chebyshev’s inequality states that for any set of observations, whether sample or population data and regardless of the shape of the distribution, the percentage of the observations that lie within k standard deviations of the mean is at least :
- 36% of observations lie within ±1.25 standard deviations of the mean.
- 56% of observations lie within ±1.50 standard deviations of the mean.
- 75% of observations lie within ±2.00 standard deviations of the mean.
- 89% of observations lie within ±3.00 standard deviations of the mean.
- 94% of observations lie within ±4.00 standard deviations of the mean.
i calculate and interpret the coefficient of variation;
- Relative dispersion is the amount of variability in a distribution relative to a reference point or benchmark. Relative dispersion is commonly measured with the coefficient of variation (CV)
- Used to measure the risk (variability) per unit of expected return (mean)
j explain skewness and the meaning of a positively or negatively skewed return distribution;
- definition
- Symmetrical: distribution is shaped identically on both sides of its mean.
- Skewness, or skew: the extent to which a distribution is not symmetrical. 偏度
- Outliers are observations with extraordinarily large values, either positive or negative. 离群值
- positively/negative skewed return distribution
- positively skewed distribution: many outliers in the upper (right) tail. skewed right (long upper tail).
- negatively skewed distribution: many outliers in the lower (left) tail. skewed left (long lower tail).
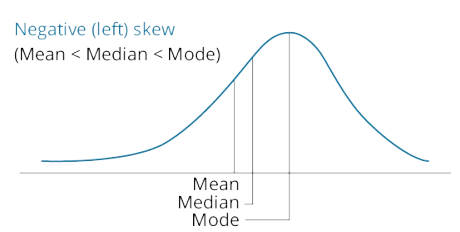
k describe the relative locations of the mean, median, and mode for a unimodal, nonsymmetrical distribution;
结论:受极端数据个数/数值的影响程度:平均值大于中位数大于众数
考虑一个极大/极小的离群值,平均值明显向离群值偏移,中位数挪一个位置,而众数基本不受影响
- symmetrical distribution
Mean=Median=Mode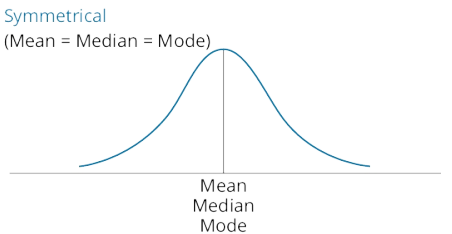
- nosymmetrical: positively skewed
Mean>Median>Mode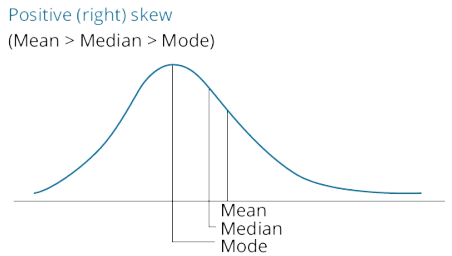
- nosymmetrical: negatively skewed
l explain measures of sample skewness and kurtosis;
- kurtosis的基本定义
- Kurtosis: the degree to which a distribution is more or less ‘peaked’ than a normal distribution. 峰度
- Leptokurtic more peaked than a normal distribution 尖峰态
- Platykurtic less peaked than a normal distribution 低峰态
A distribution is said to exhibit **excess kurtosis if it has either more or less kurtosis than the normal distribution.
The computed kurtosis for all normal distributions is three. __ 正态分布的峰度=3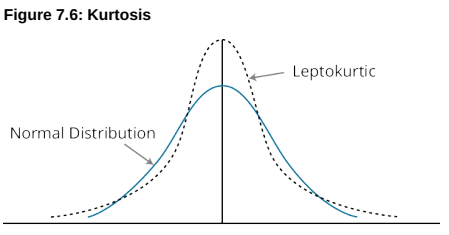
↑ **”fat tail” for leptokurtic
- Measures of Sample Skew and Kurtosis
- Sample skewness=the sum of the cubed deviations from the mean divided by the cubed standard deviation and by the number of observations. 样本偏度的计算(三次方)
- relative skewness=zero ⋙ the data is not skewed. (偏度=0↔对称分布)
- relative skewness>0 ⋙positively skewed distribution.(正偏度代表正/右偏)
- relative skewness<0 ⋙negatively skewed distribution. (负偏度代表负/左偏)
- sample skewness>0.5 (absolute value) ⋙ considered significant(偏度超过0.5就被认为具有显著性)
- Sample kurtosis is measured using deviations raised to the fourth power. 样本峰度的计算(四次方)
——————————————————————————————————————————-
- To interpret kurtosis, note that it is measured relative to the kurtosis of a normal distribution (=3). (峰度的比较基准是正态分布的峰度值)
- excess kurtosis>0 ⋙ leptokurtic (more peaked, fat tails). (峰度值大于3,超额峰度为正,mean附近分布密度大于正态分布,同时有fat tail)
- excess kurtosis<0 ⋙ platykurtic (less peaked, thin tails). (峰度值小于3,超额峰度为负,mean附近分布密度小于正态分布,同时有thin tail)
- Excess kurtosis values that exceed 1.0 in absolute value are considered large. 超额峰度大于1时可认为显著
m compare the use of arithmetic and geometric means when analyzing investment returns.
- Since past annual returns are compounded each period, the geometric mean of past annual returns is the appropriate measure of past performance.
- To estimate multi-year returns (e.g. expected annual return over the next three years), the geometric mean is the appropriate measure.
- The arithmetic mean is the statistically best estimator of the next year’s returns | applicaiton | arithmetic mean | geometric mean | | —- | —- | —- | | measure of past performance | | ✔ | | estimate multi-year returns | | ✔ | | estimator if the next year’s returns | ✔ | |
R08 Probability Concepts
a define a random variable, an outcome, an event, mutually exclusive events, and exhaustive events;
- random variable: an uncertain quantity/number.
- outcome: an observed value of a random variable.
- event: a single outcome or a set of outcomes.
- Mutually exclusive events are events that cannot both happen at the same time. 互斥事件
- Exhaustive events are those that include all possible outcomes. 完备事件
b state the two defining properties of probability and distinguish among empirical, subjective, and a priori probabilities;
- two defining properties of probability
- The probability of occurrence of any event (E) is between 0 and 1 (i.e., 0 ≤ P(E) ≤ 1). 概率值域为[0,1]
- If a set of events, E1, E2, … En, is mutually exclusive and exhaustive, the probabilities of those events sum to 1 (i.e., ΣP(Ei) = 1). 遍历概率的加和为1
- 几种probabilities
- empirical probability established by analyzing past data. [objective probabilities]
- priori probability determined using a formal reasoning and inspection process. [objective probabilities]
subjective probability the least formal method, involves the use of personal judgment.
c state the probability of an event in terms of odds for and against the event;
For P=1/8
odds for=1/7,one-to-seven
-
d distinguish between unconditional and conditional probabilities;
unconditional probability : the probability of an event regardless of the past or future occurrence of other events (a.k.a. marginal probability)
conditional probability: the occurrence of one event affects the probability of the occurrence of another event.
e explain the multiplication, addition, and total probability rules;
multiplication rule of probability
- addition rule of probability
- total probability rule
f calculate and interpret 1) the joint probability of two events, 2) the probability that at least one of two events will occur, given the probability of each and the joint probability of the two events, and 3) a joint probability of any number of independent events;
- the joint probability of two events
the probability that they will both occur, applying the multiplication rule
- the probability that at least one of two events will occur
applying the addition rule
- joint probability of any number of independent events
g distinguish between dependent and independent events;
- independent events
Independent events: the occurrence of one events has NO influence on the occurrence of the others.
- dependent events
the occurrence of one is dependent on the occurrence of the other
h calculate and interpret an unconditional probability using the total probability rule;
The total probability rule highlights the relationship between unconditional and conditional probabilities of mutually exclusive and exhaustive events.
It is used to explain the unconditional probability of an event in terms of probabilities that are conditional upon other events.
i explain the use of conditional expectation in investment applications;
Expected values or returns can be calculated using conditional probabilities.
j explain the use of a tree diagram to represent an investment problem;
A general framework called a tree diagram is used to show the probabilities of various outcomes. 树形图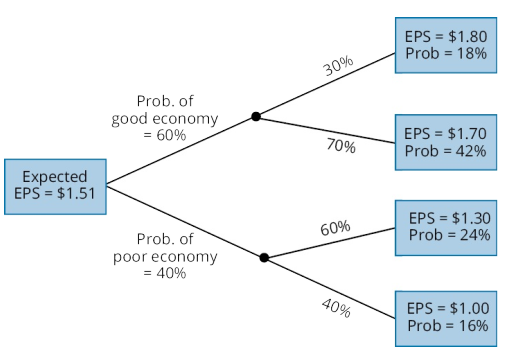
上下级相乘;同级相加应该等于1
k calculate and interpret covariance and correlation and interpret a scatterplot;
- covariance-calculation(from probability model)
Covariance is a measure of how two assets move together.
the expected value of the product of the deviations of the two random variables from their respective expected values.
- covariance-properties
- covariance measures how one random variable moves with another. 协方差衡量两变量协同变化的关系
- The covariance of RA with itself is equal to the variance of RA; Cov(RA,RA) =Var(RA). 自己与自己的协方差等于方差
- covariance may range from negative infinity to positive infinity. 协方差值域从负无穷到正无穷
- sample variance
- interpretation
在应用中协方差比较难解释,主要因为其值域为负无穷到正无穷,故有了如下的标准化形式(相关系数)
- standardization of covariance: correlation coefficient
- properties of correlation coefficient
- measures the strength of the linear relationship between two random variables.
- no units 无量纲
- ranges from –1 to +1
⋙ perferct positive correlation
⋙ perfect negative correlation
⋙ 无线性相关性
- scatterplots
注意no relationship与non-linear relationship的区别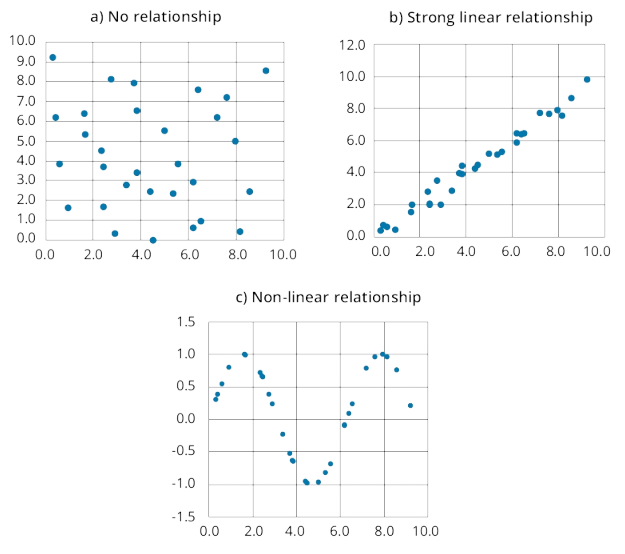
- Spurious correlation: refers to correlation that is either the result of chance _or _present due to changes in both variables over time that is caused by their association with a third variable 伪相关性:偶然出现的相关性;或者两个随机变量都和第三个变量相关
l calculate and interpret the expected value, variance, and standard deviation of a random variable and of returns on a portfolio;
资产组合的期望收益
单个资产的收益期望(概率分布的期望值)
资产组合的收益期望(加权平均值)
<br /> 
资产组合的方差 [calculating variance based on covariance from a probability model.]
- 特例:当N=2时
资产组合的标准差
m calculate and interpret covariance given a joint probability function;
n calculate and interpret an updated probability using Bayes’ formula;
Bayes’ formula is used to update a given set of prior probabilities for a given event in response to the arrival of new information.
- calculation
- 理解:当有新的信息出现时,事件的遍历集合被改变,进而概率会updated。(A:骰子=6的概率,B: 骰子结果为偶数。在得到信息B 的情况下,A的概率会更新)
o identify the most appropriate method to solve a particular counting problem and solve counting problems using factorial, combination, and permutation concepts.
- Labeling & Combination
- Labeling: there are n items that can each receive one of k different labels.
The total number of ways that the labels can be assigned is
TI 计算器 计算阶乘的步骤:
[4]→[2nd]→[x!] = 24
- 当k=2时,combination formula
TI 计算器 计算组合公式的步骤:
[8]→[2nd]→[nCr] →[3]→[=] 56
- permutation formula 排列
- permutation: a specific ordering of a group of objects.
TI 计算器 计算排列公式的步骤:
[8]→[2nd]→[nPr] →[3] →[=] 336
(i.e. 876)
- guidelines to select counting method
- multiplication rule of counting used when there are two or more groups. The key is that only one item may be selected from each group. If there are k steps required to complete a task and each step can be done in n ways, the number of different ways to complete the task is n1 × n2 × … × nk.
- Factorial used by itself when there are no groups—we are only arranging a given set of n items. Given n items, there are n! ways of arranging them. (factorial: 阶乘)
- labeling formula applies to three or more subgroups of predetermined size. Each element of the entire group must be assigned a place, or label, in one of the three or more subgroups.
- combination formula: only two groups of predetermined size. Look for the word ‘choose’ /‘combination’.
- permutation formula: only two groups of predetermined size. Look for a specific reference to ‘order’.
Quantitative Methods (2)
R09 Common Probability Distributions
a define a probability distribution and distinguish between discrete and continuous random variables and their probability functions;
- probability distribution
describes the probabilities of all the possible outcomes for a random variable
- discrete random variables
number of possible outcomes can be counted; for each possible outcome, probability is measurable and positive .
- continuous random variables
the number of possible outcomes is infinite, even if lower and upper bounds exist.
- probability function
probability function,p(x), specifies the probability that a random variable is equal to a specific value.
p(x) = P(X = x)
- 性质
- 离散随机变量
- 连续随机变量只能计算X取值位于一定区间内的概率,某一点的取值概率(不管有没有可能)均为0
b describe the set of possible outcomes of a specified discrete random variable;
///c interpret a cumulative distribution function;
- cumulative distribution function** (cdf)** 累计分布函数
cdf: probability that a random variable, X, takes on a value equal to or less than a specific value, x
i.e.
下图中:a. 概率密度函数 b.累计分布函数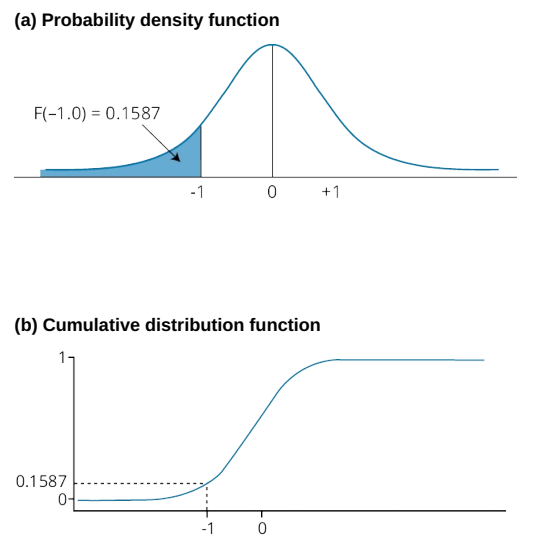
d calculate and interpret probabilities for a random variable, given its cumulative distribution function;
e define a discrete uniform random variable, a Bernoulli random variable, and a binomial random variable;
- discrete uniform random variable: the probabilities for all possible outcomes for a discrete random variable are equal. 离散变量,且各个outcome的概率均相等
- binomial random variable may be defined as the number of ‘successes’ in a given number of trials The probability of success, p, is constant for each trial, and the trials are independent. 二项随机变量:n组实验中成功的个数
- Bernoulli random variable : A binomial random variable for which the number of trials is 1 零一分布
f calculate and interpret probabilities given the discrete uniform and the binomial distribution functions;
| | discrete uniform distribution | binomial distribution | | —- | —- | —- | | Probability | || | Expected Value | |
| | Variance | |
|
g construct a binomial tree to describe stock price movement;
A binomial tree is constructed by showing all the possible combinations of up-moves and down-moves over a number of successive periods.
- 注1:各个stage的股价上涨概率均为p,下跌概率均为1-p
- 注2:u*d=1
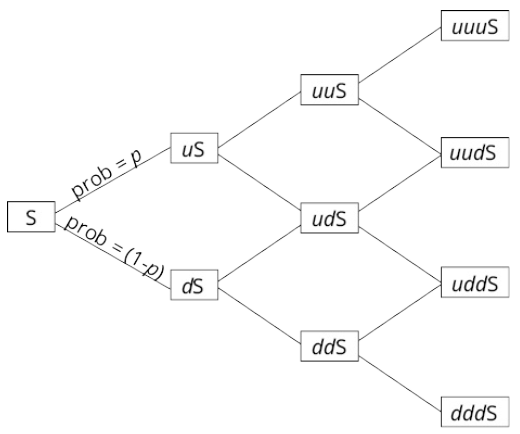
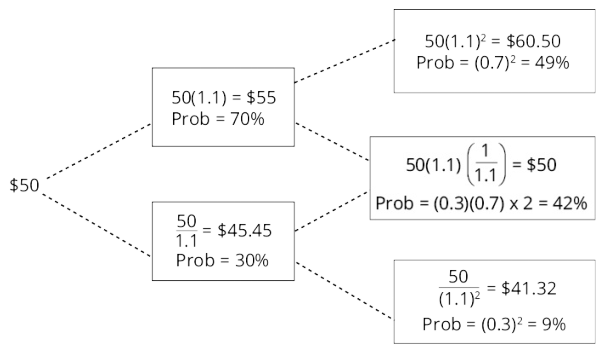
One of the important applications of a binomial stock price model is in pricing options. We can make a binomial tree for asset prices more realistic by shortening the length of the periods and increasing the number of periods and possible outcomes.
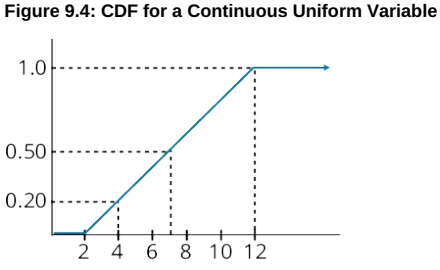
h define the continuous uniform distribution and calculate and interpret probabilities, given a continuous uniform distribution;
continuous uniform distribution 连续均匀分布
- For all a ≤ x1 < x2 ≤ b (i.e., for all x1 and x2 between the boundaries a and b).
- P(X < a or X > b) = 0 (i.e., the probability of X outside the boundaries is zero).
- P(x1 ≤ X ≤ x2) = (x2 - x1)/(b - a). This defines the probability of outcomes between x1 and x2.
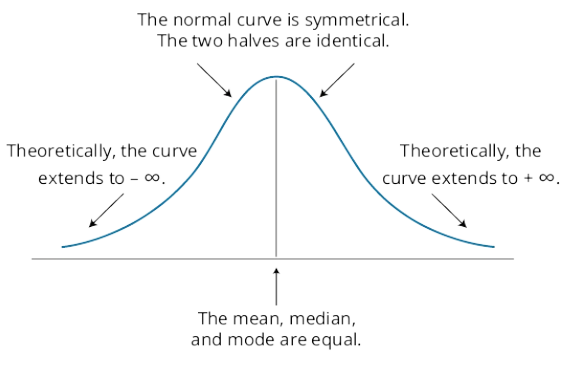
i explain the key properties of the normal distribution;
- It is completely described by its mean
, and variance,
, stated as
- skewness=0, symmetric, mean=median=mode 偏度=0,对称分布,均值=中位数=众数
- kurtosis=3 峰度=3(用于计算超额峰度)
- 两个正态分布变量的线性加和仍为正态分布变量
- tails get very thin but extend infinitely
j distinguish between a univariate and a multivariate distribution and explain the role of correlation in the multivariate normal distribution;
- definition
- univariate distributions: the distribution of a single random variable
- multivariate distribution: the probabilities associated with a group of random variables 多变量分布中的变量之间需相关
- correlation
- Correlation indicates the strength of the linear relationship between a pair of random variables
the multivariate normal distribution can be completely defined by:
- n means of the n series of returns
.
- n variances od the n series of returns
pair-wise correlations(这是主要的区别,单变量正态分布没有相关性系数矩阵)
k determine the probability that a normally distributed random variable lies inside a given interval;
confidence interval: a range of values around the expected outcome within which we expect the actual outcome to be some specified percentage of the time
置信区间:期望值附近的一个区间,变量出现在区间内的概率为一个特定值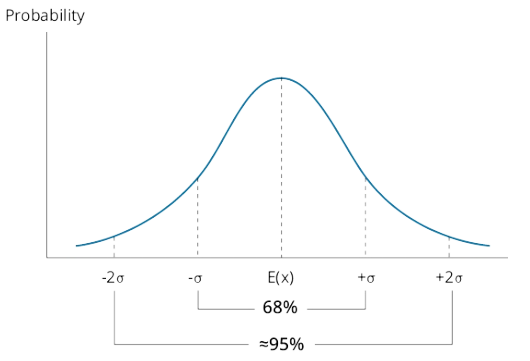
正态分布的置信区间:
- n means of the n series of returns
the 90% confidence interval for X is
- the 95% confidence interval for X is
- the 99% confidence interval for X is
l define the standard normal distribution, explain how to standardize a random variable, and calculate and interpret probabilities using the standard normal distribution;
- standard normal distribution
standard normal distribution is a normal distribution that has been standardized so that it has a mean of zero and a standard deviation of 1 均值为0,标准差为1的正态分布
- standardize a normal variable 标准化一个正态分布
- calculate and interpret probabilities with N(0,1)
m define shortfall risk, calculate the safety-first ratio, and select an optimal portfolio using Roy’s safety-first criterion;
- shortfall risk
the probability that a portfolio value or return will fall below a particular (target) value or return over a given time period
- Roy’s safe-first criterion & safe-first ratio
- Roy’s safety-first criterion
the optimal portfolio minimizes the probability that the return of the portfolio falls below some minimum acceptable level (threshold level).
- safe-first ratio
If portfolio returns are normally distributed, then Roy’s safety-first criterion can be stated as:
- 看成假设检验:z值越高,越拒绝R的概率就越高
- 在
坐标系空间中,SF Ratio代表斜率,斜率越大,则:
- definition&properties
- The lognormal distribution is generated by the function
, where x is normally distributed
- 性质
- The lognormal distribution is skewed to the right. 对数正态分布右偏
- The lognormal distribution is bounded from below by zero so that it is useful for modeling asset prices which never take negative values. 对数正态分布的下界为零,可能的取值中不存在负值
![[B] Quantitative Methods - 图82](/uploads/projects/jianzhou@enxqsv/076cdc8a45fbbe29b3260a4502b1bb66.jpeg)
- 为什么在资产价格模型中使用对数正态分布
- 资产价格不可能为负值
- A price relative is just the end-of-period price of the asset divided by the beginning price (S1/S0) and is equal to (1 + the holding period return).
o distinguish between discretely and continuously compounded rates of return and calculate and interpret a continuously compounded rate of return, given a specific holding period return;
- discretely compounded,m=有限
- continuous compounding , m→无穷
给定sated annual rate:Rcc
这里HPR就是EAR,S/S=1+HPR=1+EAR
- One property of continuously compounded rates of return is that they are additive for multiple periods.
p explain Monte Carlo simulation and describe its applications and limitations;
- Monte Carlo simulation
- 定义:一种以概率和统计理论方法为基础的一种随机模拟方法,是使用随机数(or伪随机数)。将所求解的问题同一定的概率模型相联系,用计算机实现统计模拟或抽样,以获得问题的近似解。
- 例子:股票期权
- 确定股票价格和相关利率的distribution,并确定相关参数(mean, variance, possibly skewness)
- 根据distribution随机抽样获取(股票价格,利率)数据组
- 在每组数据的背景下对期权进行估值
- 重复以上过程,得出期权价格的模拟分布
- applications
- value complex securities
- simulate the profits/losses from a trading strategy
- calculate estimates of value at risk (VaR) to determine the risk of a portfolio of assets and liabilities
- simulate pension fund assets and liabilities over time to examine the variability of the difference between the two
- value portfolios of assets that have nonnormal returns distributions
- limitations
- fairly complex** **
- will provide answers that are no better than the assumptions about the distributions of the risk factors and the pricing/valuation model that is used
simulation is not an analytic method, but a statistical one, and cannot provide the insights that analytic methods can.
q compare Monte Carlo simulation and historical simulation
Historical simulation: based on actual changes in value or actual changes in risk factors over some prior period. 与“蒙”的主要区别,从历史数据中抽样,不必对input的分布做出事先假设。(既是优点,又是缺点)
优: using actual distribution of risk factors⋙ not need to estimate distribution of changes in the risk factors
- 缺: past changes in risk factors may not be a good indication of future changes. (过去不代表未来)
- Events that occur infrequently may not be reflected in historical simulation results unless the events occurred during the period from which the values for risk factors are drawn.
小概率事件在所选历史时期内可能从未出现
- An additional limitation of historical simulation is that it cannot address the sort of “what if” questions that Monte Carlo simulation can. 没有办法研究what if的问题 例↓
With Monte Carlo simulation, we can investigate the effect on the distribution of security/portfolio values if we increase the variance of one of the risk factors by 20%; with historical simulation we cannot do this
R10 Sampling and Estimation
a define simple random sampling and a sampling distribution;
- simple random sampling
Simple random sampling: each item in the population studied has the same likelihood of being included in the sample.
Systematic sampling, selecting every n-th member from a population
- sample distribution
the sample statistic itself is a random variable and, therefore, has a probability distribution.
sampling distribution of the sample statistic: a probability distribution of all possible sample statistics computed from a set of equal-size samples that were randomly drawn from the same population. Think of it as the probability distribution of a statistic from many samples
b explain sampling error;
Sampling error: the difference between a sample statistic (the mean, variance, or standard deviation of the sample) and its corresponding population parameter (the true mean, variance, or standard deviation of the population).
c distinguish between simple random(LOS10.a) and stratified random sampling;
Stratified random sampling
- uses a classification system to separate the population into smaller groups based on one or more distinguishing characteristics.
- From each subgroup, or stratum, a random sample is taken and the results are pooled.
The size of the samples from each stratum is based on the size of the stratum relative to the population.
先分组,后在组内简单随机抽样,每组的 simple size 成比例(在构造债券指数的时候常用,根据maturity等 factor进行分组)
d distinguish between time-series and cross-sectional data;
- Time-series data: observations taken over a period of time at specific and equally spaced time intervals.
- Cross-sectional data: a sample of observations taken at a single point in time.
- Longitudinal data: observations over time of multiple characteristics of the same entity,
e.g. unemployment, inflation, and GDP growth rates for a country over 10 years.
- Panel data: observations over time of the same characteristic for multiple entities
e.g. debt/equity ratios for 20 companies over the most recent 24 quarters.
e explain the central limit theorem and its importance;
- central limit theorem 中心极限定理(样本均值的分布)
For simple random samples of size n from a population with a mean **µ and a finite variance σ2, the sampling distribution of the sample mean x approaches a normal probability distribution with mean µ** and a variance equal to as the sample size becomes large (usually means n ≥ 30 )
- importance
不管总体分布如何,只要样本容量足够大,样本均值(as a 随机变量)就服从正态分布。
f calculate and interpret the standard error of the sample mean;
definition:
- st**andard error** of the sample mean,
: the standard deviation of the distribution of the sample means.
calculation:
- 总体方差
已知时:
g identify and describe desirable properties of an estimator;
- unbiasedness** **
expected value of the estimator is equal to the parameter you are trying to estimate.
无偏性,估计量的期望值等于真值
- efficiency** **
_variance _of its sampling distribution is smaller than all the other unbiased estimators
估计量的方差小于其他无偏估计量
- consistency** **
the accuracy of the parameter estimate increases as the sample size increases.
样本容量越大,估计量越准确
h distinguish between a point estimate and a confidence interval estimate of a population parameter;
- Point estimates: single (sample) values used to estimate population parameters.
estimator: the formula used to compute the point estimate.
- confidence interval : a range of values in which the population parameter is expected to lie.
i describe properties of Student’s t-distribution and calculate and interpret its degrees of freedom;
- t分布的特点
钟形;对称
- symmetrical
- defined by a single parameter, the degrees of freedom (df)
对于sample mean,
- fatter tails than the normal distribution
- 样本容量越大,自由度越大,t分布越接近正态分布
- 关于自由度degree of freedom
the degree of freedom for tests based on sample means are n-1, because, given the mean, only n-1 observations can be unique
与标准正态相比,同样置信度下,t分布的置信区间更宽,导致在应用t分布进行假设检验时零假设更难以被拒绝
j calculate and interpret a confidence interval for a population mean, given a normal distribution with 1) a known population variance, 2) an unknown population variance, or 3) an unknown population variance and a large sample size;
| distribution | variance | Test Statistic | |
|---|---|---|---|
| small sample (n≤30) | large sample (n≥30) | ||
| normal | known | z-statistic | z-statistic |
| normal | unknown | t-statistic | t-statistic |
| non-normal | known | not available | z-statistic |
| non-normal | unknown | not available | t-statistic |
k describe the issues regarding selection of the appropriate sample size, datamining bias, sample selection bias, survivorship bias, look-ahead bias, and timeperiod bias.
- 实操中“样本容量越大越好”观点的限制
- Larger samples may contain observations from a different population (distribution).
- The costs of using a larger sample must be weighed against the value of the increase in precision from the increase in sample size.
Both of these factors suggest that the largest possible sample size is not always the most appropriate choice__
- datamining bias
Data-mining bias refers to results where the statistical significance of the pattern is overestimated because the results were found through data mining.
When reading research findings that suggest a profitable trading strategy, make sure you heed the following warning signs:
- Evidence that many different variables were tested, most of which are unreported, until significant ones were found.
- The lack of any economic theory that is consistent with the empirical results.
- sample selection bias
Sample selection bias: some data is systematically excluded from the analysis, usually because of the lack of availability.
This practice renders the observed sample to be nonrandom, and any conclusions drawn from this sample can’t be applied to the population because the observed sample and the portion of the population that was not observed are different.__
- survivorship bias 幸存者偏差
Survivorship bias ⋙ the most common form of sample selection bias
The surviving sample is biased toward the better funds (i.e., it is not random). The analysis of a mutual fund sample with survivorship bias will yield results that overestimate the average mutual fund return because the database only includes the better performing funds
表现较差的fund退出,导致其无data availability,样本统计量整体向幸存下来的(也就是表现较好的)基金偏移
- look-ahead bias 先窥偏差
Look-ahead bias: a study tests a relationship using sample data that was not available on the test date
- timeperiod bias
Time-period bias result if the time period over which the data is gathered is either too short or too long.
If the time period is too short, research results may reflect phenomena specific to that time period, or perhaps even data mining.
If the time period is too long, the fundamental economic relationships that underlie the results may have changed.
R11 Hypothesis Testing
a define a hypothesis, describe the steps of hypothesis testing, and describe and interpret the choice of the null and alternative hypotheses;
- definition
hypothesis: a statement about the value of a population parameter developed for the purpose of testing a theory or belief.
- steps** of htpothesis testing**
- state the hypothesis 提出假设
- select the appropriate test statistic 选择合适的统计量
- specify the level of significance 确定置信度水平
- state the decision rule regarding the hypothesis 根据假设确定decision rule
- collect the sample and calculate the sample statistics 收集样本,计算样本统计量
- make a decision regarding the hypothesis 根据假设做出decision
- make a decision based on the results of the test 根据检验结果做出decision
- The Null Hypothesis and Alternative Hypothesis
null hypothesis
: the hypothesis that the researcher wants to reject
alternative hypothesis
: what is concluded if there is sufficient evidence to reject the null hypothesis.
↑ usually the alternative hypothesis that you are really trying to assess.
Why? Since you can never really prove anything with statistics, when the null hypothesis is discredited, the implication is that the alternative hypothesis is valid.__
b distinguish between one-tailed and two-tailed tests of hypotheses;
- one-tailed test
upper tail:
lower tail:
two-tailed test

- A two-tailed test uses two critical values (or rejection points). 两个临界值
- General decision rule: Reject H0 if: test statistic > upper critical value or test statistic < lower critical value
decision rule (rejection rule) for a two-tail** z**-test at α=0.05 can be stated as:
c explain a test statistic, Type I and Type II errors, a significance level, and how significance levels are used in hypothesis testing;
- test statistic
test statistic: calculated by comparing the point estimate with the hypothesized **value of the population parameter
↑ a random variable (its distribution depends on the characteristics of the sample and the population)
test statistic: the difference between sample statistic and hypothesized value, scaled by standard error **of sample statistic.
样本容量为、均值为
。其standard error of the sample statistic (simple mean)
- 当总体标准差已知时:
- 当总体标准差未知时:
- Types I and Type II errors
- Type I error: the rejection of the null hypothesis when it is actually true (弃真错误)
- Type II error: the failure to reject the null hypothesis when it is actually false (H为假时不拒绝)
significance level and its use in hypothesis testing
significance level, α: the probability of making a Type I error (rejecting the null when it is true)
d explain a decision rule, the power of a test, and the relation between confidence intervals and hypothesis tests;
decision rule
A decision rule is specific and quantitative.
- Once we have determined whether a one- or two tailed test is appropriate, the significance level we require, and the distribution of the test statistic, we can calculate the exact critical value for the test statistic.
- Then we have a decision rule of the following form: if the test statistic is (greater, less than) the value X, reject the null.
- power of test 检验效能
- power of a test:the probability of correctly rejecting the null hypothesis when it is false. 准确拒绝H0的概率
—————————————————————————————————————————————————————————————
Type I and Type II Errors in Hypothesis Testing
Decision** |
True Condition | |
|---|---|---|
| H0 is true | H0 is false | |
| Do not reject H0 | Correct decision 😊 |
Incorrect decision Type II error |
Reject H0 |
Incorrect decision Type I error Significance level, α |
Correct decision Power of the test=1-P(Type II error) 😊 |
- 显著性水平和power of test以及样本容量的关系
- Decresing the significance level (probability of a Type I error) will incrase the probability of failling to reject a false null (Type II error) and thereore reduce the power of test.
置信度水平α越低,critical value包含的区间就越宽,弃真概率降低,但更容易fail to reject a false null hypothesis
- For a given sample size, we can increase the power of a test only with the cost that the probability of rejecting a true null (Type I error) increases.
当样本容量不变时,增加准确拒绝false null hypothesis的概率(仅能通过缩短critical value的区间实现,即增加α),代价是弃真错误上升
- For a given significance level, we can decrease the probability of a Type II error and increase the power of a test, only by increasing the sample size
以population mean检验为例,在给定置信度水平下,样本容量n上升会使检验统计量增大,准确拒绝null hypothesis的概率上升
- relation between **confidence intervals and hypothesis tests **
confidence intervals
- A confidence interval: a range of values within which the researcher believes the true population parameter may lie.
interpretation: for a level of confidence of 95%, for example, there is a 95% probability that the true population parameter is contained in the interval.
总体参数真值在置信区间内出现的概率为置信度水平
- 求取置信区间和进行假设检验都要用到critical value**,**对应的置信度水平(level of confidence)即为相应的显著性水平(level of significance)。根据level确定critical value,和样本统计量对比或求置信区间本质一样。
e distinguish between a statistical result and an economically meaningful result;
Statistical significance does not necessarily imply economic significance
- transactions costs 交易成本使模型策略的收益降低
- Taxes may make a seemingly attractive strategy a poor one in practice税务因素
- statistically significant results may not be economically significant is risk,策略可能增加了投资组合的风险
f explain and interpret the p-value as it relates to hypothesis testing;
- p-value
p-value: the probability of obtaining a test statistic that would lead to a rejection of the null hypothesis, assuming the null hypothesis is true. 当原假设为真的时候,错误拒绝原假设的概率。是统计量本身的性质,与critical value相似,但并无直接关系。
- relations to hypothesis testing
p-value ⋙ smallest level of significance for which the null hypothesis can be rejected.
Figure 11.5: Two-Tailed Hypothesis Test With p-Value = 2.14% 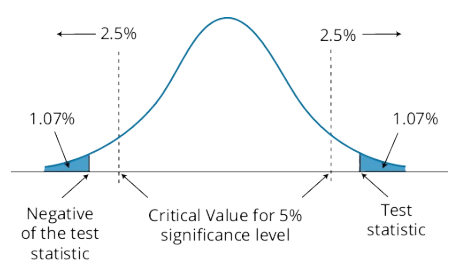
g identify the appropriate test statistic and interpret the results for a hypothesis test concerning the population mean of both large and small _samples when the population is _normally or approximately normally distributed and the variance is 1) known or 2) unknown;
| | t-test | z-test | | —- | :—-: | :—-: | | 适用情况 |
- 总体方差未知,且
- [大样本,非正态]or[大/小样本,正态/近似正态]
注:n≥30可被认为是大样本 |
- 总体方差已知
- [大样本,非正态]or[大/小样本,正态]
| | 统计量 ||
|
Critical z-Values-常用z值
| Level of Significance | Two-Tailed Test | One-Tailed Test |
|---|---|---|
| 0.10=10% | ±1.65 | +1.28 or -1.28 |
| 0.05=5% | ±1.96 | +1.65 or -1.65 |
| 0.01=1% | ±2.58 | +2.33 or -2.33 |
——————————————————————————————————————————-
对于总体标准差位置的检验,当样本容量非常大时,t检验更保守,但是z检验也可以用,此时z统计量为:
h identify the appropriate test statistic and interpret the results for a hypothesis test concerning the equality of the population means of two at least approximately normally distributed populations, based on independent random samples with 1) equal or 2) unequal assumed variances;
注1:这里是difference of means,是检验两个总体的均值是否相等
注2:两个总体必须相互独立,且均为正态分布
- 假设形式:
双尾检验
- 统计量选择:t分布
- equal assumed variances
- unequal assumed variances
————————————————————————————————————————————————
do not need to memorize these formulas, but should understand:
[1] the numerator,
[2] the fact that these are t-statistics,
[3] the variance of the pooled sample is used when the sample variances are assumed to be equal
————————————————————————————————————————————————
interpret the results
- If the sample means are very close together, the numerator of the t-statistic (and the t-statistic itself) are small⋙do not reject equality.
- If the sample means are far apart, the numerator of the t-statistic (and the t-statistic itself) are large⋙reject equality
- this test is only valid for two populations that are independent and normally distributed
i identify the appropriate test statistic and interpret the results for a hypothesis test concerning the mean difference of two normally distributed populations;
注:mean of differences是成对数据‘差的平均值’
假设形式:
双尾:
单尾1:
单尾2:
统计量选择:t分布
interpretation
同一般t检验的decision rule
————————————————————————————————————————————————
Keep in mind that we have been describing two distinct hypothesis tests,
- one about the significance of the **difference between the means **of two populations and
- one about the significance of the **mean of the differences** between pairs of observations.
Here are rules for when these tests may be applied:
- The test of the differences in means is used when there are two independent samples.
- A test of the significance of the mean of the differences between paired observations is used when the samples are not independent
j identify the appropriate test statistic and interpret the results for a hypothesis test concerning 1) the variance of a normally distributed population, and 2) the equality of the variances of two normally distributed populations based on two independent random samples;
- 单个正态分布总体的方差检验
- 假设形式:
双尾:
单尾1:
单尾2:
统计量选择:
分布
<br /> n: simple size<br /> s: 样本方差<br /> : 总体方差的假设值interpret the results
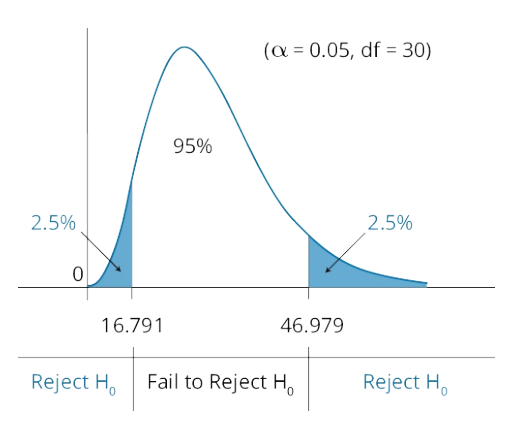
注:chi-square检验的统计量不可能小于零
- 两个正态分布总体的方差是否相等,基于独立随机样本
- 假设形式:
双尾:
单尾1:
单尾2:
- 统计量选择: F 检验
,
: 总体1中样本容量为
的样本方差;
: 总体2中样本容量为
的样本方差
tip:使大方差总在分子上,这样便仅需比较critical value的上界
- interpret the result
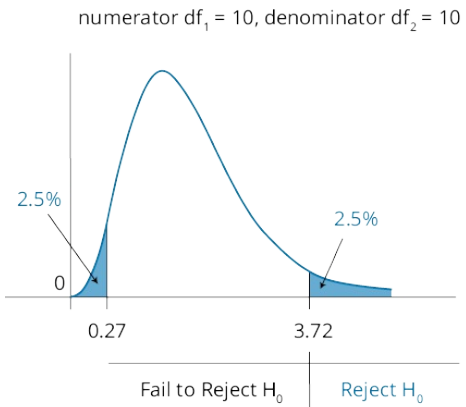
若令分子大于分母,F统计量总大于1,故仅需要和上界比较(上界下界互为倒数)
k formulate a test of the hypothesis that the population correlation coefficient equals zero and determine whether the hypothesis is rejected at a given level of significance;
两个总体相关系数是否为零
formulate
decision rule
l distinguish between parametric and nonparametric tests and describe situations in which the use of nonparametric tests may be appropriate.
- parametric test
Parametric tests rely on assumptions regarding the distribution of the population and are specific to population parameters.
eg. t-tset, F-test, chi-square test
- nonparametric test
Nonparametric tests either do not consider a particular population parameter or have few assumptions about the population that is sampled
- 非参数检验的应用场景
- The assumptions about the distribution of the random variable that support a parametric test are not met. An example would be a hypothesis test of the mean value for a variable that comes from a distribution that is not normal and is of small size so that neither the t-test nor the z-test is appropriate.
没有合适的参数检验选择。例:非正态分布+小样本的总体均值μ的假设检验
The Spearman rank correlation test can be used when the data are not normally distributed.
- When data are ranks (an ordinal measurement scale) rather than values.
假设检验为ranking而非具体数值
- The hypothesis does not involve the parameters of the distribution, such as testing whether a variable is normally distributed. We can use a nonparametric test, called a runs test, to determine whether data are random. A runs test provides an estimate of the probability that a series of changes (e.g., +, +, –, –, +, –,….) are random.
假设检验不涉及分布参数。例:检验一个变量是否是正态分布;利用run test检验a series change 是否随机
