- SS18 Portfolio Management (1)
- R51 Portfolio Management: An Overview
- a describe the portfolio approach to investing;
- b describe the steps in the portfolio management process;
- c describe types of investors and distinctive characteristics and needs of each;
- d describe defined contribution and defined benefit pension plans;
- e describe aspects of the asset management industry;
- f describe mutual funds and compare them with other pooled investment products.
- R52 Portfolio Risk and Return: Part I
- a calculate and interpret major return measures and describe their appropriate uses;**
- b compare the money-weighted and time-weighted rates of return and evaluate the performance of portfolios based on these measures
- c describe characteristics of the major asset classes that investors consider in forming portfolios;
- d calculate and interpret the mean, variance, and covariance (or correlation) of asset returns based on historical data;
- e explain risk aversion and its implications for portfolio selection;
- f calculate and interpret portfolio standard deviation;
- g describe the effect on a portfolio’s risk of investing in assets that are less than perfectly correlated;
- h describe and interpret the minimum-variance and efficient frontiers of risky assets and the global minimum-variance portfolio;
- i explain the selection of an optimal portfolio, given an investor’s utility (or risk aversion) and the capital allocation line.
- R53 Portfolio Risk and Return: Part II
- a describe the implications of combining a risk-free asset with a portfolio of risky assets;
- b explain the capital allocation line (CAL) and the capital market line (CML);
- c explain systematic and nonsystematic risk, including why an investor should not expect to receive additional return for bearing nonsystematic risk;
- d explain return generating models (including the market model) and their uses;
- e calculate and interpret beta;
- f explain the capital asset pricing model (CAPM), including its assumptions, and the security market line (SML);
- g calculate and interpret the expected return of an asset using the CAPM;
- h describe and demonstrate applications of the CAPM and the SML;
- i calculate and interpret the Sharpe ratio, Treynor ratio, M, and Jensen’s alpha.
- R51 Portfolio Management: An Overview
- SS19 Portfolio Management (2)
- R54 Basics of Portfolio Planning and Construction
- a describe the reasons for a written investment policy statement (IPS);
- b describe the major components of an IPS;
- c: Describe risk and return objectives and how they may be developed for a client
- d distinguish between the willingness and the ability (capacity) to take risk in analyzing an investor’s financial risk tolerance;
- e describe the investment constraints of liquidity, time horizon, tax concerns, legal and regulatory factors, and unique circumstances and their implications for the choice of portfolio assets;
- f explain the specification of asset classes in relation to asset allocation;
- g describe the principles of portfolio construction and the role of asset allocation in relation to the IPS;
- h describe how environmental, social, and governance (ESG) considerations may be integrated into portfolio planning and construction.
- R55 Introduction to Risk Management
- a define risk management;
- b describe features of a risk management framework;
- c define risk governance and describe elements of effective risk governance;
- d explain how risk tolerance affects risk management;
- e describe risk budgeting and its role in risk governance;
- f identify financial and non-financial sources of risk and describe how they may interact;
- g describe methods for measuring and modifying risk exposures and factors to consider in choosing among the methods.
- R56 Technical Analysis
- a explain principles of technical analysis, its applications, and its underlying assumptions;
- b describe the construction of different types of technical analysis charts and interpret them;
- c explain uses of trend, support, resistance lines, and change in polarity;
- d describe common chart patterns;
- e describe common technical analysis indicators (price-based, momentum oscillators, sentiment, and flow of funds);
- f explain how technical analysts use cycles;
- g describe the key tenets of Elliott Wave Theory and the importance of Fibonacci numbers;
- h describe intermarket analysis as it relates to technical analysis and asset allocation.
- R57 Fintech in Investment Management
- R54 Basics of Portfolio Planning and Construction
SS18 Portfolio Management (1)
R51 Portfolio Management: An Overview
a describe the portfolio approach to investing;
portfolio perspective: evaluating individual investments by their contribution to the risk and return of an investor’s portfolio
morden portfolio perspective:
extra risk from holding only a single security is NOT rewarded with higher expected investment returns.
diversification allows an investor to reduce portfolio risk without necessarily reducing the portfolio’s expected return.
unless the returns of the risky assets are perfectly positively correlated, risk is reduced by diversifying across assets.
modern portfolio theory (MPT)
equilibrium expected returns for securities and portfolios that are a linear function of each security’s or portfolio’s market risk.
(the risk that CANNOT be reduced by diversification) ⬆
diversification ratio:
![[J] Portfolio Management - 图1](/uploads/projects/jianzhou@enxqsv/5b68e69e3281ae21d2c20c894817f2f5.svg)
risk is measured by standard deviation of returns
diversification ratio 越小,diversification benefit越大
*portfolio diversification
works best when financial markets are operating normally;
less reduction of risk during market turmoil
b describe the steps in the portfolio management process;
| STEP | |
|---|---|
| 1 | planning step analysis of the investor’s risk tolerance, return objectives, time horizon, tax exposure, liquidity needs, income needs, and any unique circumstances or investor preferences |
| 2 | execution step analysis of the risk and return characteristics of various asset classes to determine how funds will be allocated to the various asset types. |
| 3 | feedback step |
c describe types of investors and distinctive characteristics and needs of each;
| Investor | Risk Tolerance | Investment Horizon | Liquidity Needs | Income Needs |
|---|---|---|---|---|
| Individuals | 视人而定 | 视人而定 | 视人而定 | 视人而定 |
| Banks | Low | Short | High | Pay interest |
| Endowments | High | Long | Low | Spending level |
| Insurance | Low | Long-life; Short-P&C | High | Low |
| Mutual funds | Depends on fund | Depends on fund | High |
Depends on fund |
| Defined benefit pensions | High | Long | Low | Depends on age |
d describe defined contribution and defined benefit pension plans;
defined **contribution **pension plan:
retirement plan in which the firm contributes a sum each period to the employee’s retirement account.
firm makes NO promise to the employee regarding the future value of the plan assets.
investment decisions are left to the employee, who assumes all of the investment risk.
defined **benefit **pension plan:
firm promises to make periodic payments to employees after retirement.
employer makes contributions to a fund established to provide the promised future benefits.
poor investment performance will increase the amount of required employer contributions to the fund.
e describe aspects of the asset management industry;
buy-side firms: Asset management firms
sell-side firms: broker-dealers, investment banks
full-service asset managers: offer a variety of investment styles and asset classes
specialist asset managers: may focus on a particular investment style or a particular asset class
multi-boutique firm: a holding company that includes a number of different specialist asset managers
active management: attempts to outperform a chosen benchmark through manager skill
passive management: attempts to replicate the performance of a chosen benchmark index
traditional broad market index tracking
smart beta approach: focuses on exposure to a particular market risk factor
traditional investment
alternative investment
trends
The market share for passive management has been growing over time.
The amount of data available to asset managers has grown exponentially in recent years
Robo-advisors increasingly appeal to younger investors and those with smaller portfolios than have typically been served by asset management firms
Robo-advisors offer investors advice and recommendations based on their investment requirements and constraints, using a computer algorithm.
f describe mutual funds and compare them with other pooled investment products.
pooled investments: a single portfolio that contains investment funds from multiple investors
mutual funds: each investor owns shares representing ownership of a portion of the overall portfolio
net asset value (NAV): total net value of the assets in the fund (pool) divided by the number of such shares issued
open-end fund: investors can buy newly issued shares at the NAV
redeem: investors sell shares back to the fund
no-load fund: do not charge additional fees for purchasing shares (up-front fees) or for redeeming shares (redemption fees) 免佣基金
load funds: charge either up-front fees, redemption fees, or both
closed-end funds: do not take new investments into the fund or redeem investor shares 封闭式基金
trade like equity shares (on exchanges or over-the-counter)
🌈mutual fund 类型
bond mutual funds: invest in fixed-income securities differentiated by bond maturities, credit ratings, issuers, and types
e.g. gov. bond funds, tax-exempt bond funds, high-yield (lower rated corporate) bond funds, and global bond funds.
| money market funds | 投资于:*short-term debt securities *provide interest income with very low risk of changes in share value 分类:*所购货币市场证券的类型 *基金的average maturities. |
|---|---|
| bond mutual funds | 投资于:*fixed-income securities 分类:*bond maturities, *credit ratings, *issuers, and types e.g. *government bond funds, *tax-exempt bond funds, *high-yield bond funds, *global bond funds |
| stock mutual funds | 投资于:*stock securities 分类:*passively managed ; *actively managed index funds: portfolio is constructed to match the performance of a particular index actively managed funds have higher: *higher annual management fees *have higher turnover of portfolio securities (% of investments that are changed during the year). *greater tax liabilities compared to passively managed index funds. |
exchange-traded funds (ETFs) purchases and sales are made in the market rather than with the fund itself.
separately managed account (SMA): portfolio that is owned by a single investor and managed according to that investor’s needs and preferences. No shares are issued, as the single investor owns the entire account.
hedge funds: pools of investor funds that are not regulated to the extent that mutual funds are.
private equity and venture capital: invest in portfolios of companies, often with intention to sell them later in public offerings.
buyout funds: involve taking a company private by buying all available shares, usually funded by issuing debt
R52 Portfolio Risk and Return: Part I
a calculate and interpret major return measures and describe their appropriate uses;**
| return measures | Note |
|---|---|
| holding period return (HPR) | the % increase in the value of an investment over a given time period |
| arithmetic mean return | |
| geometric mean return | |
| gross return | total return before deducting fees for the management and administration of the inv. account |
| net return | the return after fees have been deducted |
| pretax nominal return | the return prior to paying taxes |
| after-tax nominal return | the return after the tax liability is deducted |
| real return | nominal return adjusted for inflation Consider an investor who earns a nominal return of 7% over a year when inflation is 2%. The investor’s approximate real return is simply 7 - 2 = 5%. The investor’s exact real return is slightly lower, 1.07 / 1.02 - 1 = 0.049 = 4.9%. |
| leveraged return | return to an investor that is a multiple of the return on the underlying asset calculated as the gain or loss on the investment as a percentage of an investor’s cash investment |
b compare the money-weighted and time-weighted rates of return and evaluate the performance of portfolios based on these measures
money-weighted return: the internal rate of return on a portfolio, taking into account all cash inflows and outflows.
time-weighted rate of return: the rate at which $1 compounds over a specified performance horizon annual time-weighted return
Step 1: Value the portfolio immediately preceding significant additions or withdrawals. Form subperiods over the evaluation period that correspond to the dates of deposits and withdrawals.
Step 2: Compute the holding period return (HPR) of the portfolio for each subperiod.
Step 3: Compute the product of (1 + HPR) for each subperiod to obtain a total return for the entire measurement period [i.e., (1 + HPR1) × (1 + HPR2) … (1 + HPRn)] – 1. If the total investment period is greater than one year, you must take the geometric mean of the measurement period return to find the annual time-weighted rate of return.
In the investment management industry, the time-weighted rate of return is the preferred method of performance measurement, because it is not affected by the timing of cash inflows and outflows.
c describe characteristics of the major asset classes that investors consider in forming portfolios;
| Risk and Return of Major Asset Classes in the United States (1926–2017) | ||
|---|---|---|
| Assets Class | Average Annual Return (Geometric Mean) | Standard Deviation (Annualized Monthly) |
| Small-cap stocks | 12.1% | 31.7% |
| Large-cap stocks | 10.2% | 19.8% |
| Long-term corporate bonds | 6.1% | 8.3% |
| Long-term government bonds | 5.5% | 9.9% |
| Treasury bills | 3.4% | 3.1% |
| Inflation | 2.9% | 4.0% |
- asset classes with the greatest average returns also have the highest standard deviations of returns
- Evaluating investments using expected return and variance of returns is a simplification because returns do not follow a normal distribution; distributions are negatively skewed, with greater kurtosis (fatter tails) than a normal distribution.
- liquidity can affect the price and, therefore, the expected return of a security
d calculate and interpret the mean, variance, and covariance (or correlation) of asset returns based on historical data;
| variance of returns for an individual security | | | :—-: | —- | | population | sample | |![[J] Portfolio Management - 图2](/uploads/projects/jianzhou@enxqsv/fee185d61d8a3b6118a2374e7bb7bbac.svg) |
| ![[J] Portfolio Management - 图3](/uploads/projects/jianzhou@enxqsv/613af65f9d3b79a1e41d4780169bbbb4.svg) |
| covariance and correlation
|
| covariance and correlation
between two assets’ returns using historical data. thus a sample | | |![[J] Portfolio Management - 图4](/uploads/projects/jianzhou@enxqsv/4b8942cb2110b57f856a4d7214a0f6c1.svg)
|![[J] Portfolio Management - 图5](/uploads/projects/jianzhou@enxqsv/cea22af6d751f65074191c769be3842e.svg) |
|
|
|
- ρ= +1 ⋙ deviations always proportional in the same direction ⋙perfectly positively correlated.
- ρ= –1 ⋙ deviations always proportional in opposite directions ⋙ perfectly negatively correlated
- ρ= 0 ⋙ no linear relationship between the two stocks’ return ⋙ uncorrelated.
| |
e explain risk aversion and its implications for portfolio selection;
risk-averse: prefers less risk to more risk.
Given two investments that have equal expected returns, a risk-averse investor will choose the one with less risk (standard deviation, σ)
risk-seeking: prefers more risk to less and, given equal expected returns, will choose the more risky investment
risk-neutral: no preference regarding risk and would be indifferent between two such investments
f calculate and interpret portfolio standard deviation;
variance of returns for a portfolio of **two **risky assets ![[J] Portfolio Management - 图6](/uploads/projects/jianzhou@enxqsv/85b3ae97ab7b9a1509663e4b8553e665.svg)
g describe the effect on a portfolio’s risk of investing in assets that are less than perfectly correlated;
![[J] Portfolio Management - 图7](/uploads/projects/jianzhou@enxqsv/de92a9c84b2cba8689417dc5b89c589a.svg) ⋙
⋙ ![[J] Portfolio Management - 图8](/uploads/projects/jianzhou@enxqsv/de24caa99897be98ce85f01a80b59358.svg)
![[J] Portfolio Management - 图9](/uploads/projects/jianzhou@enxqsv/7e8d7a822bf76cfdae96929a86e96037.svg) ⋙
⋙ ![[J] Portfolio Management - 图10](/uploads/projects/jianzhou@enxqsv/9dce0aab821ea5822f3cd58d15684935.svg)
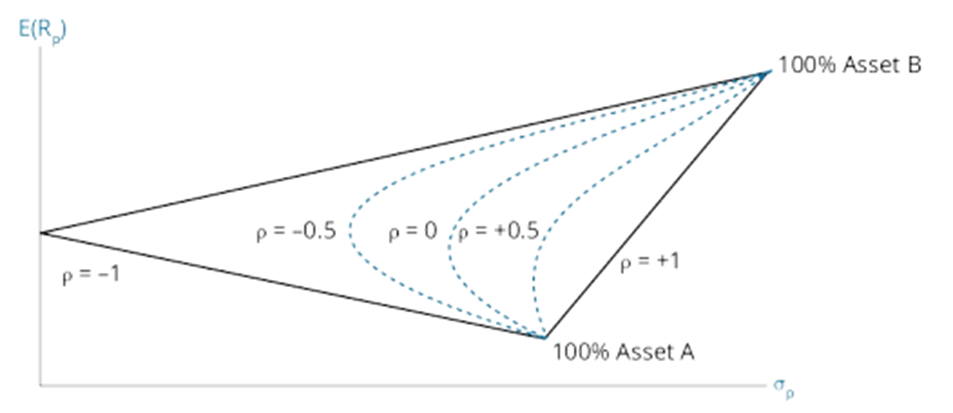
一般结论: 投资组合中的证券相关系数越低,组合的risk reduction效果越好。
h describe and interpret the minimum-variance and efficient frontiers of risky assets and the global minimum-variance portfolio;
minimum-variance portfolios: given expected return, portfolios with lowest standard deviation of all portfolios
minimum-variance frontier: 全部minimum-variance portfolio的集合
efficient frontier: portfolios that have the greatest expected return for each level of risk (standard deviation)
efficient frontier coincides with the top portion of the minimum-variance frontier
a risk-averse investor would only choose portfolios that are on the efficient frontier
global minimum-variance portfolio: portfolio on the efficient frontier that has the least risk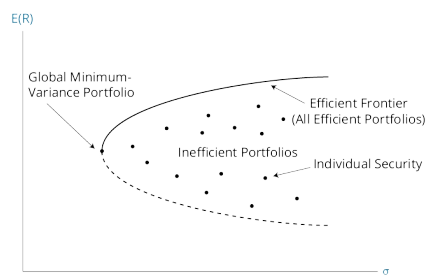
i explain the selection of an optimal portfolio, given an investor’s utility (or risk aversion) and the capital allocation line.
utility function: the investor’s preferences in terms of risk and return (i.e., his degree of risk aversion).
indifference curve: plots combinations of risk (standard deviation) and expected return among which an investor is indifferent. 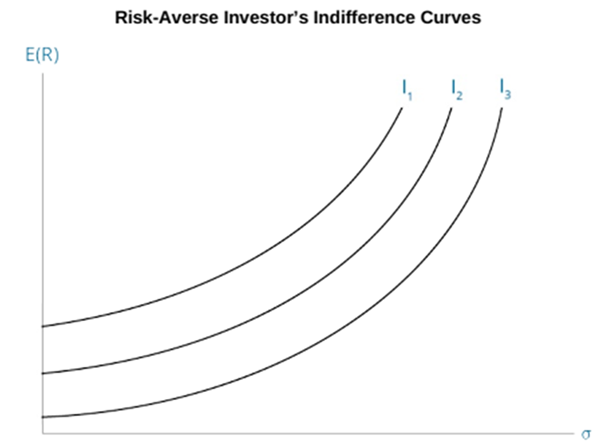
risk-averse investors的无差异曲线向上倾斜:更大的风险必须要用更高的回报期望加以补偿,以达到同样的utility
risk aversion coefficient: (可被理解为)单位风险上升所需的收益率期望补偿
无风险资产 risk-free asset ![[J] Portfolio Management - 图14](/uploads/projects/jianzhou@enxqsv/5234cf607b5e4bea3455cb627ad93ad2.svg)
风险资产A+无风险资产B
![[J] Portfolio Management - 图15](/uploads/projects/jianzhou@enxqsv/6a608359439c1955eca563f6377056c7.svg)
![[J] Portfolio Management - 图16](/uploads/projects/jianzhou@enxqsv/08960e77c69f94214d554f3072dd025b.svg)
![[J] Portfolio Management - 图17](/uploads/projects/jianzhou@enxqsv/642d0ae367f40fe6527bca405cd3ad46.svg)
Capital Allocation Line: 结合三个方程, 在E(R)-σ空间可得到一条直线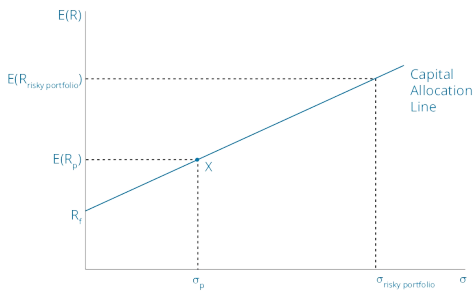
将无差异曲线与CAL结合: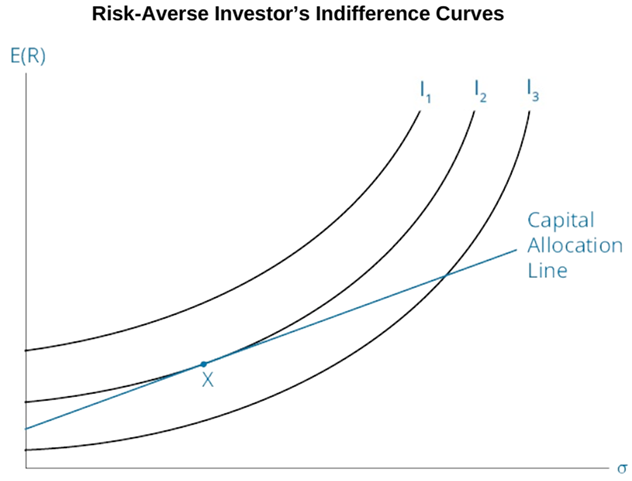
I, I, I代表的为同一investor的无差异曲线(在各自的曲线上,所有点都是等价的)
无风险资产B的收益期望一般是固定的
在市场中找到一个资产组合A,使其CAL与投资者的无差异曲线相切,切点X为optimal portfolio
rationale: ·1· preference: I>I>I ·2· 寻找与CAL能够有交点的最靠上的无差异曲线➡切线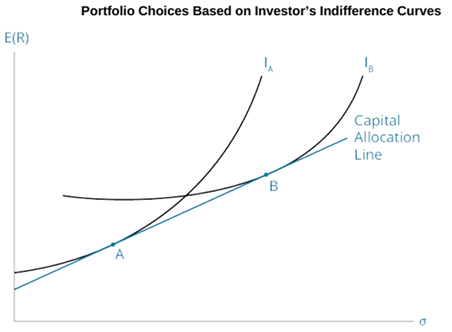
风险厌恶程度:A>B. 在高风险区间,B可以接受较小的期望收益
*为什么有交点:若B在各个风险区间的容忍程度都高于A,那A将被逐出市场(个人理解)![[J] Portfolio Management - 图21](/uploads/projects/jianzhou@enxqsv/2c0bfe8c7a36af0818f70f615d67eba1.svg)
![[J] Portfolio Management - 图22](/uploads/projects/jianzhou@enxqsv/efcae7ad6e1e642363227680227b14ca.svg)
![[J] Portfolio Management - 图23](/uploads/projects/jianzhou@enxqsv/7a037ffb07f01050f1524b6d2ba88712.svg)
R53 Portfolio Risk and Return: Part II
a describe the implications of combining a risk-free asset with a portfolio of risky assets;
The risk (standard deviation of returns) and expected return of portfolios with varying weights in the risk-free asset and a risky portfolio can be plotted as a line thatnbegins at the risk-free rate of return and extends through the risky portfolio. 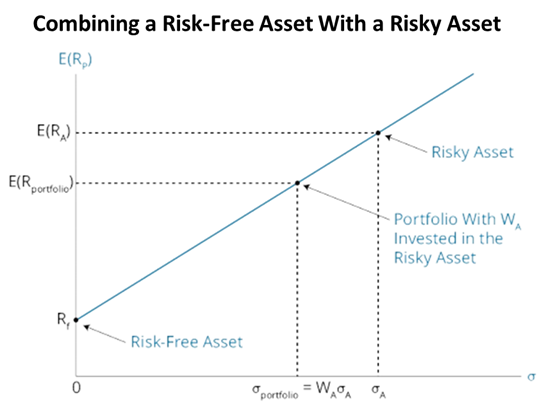
b explain the capital allocation line (CAL) and the capital market line (CML);
capital allocation line (CAL): line of possible portfolio risk and return combinations given the risk-free rate and the risk and return of a portfolio of risky assets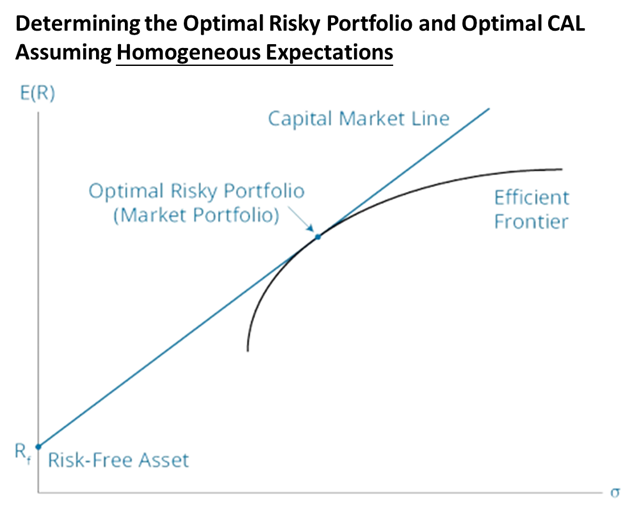
market portfolio:
capital market line (CML): optimal CAL for all investors under the assumption of homogeneous expectations
![[J] Portfolio Management - 图26](/uploads/projects/jianzhou@enxqsv/acefdcf994294355c6f538792bb363f1.svg)
<br />⬆ _**one unit of market risk premium**_ in additional return for _**one unit of market risk, σ****M**_<br />**market risk premium**: difference between the expected return on the market and the risk-free rate<br />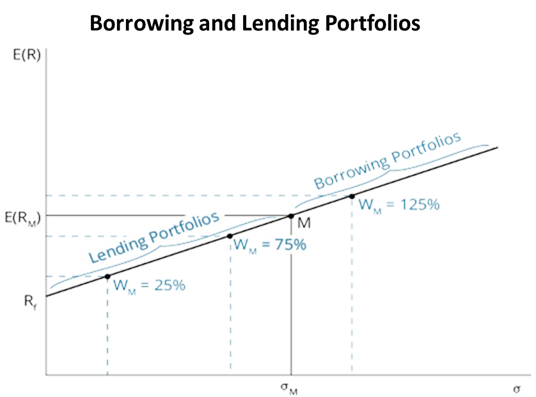<br />**passive investment strategy**: invest in an index of risky assets that serves as a proxy for the market portfolio and allocate a portion of their investable assets to a risk-free asset, such as short-term government securities<br />**active portfolio management**: invest more than the market weights in securities that they believe are undervalued and less than the market weights in securities which they believe are overvalued
c explain systematic and nonsystematic risk, including why an investor should not expect to receive additional return for bearing nonsystematic risk;
total risk = systematic risk + unsystematic risk
unsystematic risk: risk that CAN be eliminated by diversification. aka. unique, diversifiable, or firm-specific risk
systematic risk: risk that CANNOT be eliminated by diversification. aka. nondiversifiable risk or market risk
as you increase the number of stocks in a portfolio, the portfolio’s risk falls toward the level of market risk. 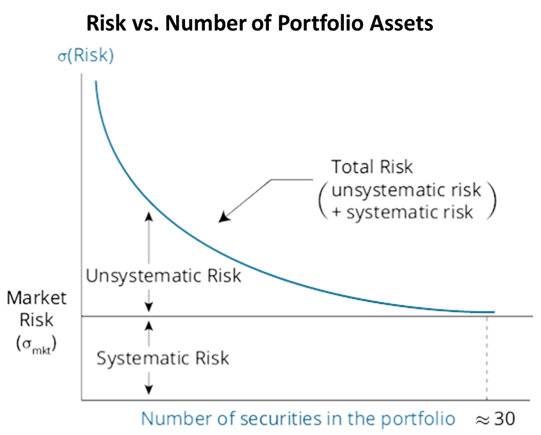
随着投资组合中证券数量增加 投资组合的风险逐渐接近于market risk 单位证券数量增加带来的风险降低效果逐渐减少 证券数量超过30时,总风险约等于系统风险
equilibrium security returns depend on a stock’s or a portfolio’s systematic risk, not its total risk as measured by SD
假设:分散化的成本≈0 ⋙ 能够通过分散化加以降低的风险不需要额外收益来补偿*⋙风险最高证券的期望收益不一定最高
⬆否则存在套利 ⬆因为存在非系统风险(消除该风险的成本为零)
d explain return generating models (including the market model) and their uses;
return generating models: used to estimate returns on risky securities based on specific factors
factors that explain security returns can be classified as macroeconomic, fundamental, and statistical factors
multifactor models
general form![[J] Portfolio Management - 图28](/uploads/projects/jianzhou@enxqsv/8afc6ddc8e9a636a51604b6090302684.svg)
β: factor sensitivity, or factor loading
Fama and French multifactor models: firm size, firm book value to market value ratio, return on the market portfolio minus the risk-free rate
single-factor model![[J] Portfolio Management - 图29](/uploads/projects/jianzhou@enxqsv/f8f202e3bc580b6113793f2a90252d8b.svg)
*market model: A simplified form of a single-index model, used to estimate a security’s (or portfolio’s) beta and to estimate a security’s abnormal return (return above its expected return) based on the actual market return.![[J] Portfolio Management - 图30](/uploads/projects/jianzhou@enxqsv/a706dff6bcf75a043cb308f75a88df4a.svg)
Ri=return on asset i; Rm=market return; βi=slope coefficient; αi=intercept; ei=abnormal return on asset i
e calculate and interpret beta;
beta: the sensitivity of an asset’s return to the return on the market index in the context of the market model ![[J] Portfolio Management - 图31](/uploads/projects/jianzhou@enxqsv/eae0644a7871c229a68f4466ed19abac.svg)
security characteristic line: 通过对historical data进行回归得到的方程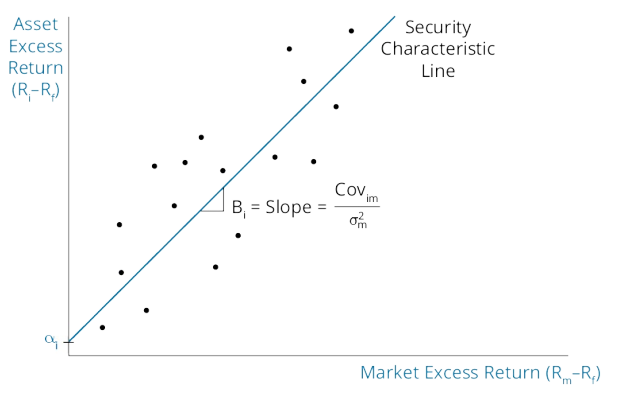
f explain the capital asset pricing model (CAPM), including its assumptions, and the security market line (SML);
security market line (SML): the relationship between risk and return for individual assets using Covi,mkt as measure of systematic risk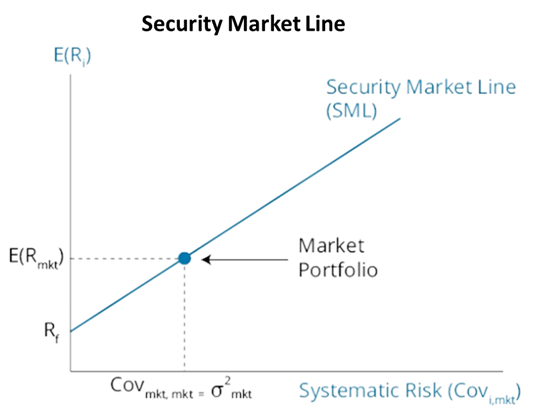
![[J] Portfolio Management - 图34](/uploads/projects/jianzhou@enxqsv/05efbdec247292c22cb2611321657e0b.svg)
![[J] Portfolio Management - 图35](/uploads/projects/jianzhou@enxqsv/c702ba8411dc3ce280dedc1f92352b27.svg)
capital asset pricing model (CAPM):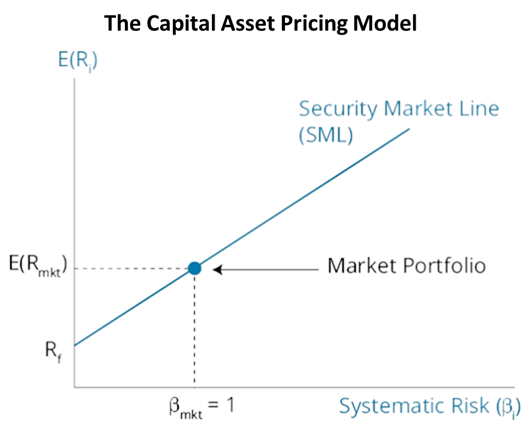
![[J] Portfolio Management - 图37](/uploads/projects/jianzhou@enxqsv/485f387f2a4a30fe9a2388ed4674634f.svg)
R**f: risk-free rate ; βi[E(Rmkt)-Rf]: beta-adjusted market risk premium
assumptions of the CAPM
Risk aversion. To accept a greater degree of risk, investors require a higher expected return
Utility maximizing investors. Investors choose the portfolio, based on their individual preferences, with the risk and return combination that maximizes their (expected) utility.
Frictionless markets. There are no taxes, transaction costs, or other impediments to trading.
One-period horizon. All investors have the same one-period time horizon.
Homogeneous expectations. All investors have the same expectations for assets’ expected returns, standard deviation of returns, and returns correlations between assets.
Divisible assets. All investments are infinitely divisible.
Competitive markets. Investors take the market price as given and no investor can influence prices with their trades.
Comparing the CML and the SML![[J] Portfolio Management - 图38](/uploads/projects/jianzhou@enxqsv/94cb759945da2e436d928b05dcdd71ea.svg)
CML uses total risk = σ on the x-axis. ⋙only efficient portfolios will plot on the CML
SML uses beta (systematic risk) on the x-axis⋙all properly priced securities and portfolios of securities will plot on the SML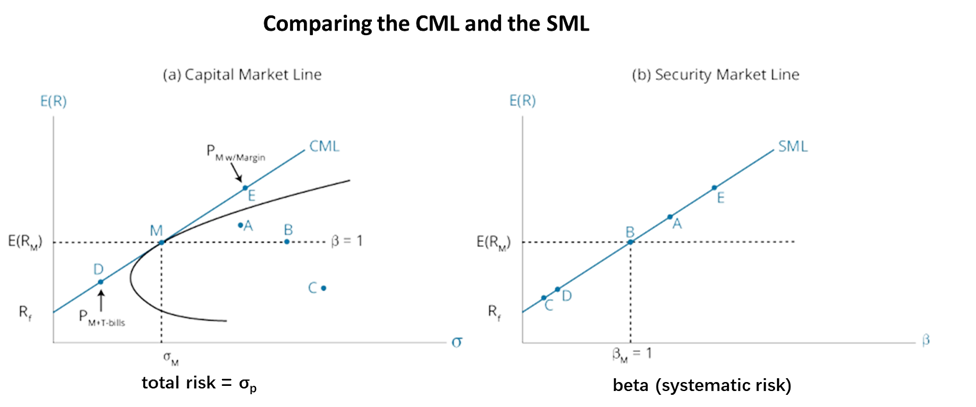
Portfolios that are not well diversified (efficient) plot inside the efficient frontier 在有效边界以内的资产没有被分散化不充分
According to the CAPM, the expected returns on all portfolios, well diversified or not, are determined by their systematic risk.
g calculate and interpret the expected return of an asset using the CAPM;
h describe and demonstrate applications of the CAPM and the SML;
i calculate and interpret the Sharpe ratio, Treynor ratio, M, and Jensen’s alpha.
performance evaluation: analysis of the risk and return of the portfolio (active manager’s portfolio)
attribution analysis: analysis of the sources of returns differences between active portfolio returns and those of a passive benchmark portfolio (part of performance evaluation).
‘Success in active portfolio management cannot be determined simply by comparing portfolio returns to benchmark portfolio returns; the risk taken to achieve returns must also be considered.’
Sharpe Ratio: portfolio’s excess returns per unit of total portfolio risk.
Higher Sharpe ratios indicate better risk-adjusted portfolio performance.
Sharpe ratio as an ex ante (before the fact) measure, using the expected values of portfolio returns and standard deviation.
![[J] Portfolio Management - 图40](/uploads/projects/jianzhou@enxqsv/bc4f5a07ce19e73d4434cdefd7ed09ba.svg)
意义:单位风险(以标准差计)获得的超过超额预期收益(与无风险收益相比)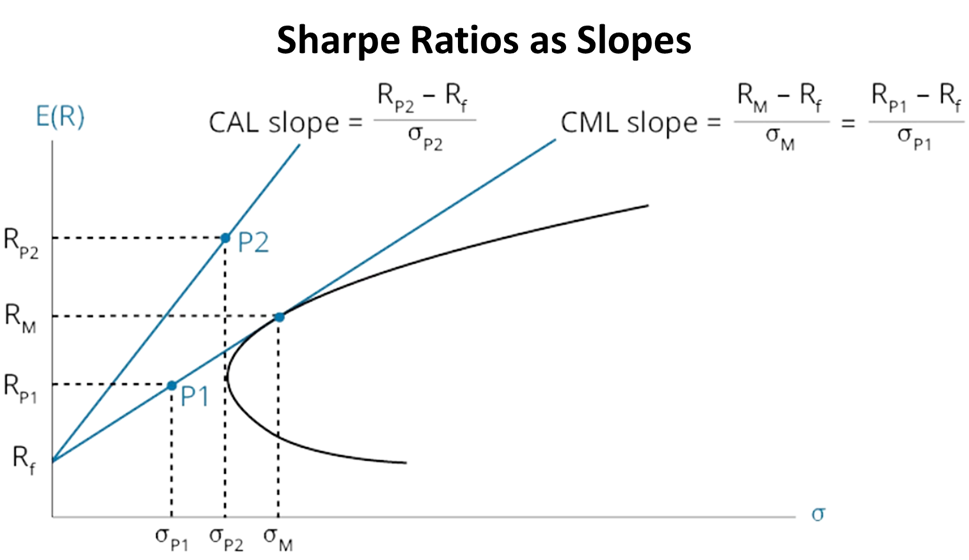
M-Square, M: produces the same portfolio rankings as the Sharpe ratio but is stated in percentage terms![[J] Portfolio Management - 图42](/uploads/projects/jianzhou@enxqsv/a2ce1673e605c84a08aa6dcb60a7d914.svg)
意义:市场组合风险下,资产组合P与市场组合收益率的差值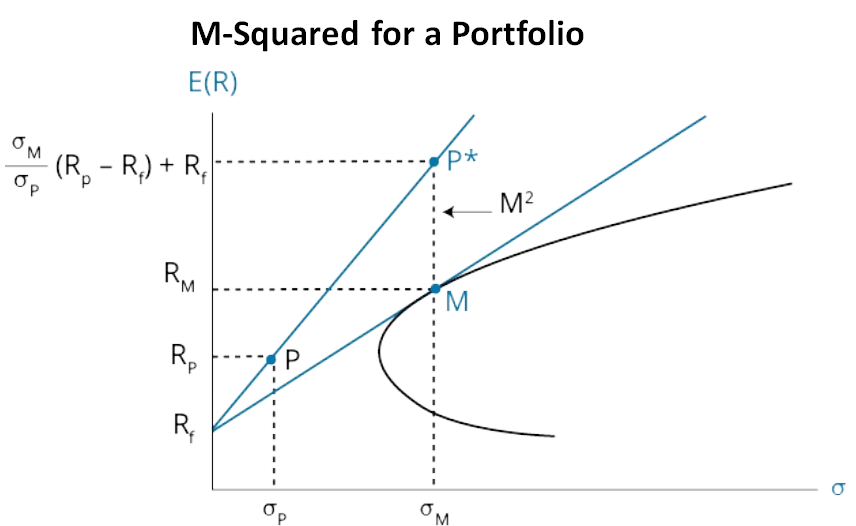
risk-adjusted performance (RAP)
measures of portfolio performance based on systematic (beta) risk
Treynor measure![[J] Portfolio Management - 图44](/uploads/projects/jianzhou@enxqsv/7895f30e66f58068a1343fe1b0c410de.svg)
意义:单位资产组合贝塔获得的超过无风险资产的收益
Jensen’s alpha
![[J] Portfolio Management - 图45](/uploads/projects/jianzhou@enxqsv/06a26d1265282d1f19dbc6d4d70bc693.svg)
相同贝塔下,资产组合P与无风险收益之间的差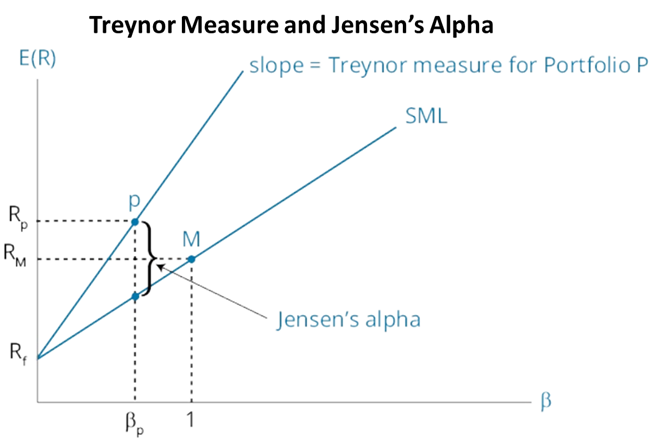
SS19 Portfolio Management (2)
R54 Basics of Portfolio Planning and Construction
a describe the reasons for a written investment policy statement (IPS);
investment policy statement
investor’s goals in terms of risk and return
expectations in terms of returns must be compatible with investor’s tolerance for risk
*very unlikely to produce a good result for a client without understanding that client’s needs, circumstances, and constraints
b describe the major components of an IPS;
- Description of Client circumstances, situation, and investment objectives.
- Statement of the Purpose of the IPS.
- Statement of Duties and Responsibilities of investment manager, custodian of assets, and the client.
- Procedures to update IPS and to respond to various possible situations.
- Investment Objectives derived from communications with the client.
- Investment **Constraints** that must be considered in the plan
- Investment Guidelines such as how the policy will be executed, asset types permitted, and leverage to be used.
- Evaluation of Performance, the benchmark portfolio for evaluating investment performance, and other information on evaluation of investment results.
- Appendices containing information on strategic (baseline) asset allocation and permitted deviations from policy portfolio allocations, as well as how and when the portfolio allocations should be rebalanced.
c: Describe risk and return objectives and how they may be developed for a client
- risk & return objective
absolute risk objective
relative risk objectives
- how developed
must make sure that the stated risk and return objectives are compatible
d distinguish between the willingness and the ability (capacity) to take risk in analyzing an investor’s financial risk tolerance;
- ability to bear risk: depends on financial circumstances
- willingness to bear risk: investor’s attitudes and beliefs about investments (various asset types) | ability=willingness | no real problem | | —- | —- | | ability<willingness | advise basing on ability | | ability>willingness | *建议投资者提升风险水平,但最终取决于client’s attitude |
e describe the investment constraints of liquidity, time horizon, tax concerns, legal and regulatory factors, and unique circumstances and their implications for the choice of portfolio assets;
Investment constraints: the investor’s liquidity needs, time horizon, tax considerations, legal and regulatory constraints, and unique needs and preferences
Liquidity: the ability to turn investment assets into spendable cash in a short period of time without having to make significant price concessions to do so
Time horizon: the longer an investor’s time horizon, the more risk and less liquidity the investor can accept in the portfolio.
Tax situation:
Legal and regulatory:
Unique circumstances:
f explain the specification of asset classes in relation to asset allocation;
strategic asset allocation: specifies the percentage allocations to the included asset classes.
g describe the principles of portfolio construction and the role of asset allocation in relation to the IPS;
tactical asset allocation
security selection: deviations from index weights on individual securities within an asset class
risk budgeting: sets an overall risk limit for the portfolio and budgets (allocates) a portion of the permitted risk to the systematic risk of the strategic asset allocation, the risk from tactical asset allocation, and the risk from security selection
core-satellite approach: invests the majority, or core, portion of the portfolio in passively managed indexes and invests a smaller, or satellite, portion in active strategies.
h describe how environmental, social, and governance (ESG) considerations may be integrated into portfolio planning and construction.
negative screening: excluding specific companies or industries from consideration for the portfolio based on ESG factors
positive screening/best-in-class: invest in companies that have positive ESG practices.
thematic investing: investing in sectors or companies in order to promote specific ESG-related goals, may require an investment manager who specializes in this style of investing.
engagement/active ownership investing: using share ownership as a platform to promote improved ESG practices at a company, using share voting rights and by influencing management or board members.
R55 Introduction to Risk Management
a define risk management;
risk management :
1) identify the risk tolerance of the organization
2) identify and measure the risks that the organization faces
3) modify and monitor these risks
b describe features of a risk management framework;
- Establishing processes and policies for risk governance.
- Determining the organization’s risk tolerance.
- Identifying and measuring existing risks.
- Managing and mitigating risks to achieve the optimal bundle of risks.
- Monitoring risk exposures over time.
- Communicating across the organization.
- Performing strategic risk analysis
c define risk governance and describe elements of effective risk governance;
risk governance: senior management’s determination of the risk tolerance of the organization, the elements of its optimal risk exposure strategy, and the framework for oversight of the risk management function.d explain how risk tolerance affects risk management;
risk tolerance: setting the overall risk exposure the organization will take by identifying the risks the firm can effectively take and the risks that the organization should reduce or avoid.
e describe risk budgeting and its role in risk governance;
risk budgeting: the process of allocating firm resources to assets (or investments) by considering their various risk characteristics and how they combine to meet the organization’s risk tolerance.
f identify financial and non-financial sources of risk and describe how they may interact;
Financial risks: arise from exposure to financial markets
Credit risk: the uncertainty about whether the counterparty to a transaction will fulfill its contractual obligations
Liquidity risk: the risk of loss when selling an asset at a time when market conditions make the sales price less than the underlying fair value of the asset.
Market risk: the uncertainty about market prices of assets (stocks, commodities, and currencies) and interest rates
Non-financial risks: arise from the operations of the organization and from sources external to the organization
Operational risk: human error, faulty organizational processes, inadequate security, or business interruptions will result in losses.
cyber risk: disruptions of an organization’s information technology
Solvency risk: the organization will be unable to continue to operate because it has run out of cash
Regulatory risk: regulatory environment will change, imposing costs on the firm or restricting its activities
Governmental or political risk (including tax risk): political actions outside a specific regulatory framework, such as increases in tax rates, will impose significant costs on an organization.
Legal risk: the uncertainty about the organization’s exposure to future legal action.
Model risk: asset valuations based on the organization’s analytical models are incorrect.
Tail risk: extreme events (those in the tails of the distribution of outcomes) are more likely than the organization’s analysis indicates, especially from incorrectly concluding that the distribution of outcomes is normal.
Accounting risk: the organization’s accounting policies and estimates are judged to be incorrect
individuals
mortality risk: risk of death prior to providing for their families’ future needs
longevity risk: the risk of living longer than anticipated so that assets run out
g describe methods for measuring and modifying risk exposures and factors to consider in choosing among the methods.
Measures of risk for specific asset types
Standard deviation a measure of the volatility of asset prices and interest rates
Beta** measures the market risk of equity securities and portfolios of equity securities.
Duration is a measure of the price sensitivity of debt securities to changes in interest rates.
Derivatives risks (the Greeks) include:
Delta. sensitivity of derivatives values to the price of the underlying asset.
Gamma. sensitivity of delta to changes in the price of the underlying asset.
Vega. sensitivity of derivatives values to the volatility of the price of the underlying asset.
Rho**. sensitivity of derivatives values to changes in the risk-free rate.
Tail risk: the uncertainty about the probability of extreme (negative) outcomes.
Value at risk (VaR) is the minimum loss over a period that will occur with a specific probability.
Conditional VaR (CVaR): the expected value of a loss, given that the loss exceeds a minimum amount.
Stress testing: examines the effects of a specific (usually extreme) change in a key variable such as an interest rate or exchange rate.
Scenario analysis: a similar what-if analysis of expected loss but incorporates changes in multiple inputs.
self-insurance: an organization has decided to bear a risk
risk transfer: another party takes on the risk
surety bond: an insurance company has agreed to make a payment if a third party fails to perform under the terms of a contract or agreement with the organization
fidelity bonds: Insurers will pay for losses that result from employee theft or misconduct. 忠实保险契约
risk shifting: a way to change the distribution of possible outcomes, accomplished primarily with derivative contracts
R56 Technical Analysis
a explain principles of technical analysis, its applications, and its underlying assumptions;
Technical analysis: the study of collective market sentiment, as expressed in buying and selling of assets
b describe the construction of different types of technical analysis charts and interpret them;
Line charts
Bar charts
Candlestick charts
Point-and-figure charts
Volume charts
Relative strength analysis
c explain uses of trend, support, resistance lines, and change in polarity;
uptrend: prices are consistently reaching higher highs and retracing to higher lows
downtrend: prices are consistently declining to lower lows and retracing to lower highs
trendline:
breakout:
breakdown:
support level:
resistance level:
change in polarity:
d describe common chart patterns;
Reversal patterns
head-and-shoulders pattern
Double top
triple top
inverse head-and-shoulders
double bottom
triple bottom
Continuation patterns
Triangles
Rectangles
Flags
pennants
e describe common technical analysis indicators (price-based, momentum oscillators, sentiment, and flow of funds);
Moving average lines
Bollinger bands
overbought market
oversold market
contrarian strategy
f explain how technical analysts use cycles;
g describe the key tenets of Elliott Wave Theory and the importance of Fibonacci numbers;
h describe intermarket analysis as it relates to technical analysis and asset allocation.
R57 Fintech in Investment Management
a describe “fintech;”
Fintech: developments in technology that can be applied to the financial services industry.
fintech companies: companies that develop technologies for the finance industry
b describe Big Data, artificial intelligence, and machine learning;
- big data
Big Data: potentially useful information that is generated in the economy (from traditional and non-traditional sources)
volume velocity *variety.
- artifical intelligence
Artificial intelligence: computer systems that can be programmed to simulate human cognition.
e.g. Neural networks
- machine learning
Machine learning is programming that gives a computer system the ability to improve its performance of a task over time and is often used to detect patterns in large sets of data.
c describe fintech applications to investment management;
text analytics, natural language processing, risk analysis, algorithmic trading, and robo-advisory services.
- Text analytics
Text analytics: analyzing unstructured data in text or voice forms.
Natural language processing: use of computers and artificial intelligence to interpret human language.
- Algorithmic trading
Algorithmic trading refers to computerized securities trading based on predetermined rules.
- Robo-advisors
Robo-advisors:** *online platforms that provide automated investment advice based on a customer’s answers to survey questions.
low cost to customers.
A disadvantage is that the reasoning behind their recommendations might not be apparent.
d describe financial applications of distributed ledger technology.
A distributed ledger is a database that is shared on a network, with a consensus mechanism so that each participant has an identical copy of the ledger.
A cryptocurrency is an electronic medium of exchange that allows network participants in a distributed ledger to engage in real-time transactions without a financial intermediary.
Potential financial applications of distributed ledger technology include smart contracts, tokenization, and more efficient post-trade clearing and settlement.

若有收获,就点个赞吧
0 人点赞
