- 1、Define Hypothesis
- 2、Test-statistic(检验统计量,z-statistic)
- 3、Critical value(关键值、即分位数)
- 4、Decision rule
- 5、Confidence Intervals 和 Hypothesis Tests 的关系
- 6、假设检验:对均值、方差进行检验的总结
- 7、p-value Method
- 8、Type-1 error 和 Type-2 error【必考】
- 9、parametric tests、nonparametric tests
- 10、例题
- 假设检验:先假设一个结果(预估一个结果),再进行检验
- 有点类似于反证法。
- 步骤(流程):
- Step-1:State null and alternative hypotheses
- Step-2:Identify the test statistic(检验统计量)
- Step-3:Select a level of significance
- Step-4:Formulate a decision rule
- Step-5:Take a sample, arrive at decision
- Do not reject
- Reject
步骤流程(version-2):
A htpothesis is a statement about one or more population parameters.
- For population, not sample
- Null hypothesis(原假设):the fact we suspect and want to reject
- Alternative hypothesis(备择假设):we want to assess
- 原假设与备择假设为互补关系。
one-tailed/two-tailed tests of Hypothesis
计算公式


- 公式由来:
- 现在是想用
 估计总体均值
 ,要判断落在区间里还是区间外,需要查表。
 - 由中心极限定理可知
 ,将其进行标准化,可得:
 ,此时即符合
  ,标准化的结果即作为检验统计量。最终基于该统计量即可判断其落在区间里还是区间外。
- 其中
 代入原假设中设定的数值。
- 其中
- 现在是想用
- 公式由来:
- Test statistic follows Normal、T、Chi Square or F distributions
- 检验统计量服从各种分布(检验统计量也是一个随机变量)

 是个随机变量,因此检验统计量(
 )也是随机变量
- Test statistic has formula.(检验统计量是通过计算得到的)
- Calculate it with the sample data.
- We should emphasize Test Statistic is calculated by ourselves not from the table.
This is the general formula but only for Z and T distribution.
计算好检验统计量后,需要判断该统计量是落在区间里还是区间外,就需要将其与关键值(
 值)进行对比。
- 关键值(
 值)的影响因素
- 与显著性水平(
 )有关
)有关- 由显著性水平可确定置信度(
 ),因此确定区间大小,确定
 值
值
- 由显著性水平可确定置信度(
- 之前讲过:相同的显著性水平(
 )下,T 分布的置信区间更宽;因此,不同分布(查不同的表)的
 值也不同。
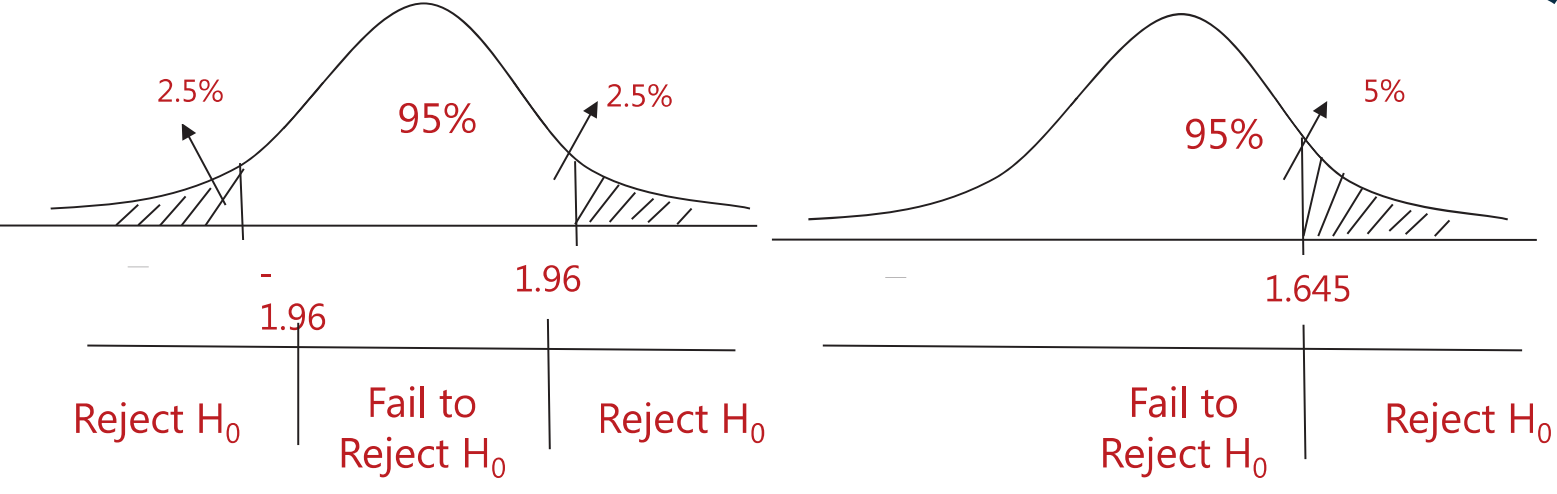
值也不同。 - 与单尾或双尾相关:
- 双尾
 (每个尾巴的面积为
 ),置信度为
 ,对应的
,对应的
- 单尾
 (一个尾巴的面积就达到
 ),则对应双尾情况下显著性水平为
 时对应的
时对应的 值,此时置信度为
 ,对应的
,对应的
- Under given one tailed or two tailed assumption, critical value is determined solely by the significance level.
- 双尾
- 与显著性水平(
Found in the Z、T、Chi Square or F distribution tables,not calculated by us.
Critical value method
- Significance Level?
- Two tailed or one tailed test?
- Reject region? Critical Value under the condition
- Compare the Test Statistic and Critical Value
- Reject
 if
if 
- Fail to reject
 if
if 
 和
和
 )还是方差(
 )进行检验(两者的分布是不一样的)
 (显著性水平),实际应用中自己拟定,考试中一般会给出
 找到关键值(
 )
)


 ,
,
 ,
,
 ,
,
 ),则拒绝域在右边;如果备择假设是小于号(
 ),则拒绝域在左边。

 值)是通过查表得到。
Statement:
Confidence Interval = sample statistic
 critical value * standard error
- Center of Interval = sample statistic
Length of Interval = 2 critical value standard error
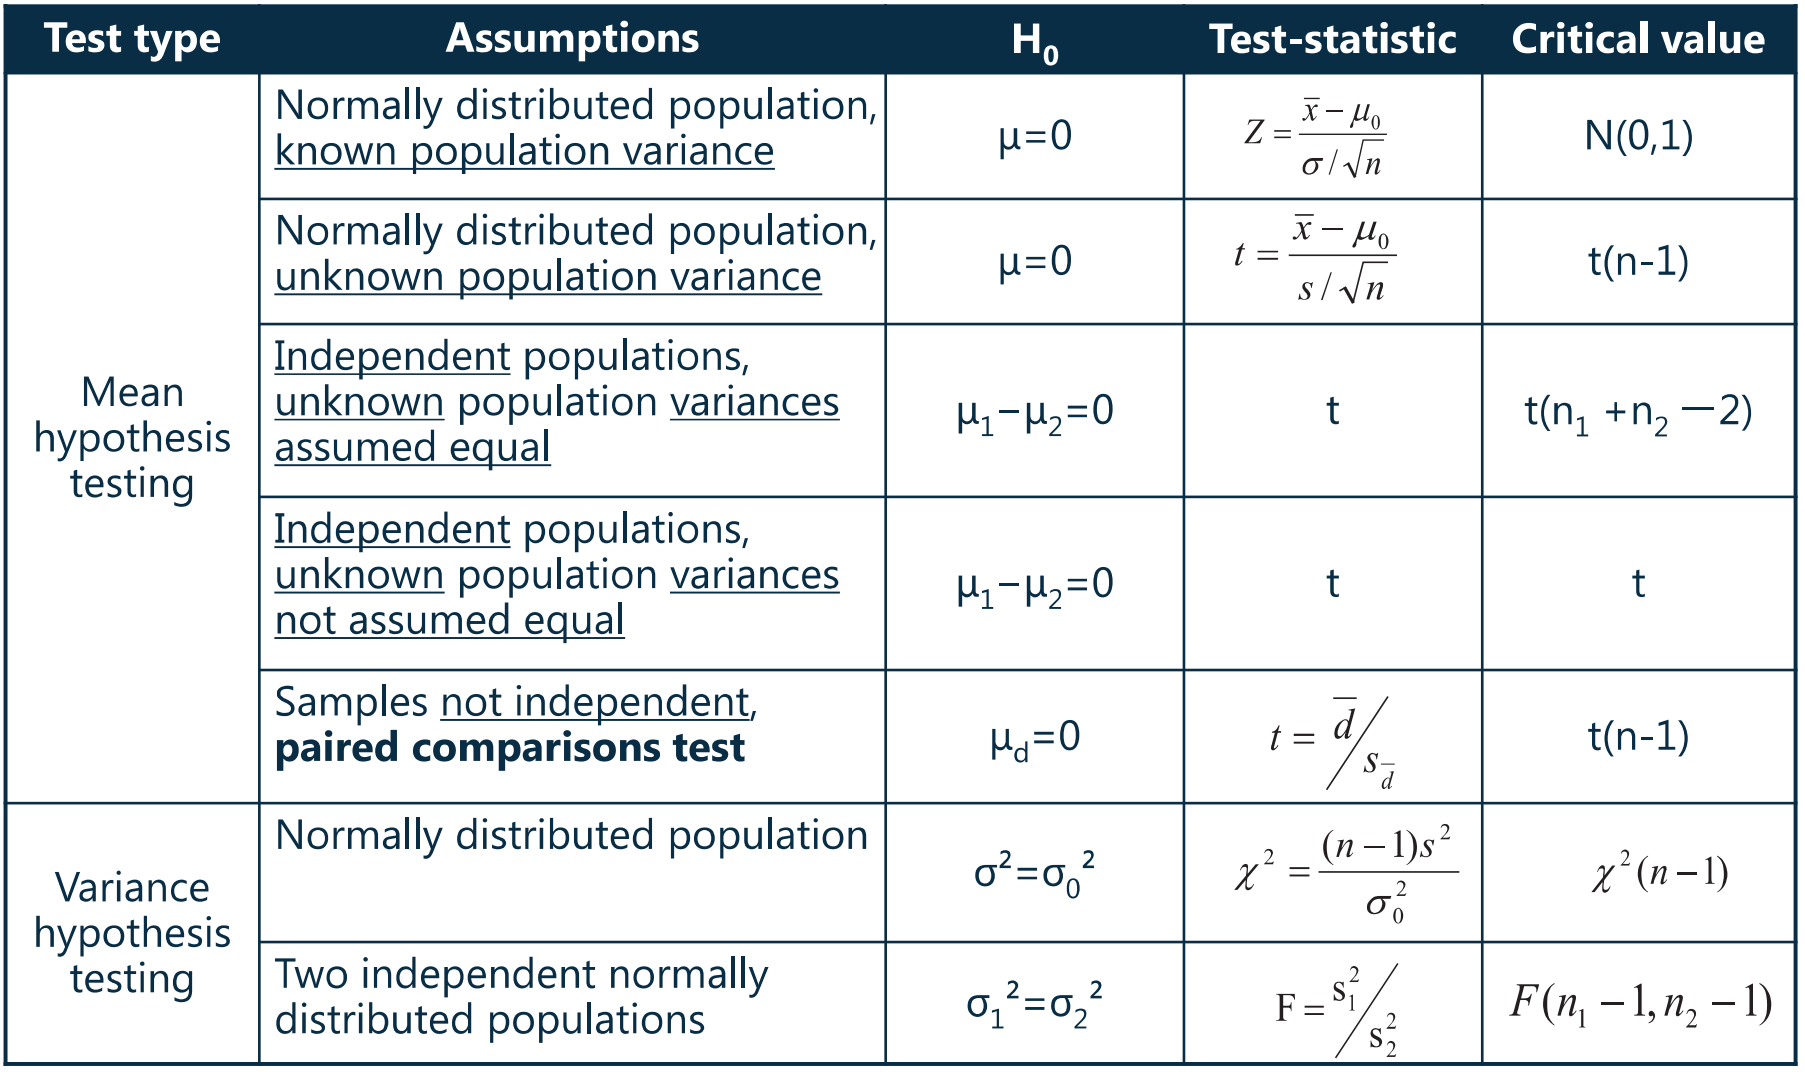
6、假设检验:对均值、方差进行检验的总结
对均值(
 )还是方差(
 )进行检验时,两者的分布是不一样的
- 以下表格只需要知道对均值、方差进行检验时使用对应的分布即可
- 对
 进行检验
进行检验- 一个总体
 (如检验
(如检验 )
)- T 分布或 Z 分布(正太分布)
- 方差已知用 Z ,方差未知用 T,非正太、总体小样本不可估计
- 当样本足够大时,无论是方差已知还是未知,都可以用 Z
- 对应的检验统计量即之前讲过的 test-statistic 相关计算【必须掌握】
- T 分布或 Z 分布(正太分布)
- 两个总体
 (如检验
(如检验 )
)- 两个总体之间相互独立:T 分布
- 两个总体之间不相互独立:使用 paired comparisons test(成对数检验,分成一段一段检验)
- 对应的检验统计量为:

- 样本的标准差与总体的标准差之间的关系:
 (但通常
(但通常 未知时用
未知时用 代替)
代替)
- 样本的标准差与总体的标准差之间的关系:
- 推导(转换为检验
 ):
):- 假设要检验
 ,其中 X 和 Y 之间不相互独立(存在相关性),因此检验时将其分段、成对匹配,并计算每一对的差值
 ,检验
,检验 即可转换为检验
- 此时,对应的检验统计量为

- 假设要检验
- 对应的检验统计量为:
- 一个总体
- 对方差(
 )进行检验
)进行检验- 一个总体
 (如:
(如: ):卡方分布
 - 两个总体
 (如:
(如: ):F 分布
 - 两个分布对应的检验统计量简单了解即可。
- 一个总体


7、p-value Method
- The p-value is the smallest level of significance at which the null hypothesis can be reject.
- 即:p-value 为拒绝原假设的最小显著性水平(
 ),即两端尾巴(如果是单尾,则一端的尾巴)的面积(即为概率,因此取值范围为 0-1)
 - 因此,可以将 p-value 与显著性水平(
 )进行对比,以判断是否拒绝原假设。
- 即:p-value 为拒绝原假设的最小显著性水平(
 :reject
 :do not reject
As p-value decrease, easier to reject
 (p-value 越小越拒绝)
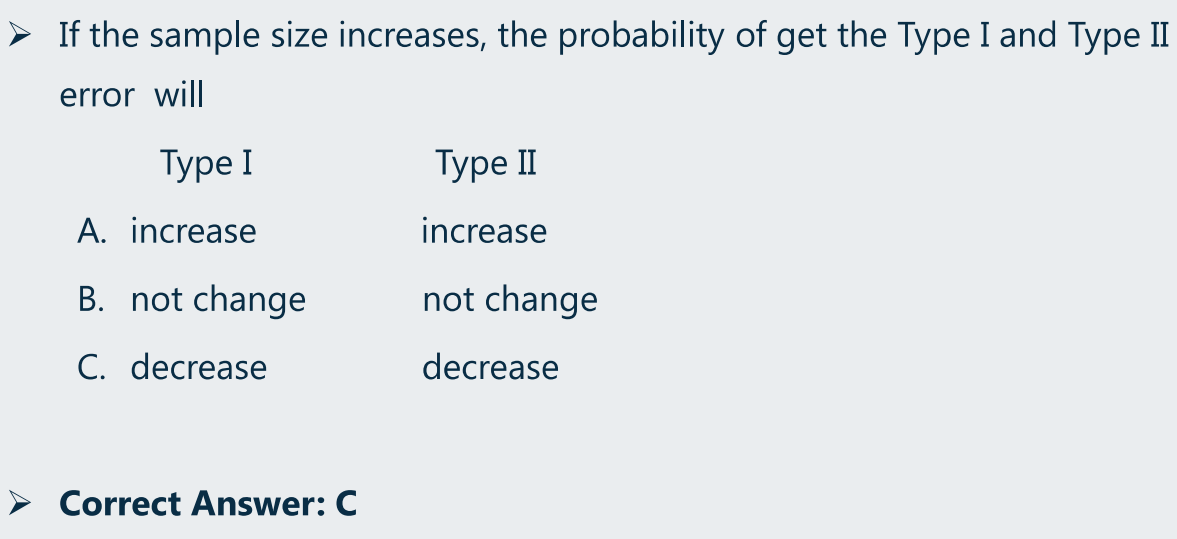
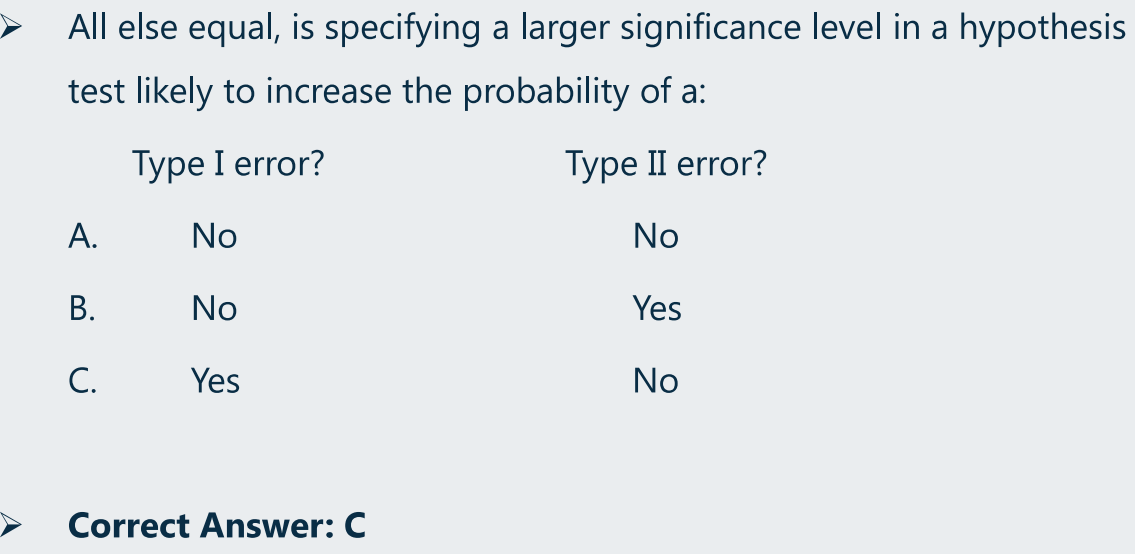
8、Type-1 error 和 Type-2 error【必考】
Type-1 error:reject the null hypothesis when it’s actually true.
- 拒真(错杀好人),原假设正确,但被拒绝掉
- P(Type-1 error) = Significance level
- Significance level(
 ):the probability of making a Type-1 error.
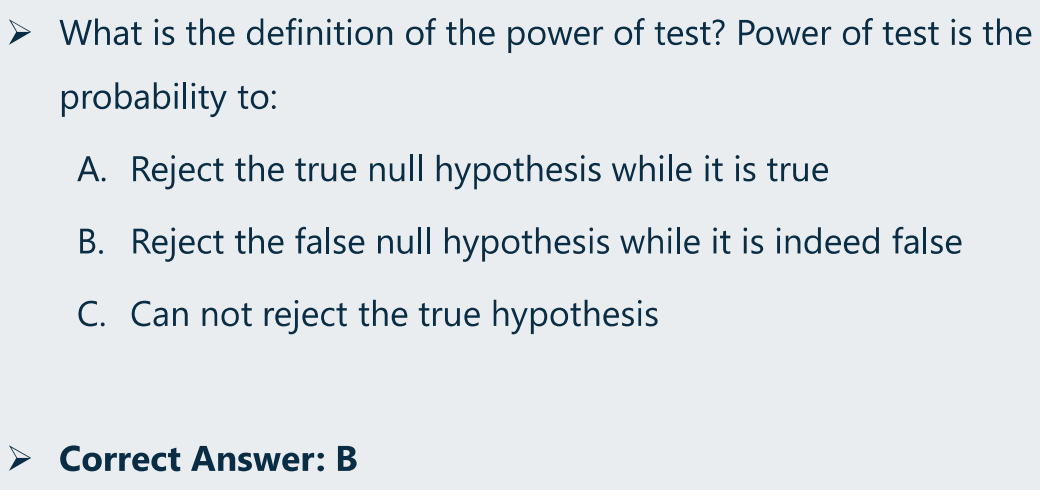
- Type-2 error:fail to reject the null hypothesis when it’s actually false.
- 存伪(放走坏人),原假设错误,但没有被拒绝
- Power of a test(检验的能力):the probability of correctly rejecting the null hypothesis when it is false.
- 即原假设错误、且正好也被拒绝掉的概率(用此来体现检验的能力,因为原假设本身就是想把他拒绝掉的)。
- power of a test + P(Type-2 error) = 1
- 因为“原假设错误、且正好也被拒绝”与“原假设错误、但没有被拒绝”构成了互补关系,两者的概率之和必定位 1。
- 因此:Power of a test = 1 - P(Type-2 error)
- P(Type-1 error) + P(Type-2 error) 是否等于 1?
- 不等于,因为 P(Type-1 error) 不等价于 Power of a test(两者从函数上就体现出了区别),而 P(Type-2 error) 是与 Power of a test(也是概率)之和才为 1。
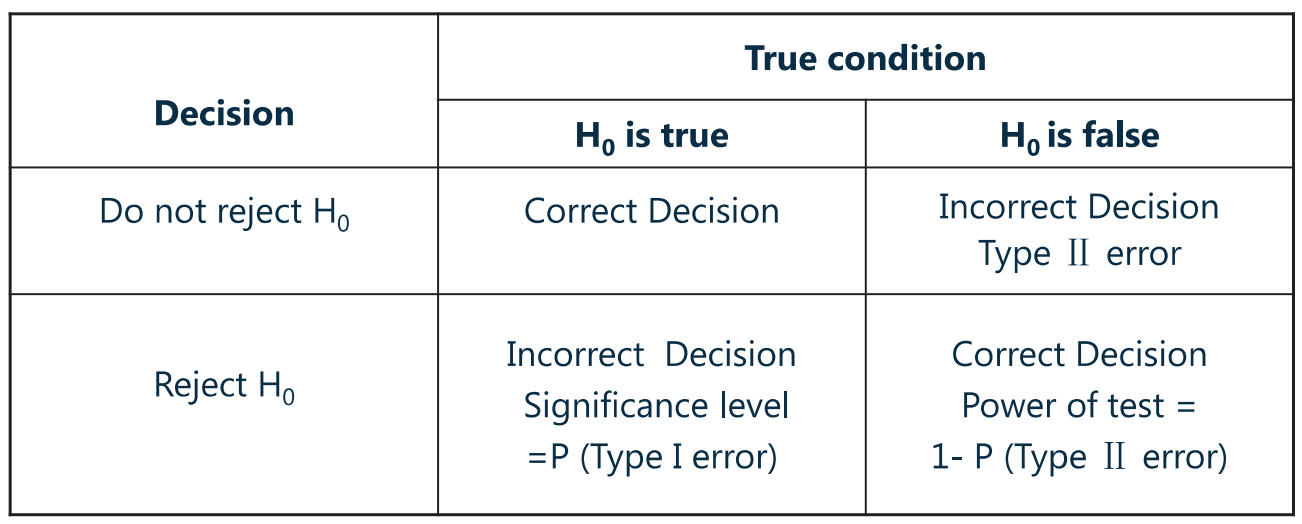
- With other conditions unchanged, either error probability arises at the cost of the other error probability decreasing.
How to reduce both errors?
parametric tests(参数检验)
- Based on specific distributional assumptions for the population
- concerning a parameter of population.
- For example, t-test.
nonparametric tests(非参数检验)
- a nonparametric test either is not concerned with a parameter or makes minimal assumptions about the population from which the sample comes.
- Nonparametric tests are used when:
- data do not meet distributional assumptions.(不满足分布的假设;如非正太、总体小样本的情况下)
- 如:hypothesis test of the mean value for a variable, but the distribution of the variable is not normal and the sample size is small so that neither the t-test nor the z-test are appropriate.
- data are given in ranks.(序数排列)
- the hypothesis we are addressing does not concern a parameter.(检验的不是参数)
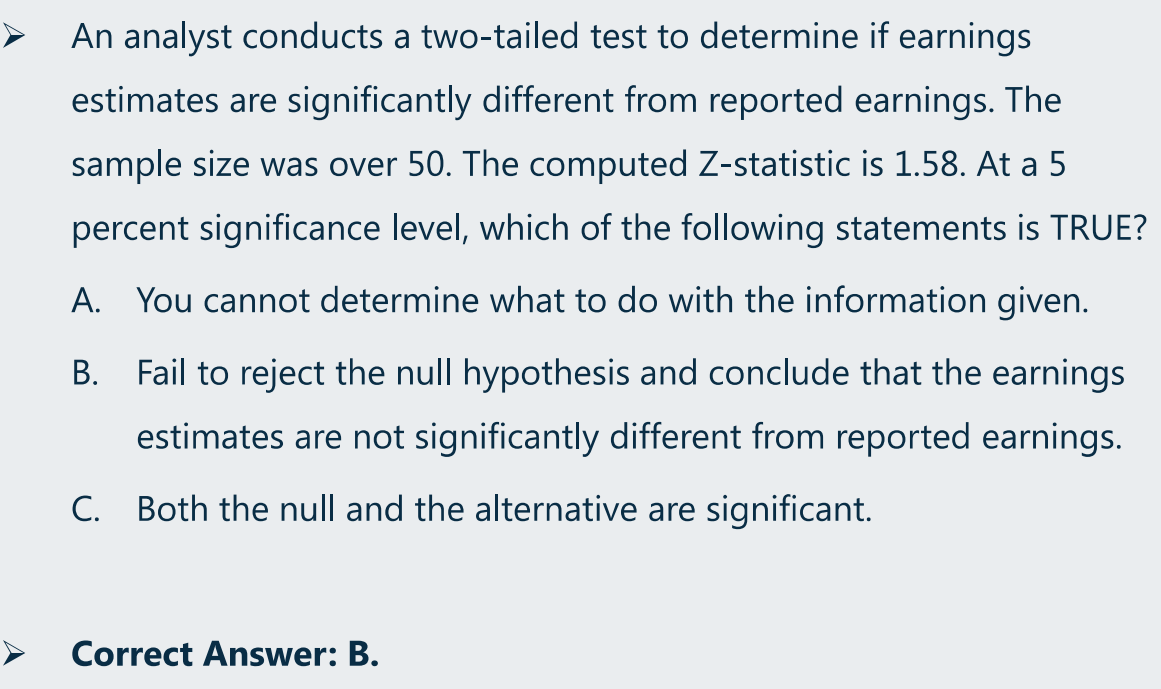
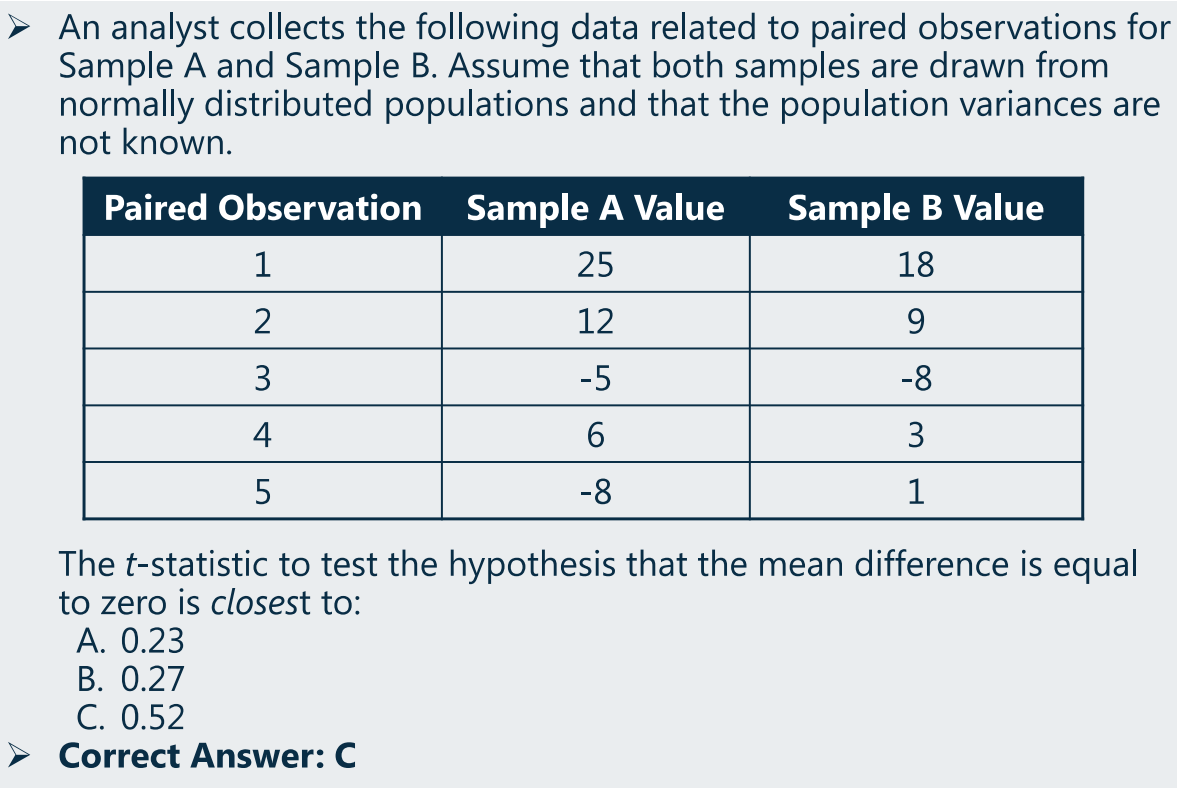
10、例题
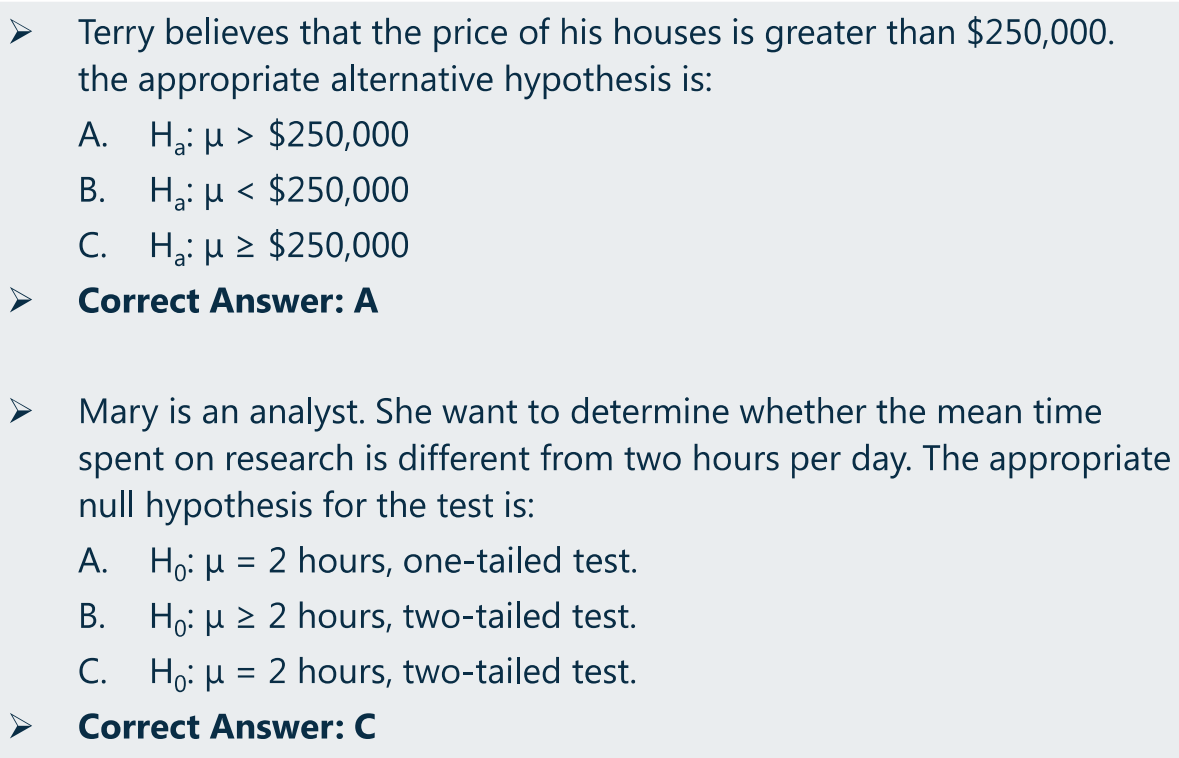
(1)Define Hypothesis
(a)原假设、备择假设
(b)备择假设、原假设
(2)假设检验:流程、拒绝与否的判断
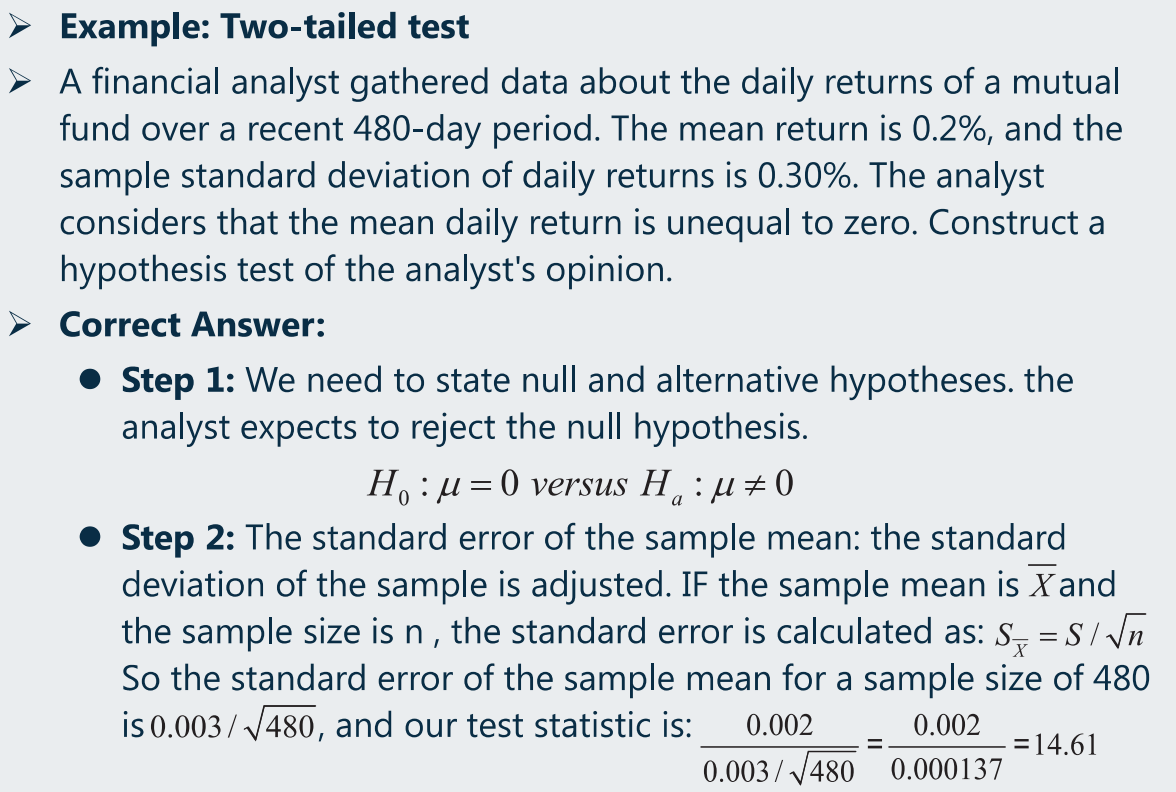
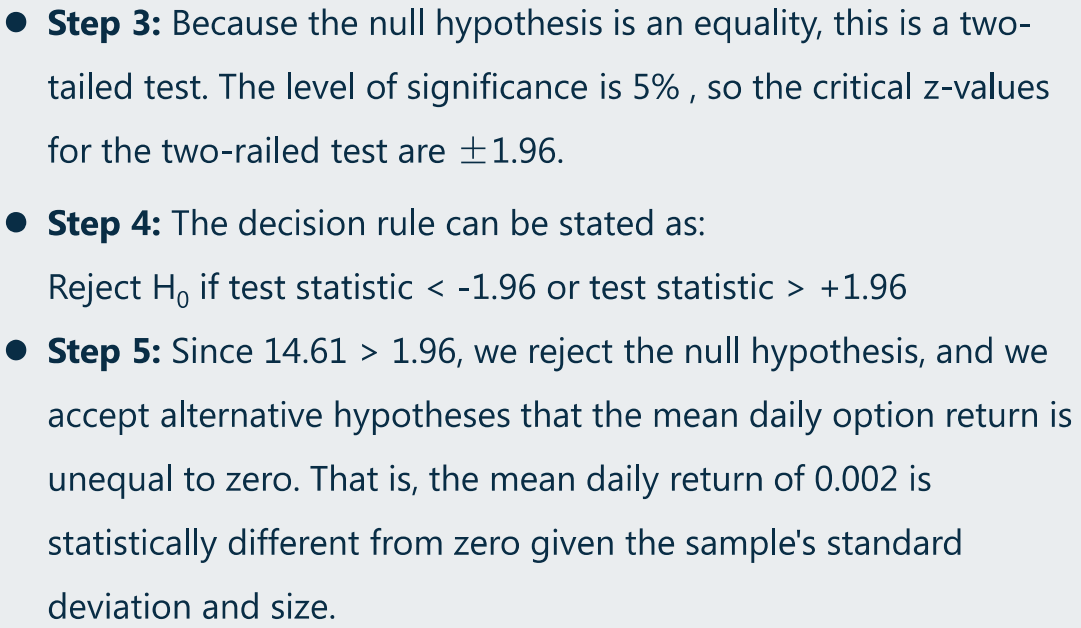
(a)假设检验流程应用(双尾)
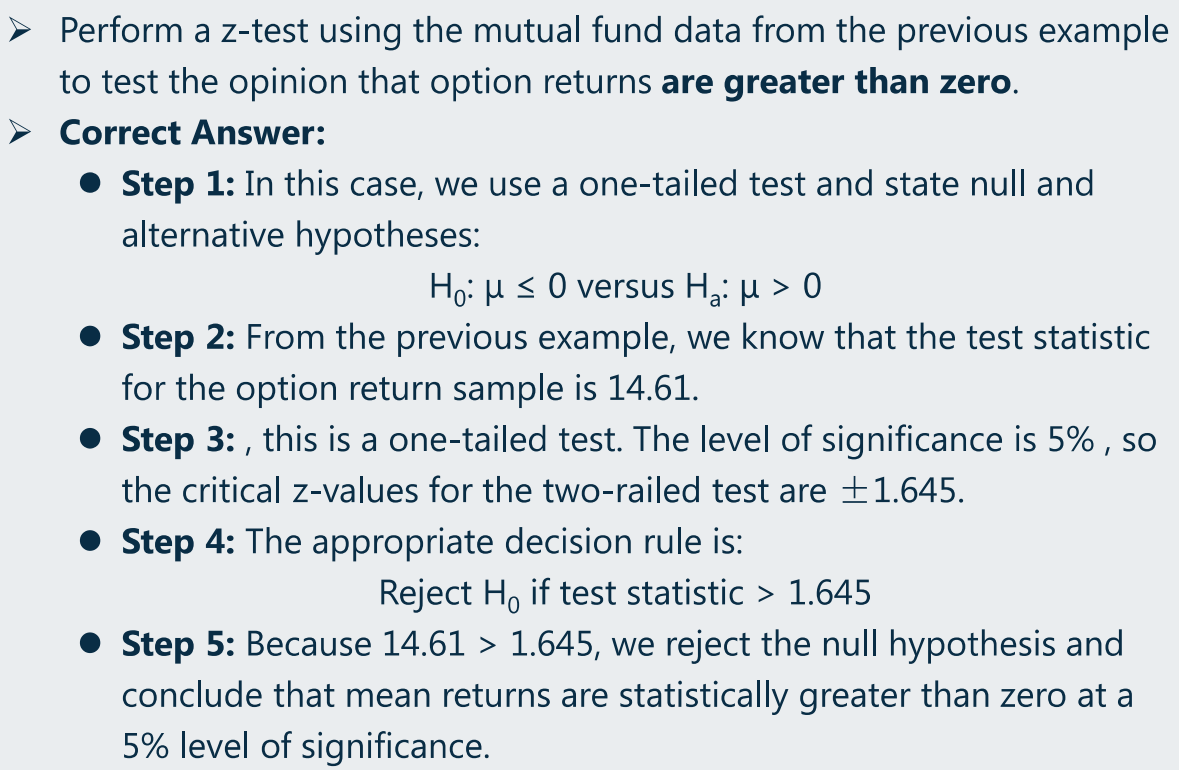
(b)假设检验流程应用(单尾)
(c)假设的拒绝与否判断
(3)假设检验:t-test(成对数检验)
- data do not meet distributional assumptions.(不满足分布的假设;如非正太、总体小样本的情况下)
含金融计算器计算一组数的均值和方差(标准差)
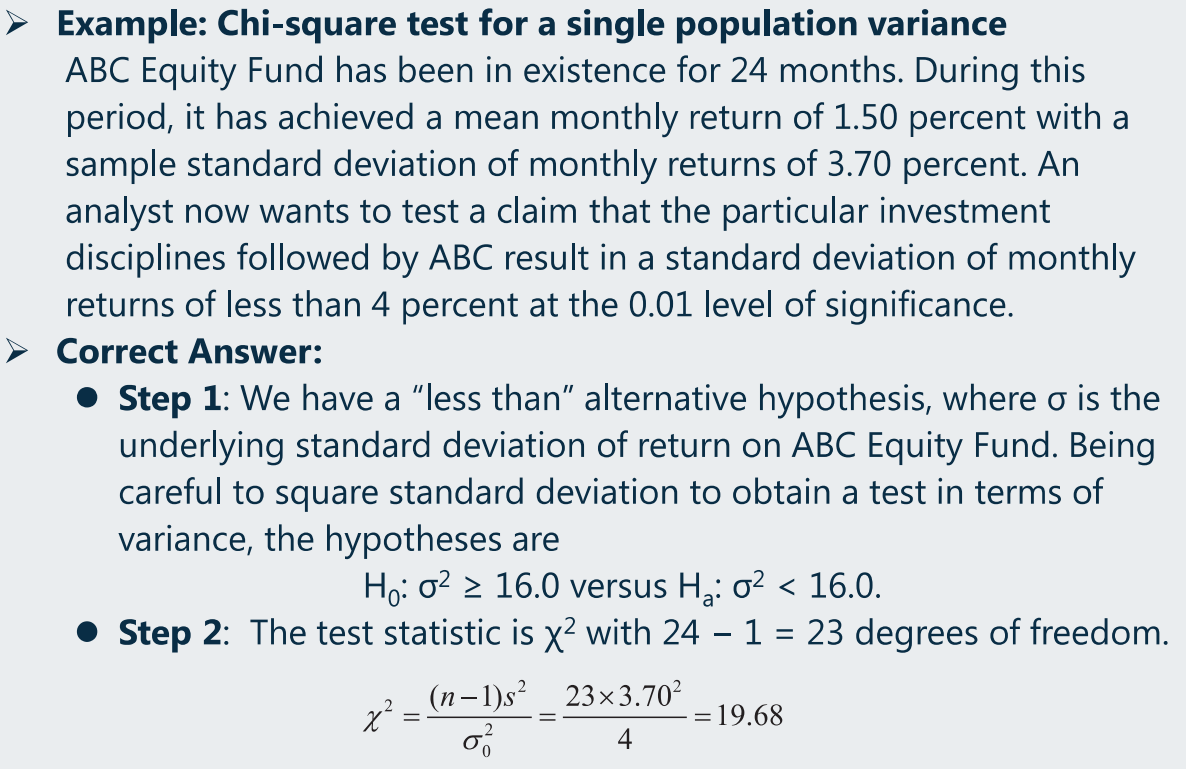
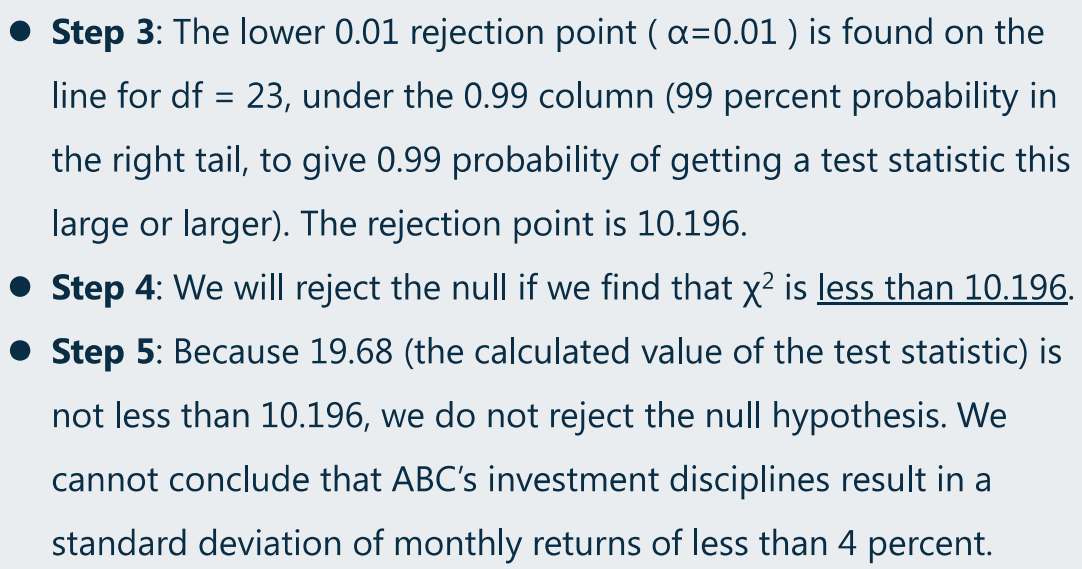
(4)假设检验:Chi-square(卡方)test

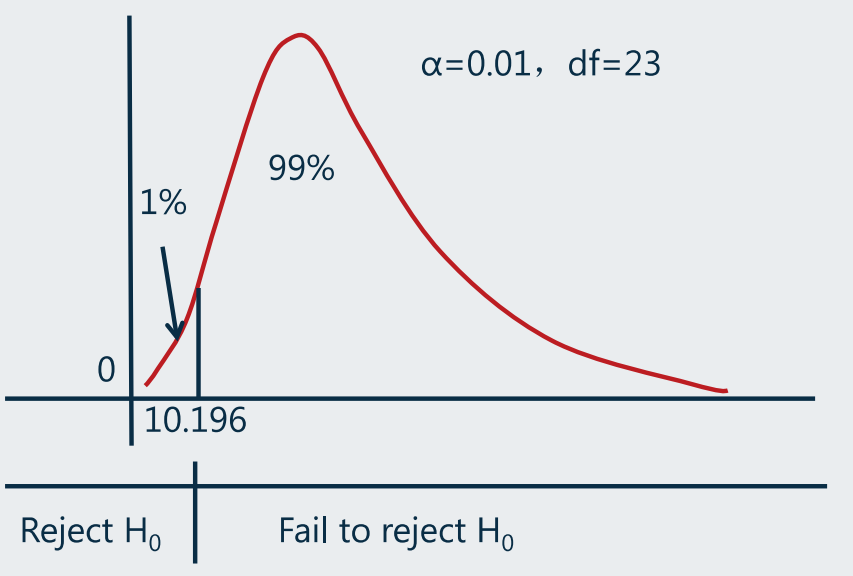
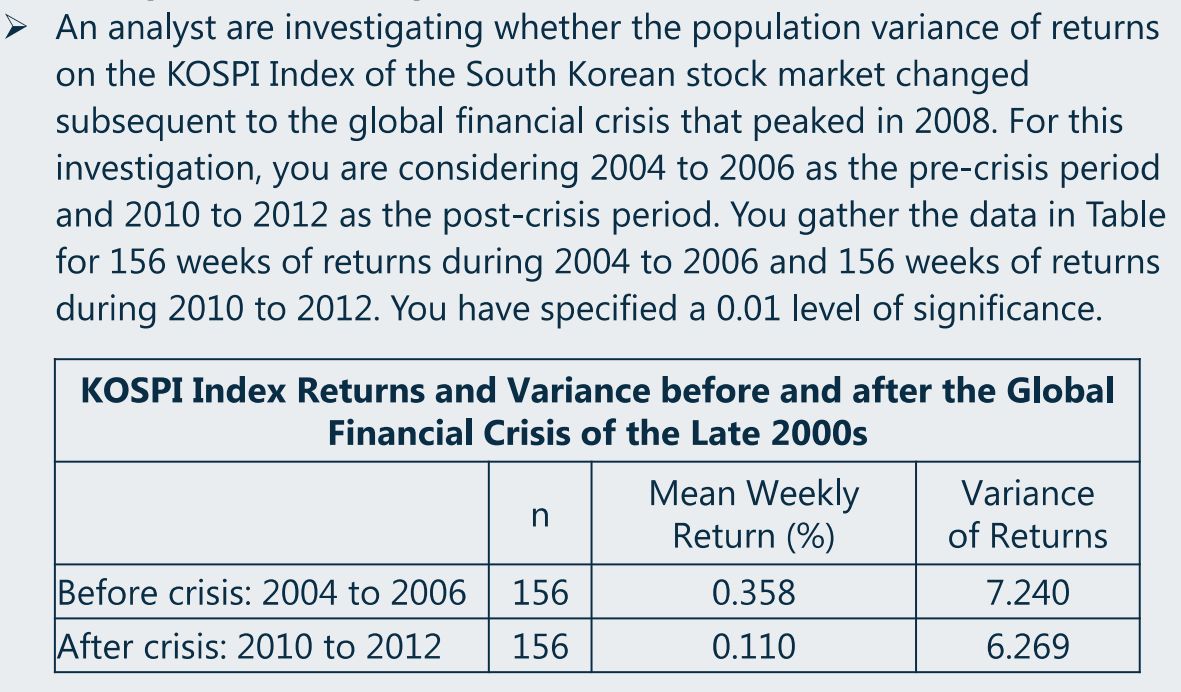
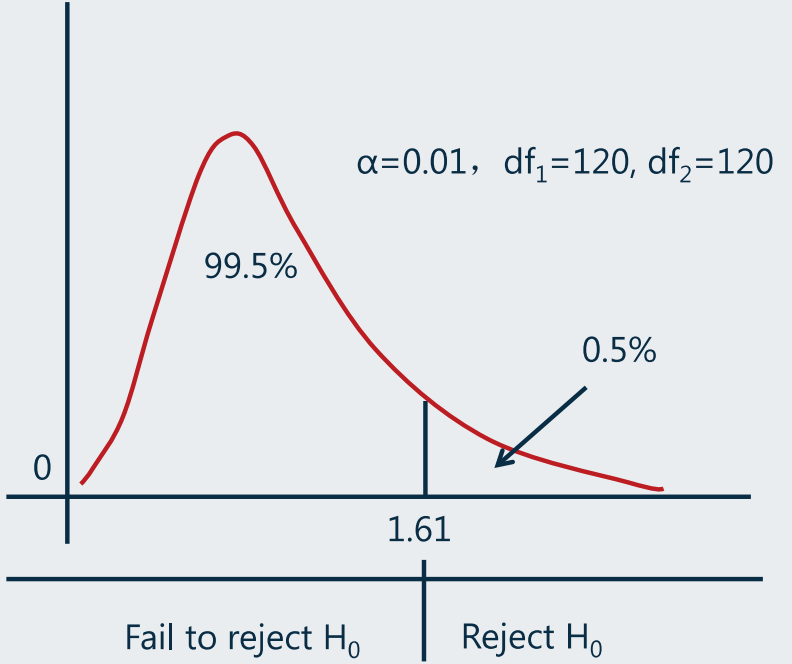
(5)假设检验:F-test for equal variances
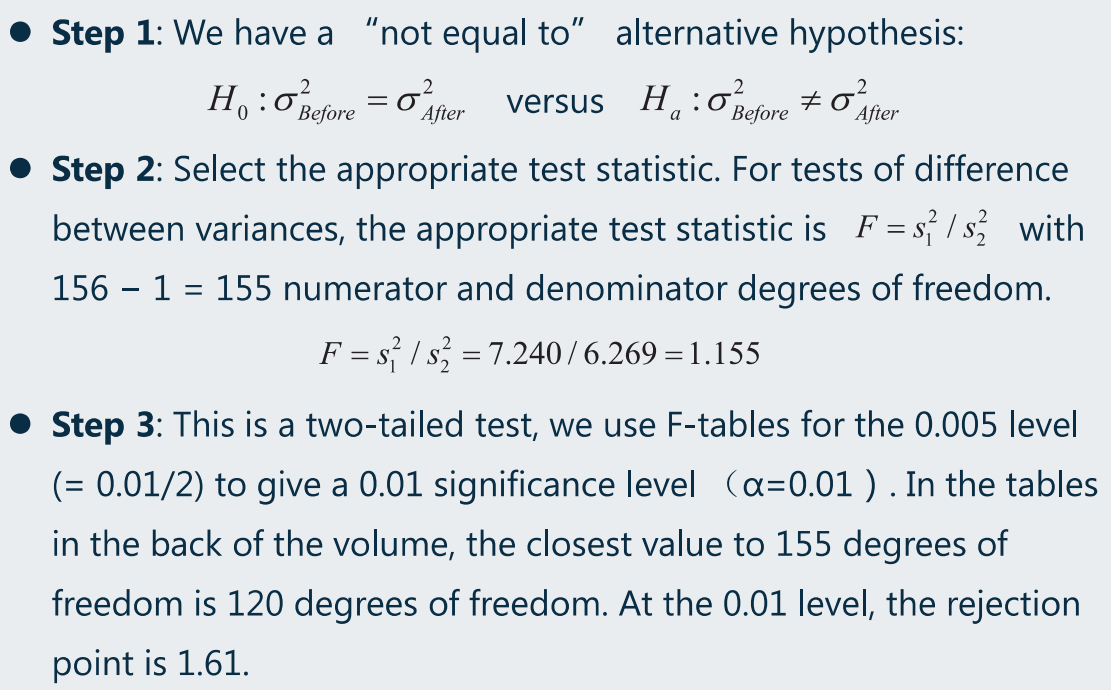
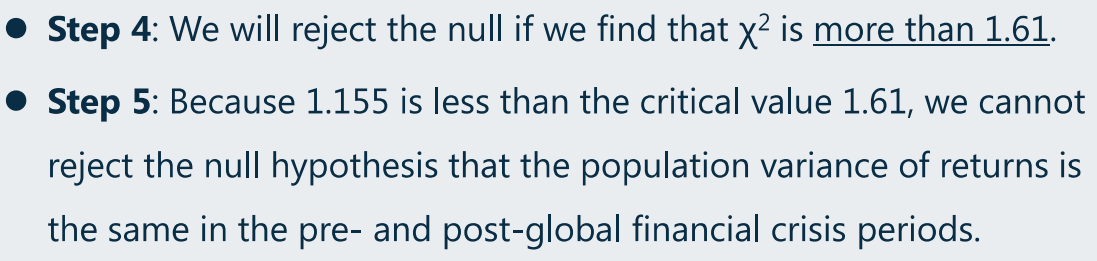
- Decision rule for F-test
(6)不同假设检验的比较
- 两个不同方差检验,使用 F 分布
- 成对数检验特点
(7)p-value Method

若有收获,就点个赞吧
0 人点赞
