G2 整体架构:https://yuque.antfin-inc.com/antv/g2-4/nzfwgw#FQA0L
G2-core 架构 https://yuque.antfin-inc.com/eva-engine/specs/kg56om#T88N9
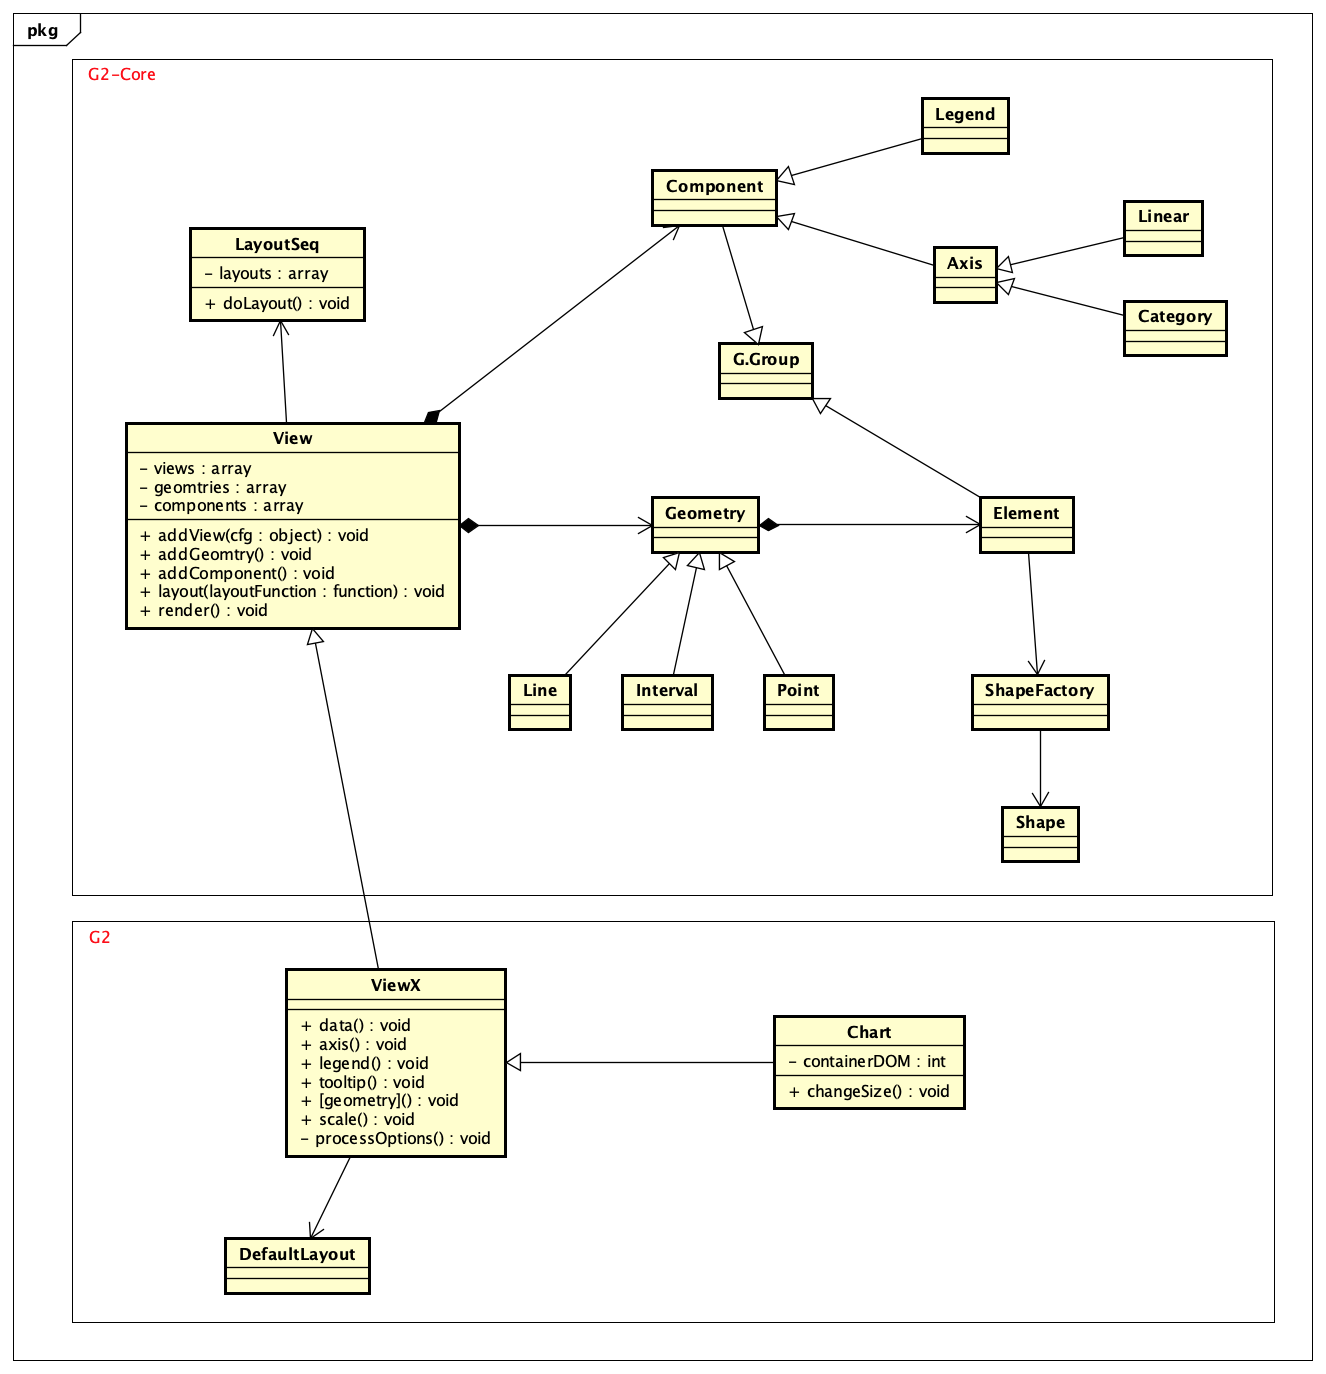
Core
- 伪代码
import { Canvas } from '@antv/g';import { View, Axis, Legend, Line, Coordinate, LAYER, POSITION } from '@antv/g2-core';// g 容器const canvas = new Canvas({ containerId: '#canvas' });// viewconst view = new View({width: 300,height: 300,container: canvas,});// line gemoconst coordinate = new Coordinate.Rect({ start, end });const line = new Line({ data: [], coordinate });line.position('date*sale');line.color('city');// initial: data group, 0~1, initial attr, scaleline.initial();// create Axes, legend with geometry's apiconst y = new LinarAxis({scale: line.getScale('sale'),title: {textStyle: {fontSize: 12, // 文本大小textAlign: 'center', // 文本对齐方式fill: '#999', // 文本颜色// ...}}});const x = new CatAxis({ scale: line.getScale('date') });const legend = new Legend({ items: line.getFieldDIM('city') });// add geometry, component into view// set Group Layer// set Layout Positonview.add(line);view.add(x, LAYER.FORE);view.add(y, LAYER.FORE);view.add(legend, LAYER.FORE, POSITION.BOTTOM);view.layout((components) => {// 针对 Component 的类型以及 Position,来逐个布局,计算:// 1. axis 的 width,height// 2. 每个组件的 x,y// 3. geom 的 coordinate 大小});// geom render, canvas renderview.render();
- 组件完全自定义,g2-plot 代码组织更容易
- 布局完全自定义,布局放到 view 中
G2
- 伪代码
import { Chart } from '@antv/g2';const chart = new Chart({containerId: '#canvas',});// 设置数据view.data([]);// 折线图 Geometryview.line().positon('date*sale').color('city');// x axis 配置view.axis('date', {title: {textStyle: {fontSize: 12, // 文本大小textAlign: 'center', // 文本对齐方式fill: '#999', // 文本颜色// ...}}});// y axis 配置chart.axis('sale', { ... });chart.legend({position: 'bottom',itemGap: 20});// 内置一套 Component Layout 逻辑,如果觉得处理的不好,可以针对性的去增加 layout 逻辑chart.render();
整体来说,是通过 API 提供的这些配置,都最终转换成 core 中的 API 来组织。
- 内置几套 Component 组件
- 内置一个 Layout 函数
自定义组件
- core 中的自定义组件完全没有问题
- g2 中的自定义组件有些麻烦,配合着需要增加其 API,比如增加 Title 组件,需要增加 chart.title API。
- 自定义组件一定伴随着自定义布局
组件布局
一个机制,可以对 view 中的组件调整 x、y、width、height。(width、height 只有 Axis 会用到),并且需要让开发者可以在 G2 内置布局的基础上,进行调整。
可以利用大概的洋葱模型的方式,可以设置一系列布局函数,可以使用默认的函数,也可以在默认函数之后、之前加入自己的函数进行局部调整。
+----------------------------------------------------------------------------------+| || layout 1 || || +-----------------------------------------------------------+ || | | || | layout 2 | || | | || | +---------------------------------+ | || | | | | || action | action | layout 3 | action | action || 001 | 002 | | 005 | 006 || | | action action | | || | | 003 004 | | || | | | | |+---------------------------------------------------------------------------------------------------->| | | | | || | | | | || | +---------------------------------+ | || +-----------------------------------------------------------+ |+----------------------------------------------------------------------------------+
自定义布局就是在洋葱圈中增加一圈,当然也可以将之前的圈给去掉。
嵌套 view
TODO
其他
其他的点都不会变化。
- 数据处理流程
- 数据更新
- 事件
- 动画
- Element & 自定义 shape

若有收获,就点个赞吧
0 人点赞
