导入相关的包
import numpy as npimport pandas as pdimport matplotlib.pyplot as plt% matplotlib inlineimport warningswarnings.filterwarnings('ignore')# 不发出警告from bokeh.io import output_notebookoutput_notebook()# 导入notebook绘图模块from bokeh.plotting import figure,show# 导入图表绘制、图标展示模块
基本散点图绘制
#基本散点图的绘制s = pd.Series(np.random.randn(80))#创建数据p = figure(plot_width = 600, plot_height = 600)p.circle(s.index, s.values, #x, y的值,也可以直接写成x = s.indnx, y = s.valuessize = 20, color = 'red', alpha = 0.7, #点的大小、颜色和透明度,这里color是指点填充的颜色和边线的颜色,这二者可以分别设置,如下fill_color = 'green', fill_alpha = 0.5, #填充的颜色和透明度line_color = 'blue', line_alpha = 0.7 , #边线的颜色和透明度line_dash = 'dashed', #设置边线为虚线line_width = 2, #设置边线宽度为2line_cap = "square", #设置线端口样式line_join = 'miter', #设置连接点样式legend = 'scatter_circle', #设置图例#radius = 2, #设置点的半径,和size只能二选一)#创建散点图,基本参数#bokeh中对line和fill是同样的设置方法p.legend.location = 'bottom_right' #设置图例位置show(p)
参数详解
plot_width, plot_height:设置图标的宽和高
size:设置点的大小
radius:设置点的半径大小,和size只能二选一
color:设置点的颜色,包括内填充颜色和外边线颜色
alpha:设置点的透明度,包括内填充颜色透明度和外边线颜色透明度
fill_color:设置内填充的颜色
fill_alpha:设置内填充颜色的透明底
line_color:设置外边线的颜色
line_alpha:设置外边线颜色的透明度
line_dash:设置外边线线条的样式,值可以为:solid、dashed、dotted、dotdash、dashdot,或者可以用数组的形式显示,例如[6, 4]
line_width:设置外边线的线宽
line_cap:设置外边线线端口样式
line_join:设置连接点样式
legend:设置图例,将图里的名称赋值为legend即可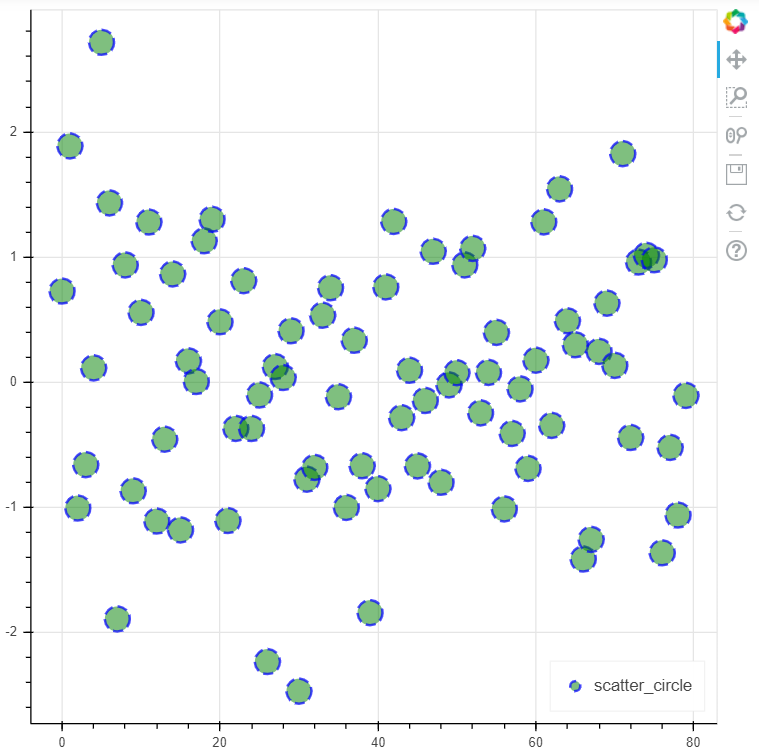
不同颜色与大小的散点图设置方法
利用字典与数组
# 2、散点图不同 颜色上色/散点大小 的方法# ① 数据中有一列专门用于设置颜色 / 点大小from bokeh.palettes import brewerrng = np.random.RandomState(1)df = pd.DataFrame(rng.randn(100, 2)*100, columns = ['A', 'B'])#创建数据,有2列随机值df['size'] = rng.randint(10, 30, 100) #设置点的大小字段colormap1 = {1:'red', 2:'green', 3:'blue'}df['color1'] = [colormap1[x] for x in rng.randint(1, 4, 100)] #调色盘1p = figure(plot_width = 600, plot_height = 600)p.circle(df['A'], df['B'], #设置散点图x,y的值line_color = 'white', #设置边线颜色为白色fill_color = df['color1'], #设置填充颜色fill_alpha = 0.6 , #设置填充颜色的透明度size = df['size'], #设置点的大小)show(p)
根据需要,设置散点图的大小和颜色都不相同,第一个方法是通过字典与循环的方法实现,首先设置一个字典,例如colormap1,然后利用循环设置颜色数组,并添加到数据中,如df[‘color1’]调色盘所示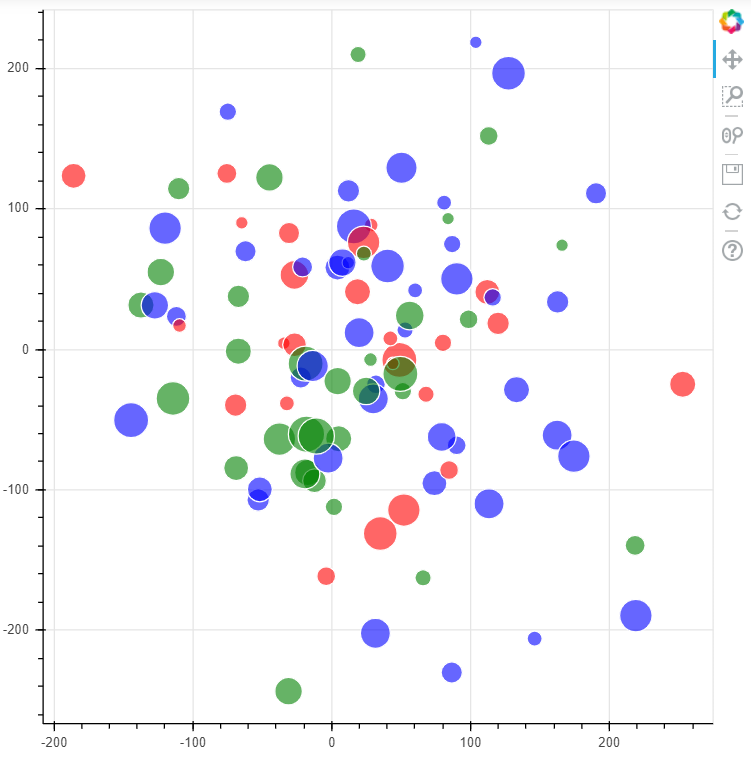
利用调色盘的颜色
#利用调色盘设置不同颜色from bokeh.palettes import brewerrng = np.random.RandomState(1)df = pd.DataFrame(rng.randn(100, 2)*100, columns = ['A', 'B'])#创建数据,有2列随机值df['size'] = rng.randint(10, 30, 100) #设置点的大小字段n = 8 #设置调色盘颜色的个数colormap2 = brewer['Blues'][n] #调用调色盘中的蓝色,并选择8个色系df['color2'] = [colormap2[x] for x in rng.randint(0, n, 100)]p = figure(plot_width = 600, plot_height = 600)p.circle(df['A'], df['B'], #设置散点图x,y的值line_color = 'white', #设置边线颜色为白色fill_color = df['color2'], #设置填充颜色fill_alpha = 0.6 , #设置颜色的透明度size = df['size'], #设置点的大小)show(p)
设置点的颜色与大小各不相同的第二种研办法,其中点的大小与方法1相同,颜色设置这利用调色板,选择蓝色中的8个色系,如下图: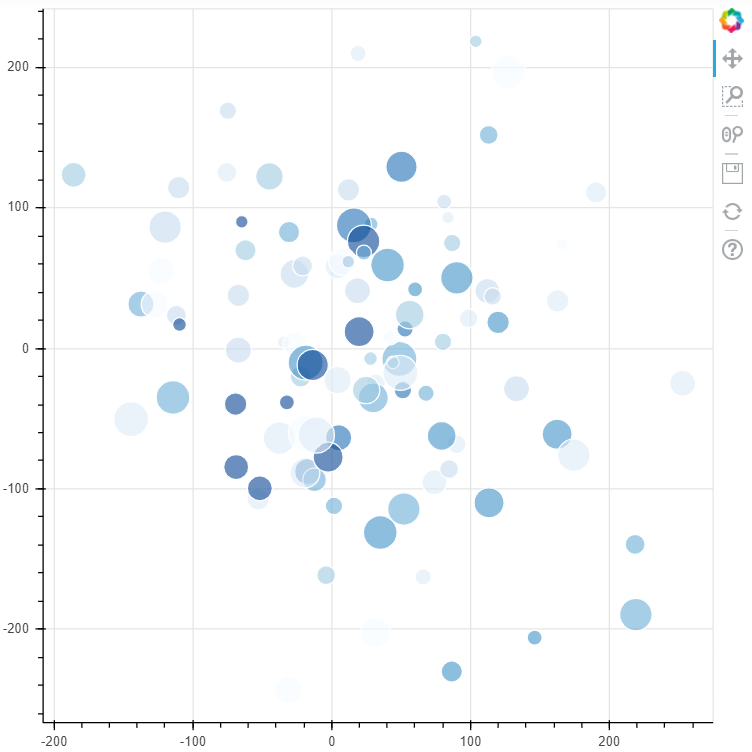
遍历数据分开做图
# 2、散点图不同 颜色上色/散点大小 的方法# ② 遍历数据分开做图rng = np.random.RandomState(1)df = pd.DataFrame(rng.randn(100, 2), columns=['A','B'])df['type'] = rng.randint(0, 7, 100)#创建数据colors = ["red", "olive", "darkred", "goldenrod", "skyblue", "orange", "salmon"]# 创建颜色列表p = figure(plot_width = 600, plot_height = 600,tools = 'pan,wheel_zoom,box_select,lasso_select,reset', #设置工具栏)for t in df['type'].unique():p.circle(df['A'][df['type'] == t], df['B'][df['type'] == t], #设置散点图x, y的值size = 20, alpha = 0.5,color = colors[t],legend = 'Type%i'%t)#通过分类设置颜色p.legend.location = 'bottom_right' #设置图例位置show(p)
unique:统计出list中所有出现的值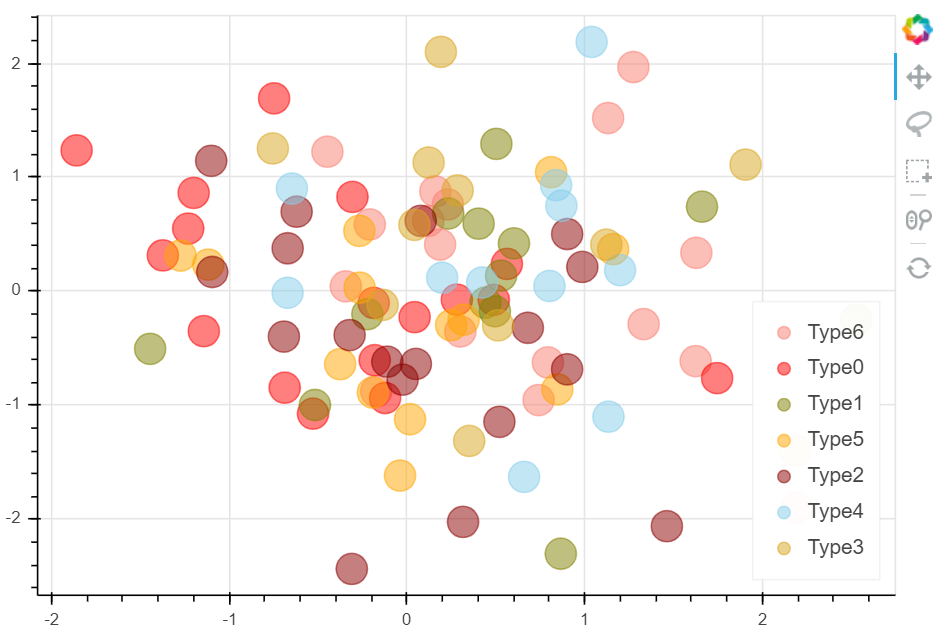
绘制不同符号的散点图
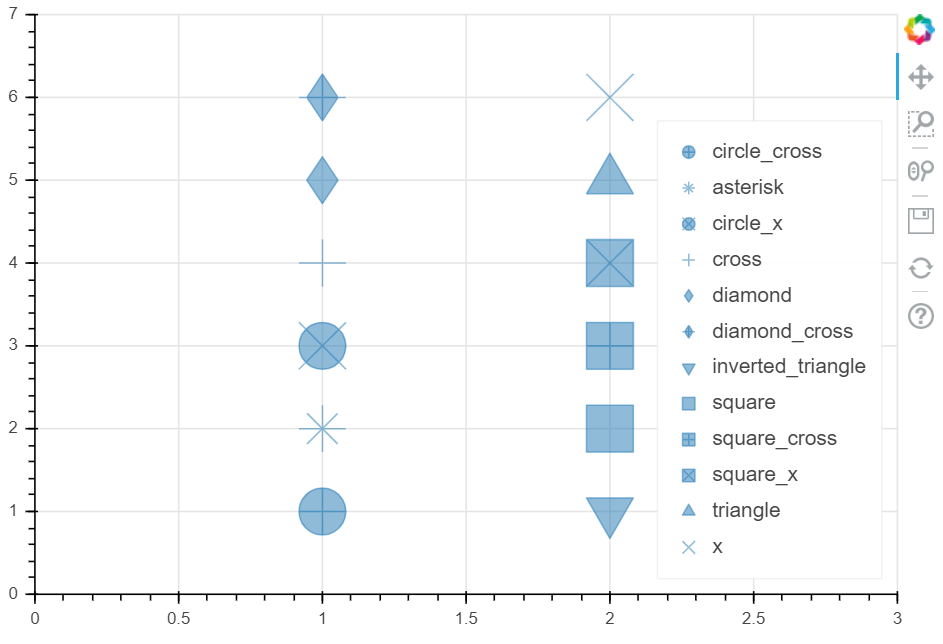
# 3、不同符号的散点图# asterisk(), circle(), circle_cross(), circle_x(), cross(), diamond(), diamond_cross(), inverted_triangle()# square(), square_cross(), square_x(), triangle(), x()p = figure(plot_width=600, plot_height=400,x_range = [0,3], y_range = [0,7])p.circle_cross(1, 1, size = 30, alpha = 0.5, legend = 'circle_cross')p.asterisk(1, 2, size = 30, alpha = 0.5, legend = 'asterisk')p.circle_x(1, 3, size = 30, alpha = 0.5, legend = 'circle_x')p.cross(1, 4, size = 30, alpha = 0.5, legend = 'cross')p.diamond(1, 5, size = 30, alpha = 0.5, legend = 'diamond')p.diamond_cross(1, 6, size = 30, alpha = 0.5, legend = 'diamond_cross')p.inverted_triangle(2, 1, size = 30, alpha = 0.5, legend = 'inverted_triangle')p.square(2, 2, size = 30, alpha = 0.5, legend = 'square')p.square_cross(2, 3, size = 30, alpha = 0.5, legend = 'square_cross')p.square_x(2, 4, size = 30, alpha = 0.5, legend = 'square_x')p.triangle(2, 5, size = 30, alpha = 0.5, legend = 'triangle')p.x(2, 6, size = 30, alpha = 0.5, legend = 'x')p.legend.location = "bottom_right"# 设置图例位置show(p)
#各种散点图的详细设置,可以参考如下网址http://bokeh.pydata.org/en/latest/docs/reference/plotting.html#bokeh.plotting.figure.Figure.circle

若有收获,就点个赞吧
0 人点赞
