辅助标注 - 线
import numpy as npimport pandas as pdimport matplotlib.pyplot as plt%matplotlib inlineimport warningswarnings.filterwarnings('ignore')# 不发出警告from bokeh.io import output_notebookoutput_notebook()#导入notebook绘图模块from bokeh.plotting import figure,show#导入图表绘制、图表展示模块#辅助标记 - 线from bokeh.models.annotations import Span#导入Span模块x = np.linspace(0, 20, 200)y = np.sin(x)#创建x,y数据p = figure(y_range = (-1.5, 1.5)) #y_range设置y轴的范围p.line(x, y)#绘制曲线upper = Span(location = 1, #设置辅助线的位置,这设置辅助线在值为1的位置dimension = 'width', #设置辅助线的方向,width为横向,height为纵向line_color = 'red', #设置线的颜色line_width = 4 #设置线宽)p.add_layout(upper)#绘制辅助线1lower = Span(location = -1, #设置辅助线的位置dimension = 'width', #设置辅助线的方向line_color = 'blue', #设置辅助线的颜色line_width = 3, #设置辅助线的粗细,line_dash = [8, 4] #设置辅助线虚线显示)p.add_layout(lower)#绘制辅助线2show(p)
Bokeh中设置辅助线有自己的一套体系,需要用到Span模块,具体参数如下:
line:绘制线状图,参数为x、y,其是连点成线,将x和y定位的点连起来成一条线
y_range:设置y轴的可视化范围,上图中范围为(-1.5, 1.5),即图表y轴需要显示从-1.5到1.5之间的轴
Span模块是为了实现辅助线的绘制,穷参数如下:
location:设置辅助线的位置,例如当其职为1的时候,辅助线位于x = 1或者y = 1这条线上
dimesion:设置辅助线的显示方向,当其值为width时,辅助线横向显示,当其值为height时,辅助线竖向显示
line_color:设置辅助线的颜色
line_width:设置辅助线的粗细
line_dash:设置辅助线为虚线显示
add_layout:为了显示辅助线的函数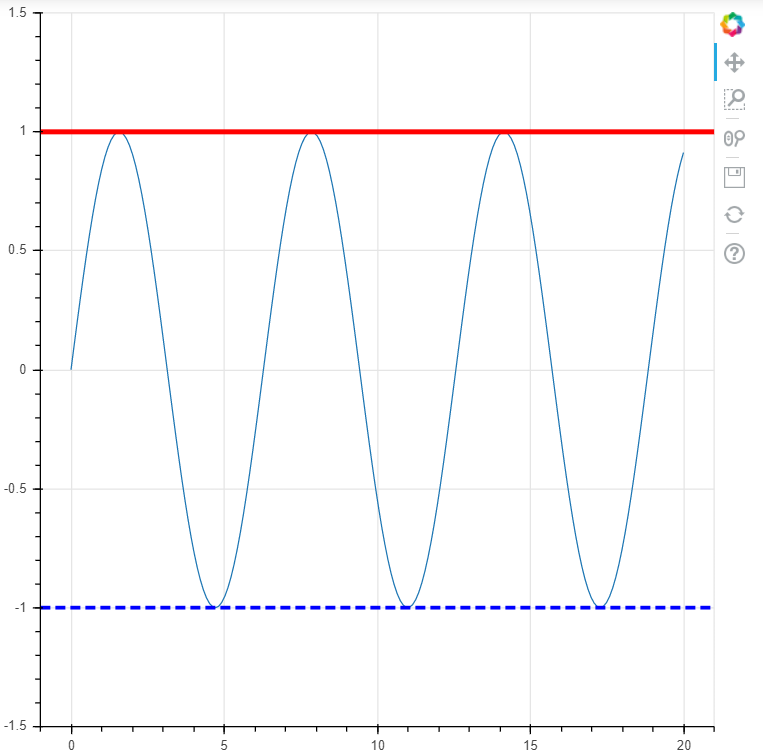
辅助标注 - 矩形
from bokeh.models.annotations import BoxAnnotation#导入BoxAnnotation模块x = np.linspace(0, 20, 200)y = np.sin(x)#创建x, y数据p = figure(y_range = (-2, 2))p.line(x, y)#绘制曲线upper = BoxAnnotation(bottom = 1, #设置矩形下方 的位置fill_alpha = 0.3, #设置矩形的透明度fill_color = 'olive', #设置矩形的颜色line_width = 2, #设置矩形框的粗细line_color = 'red', #设置矩形框的颜色line_dash = [6, 3] #设置矩形框虚线显示)p.add_layout(upper)#显示矩形框#设置辅助矩形1lower = BoxAnnotation(top = -1, #设置矩形上方位置fill_alpha = 0.2, #设置矩形的透明度fill_color = 'blue',line_width = 3, #设置矩形框的粗细line_color = 'green', #设置矩形框的颜色line_dash = [8, 4]) #设置矩形框虚线显示p.add_layout(lower)#显示矩形框#设置辅助矩形2center = BoxAnnotation(top = 0.6, bottom = -0.4, left = 7, right = 12, #设置矩形四个边的位置fill_alpha = 0.3,fill_color = 'orange')p.add_layout(center)show(p)
在Bokeh中,辅助标注也可以做一个矩形,需要使用BoxAnnotation模块来实现,参数如下:
bottom:设置矩形下边的位置
top:设置矩形上边的位置
left:设置矩形左边的位置
right:设置矩形右边的位置
fill_alpha:设置矩形的透明度
fill_color:设置举行的颜色
line_width:设置矩形边的粗细
line_color:设置矩形边线的颜色
line_dash:设置矩形边线虚线显示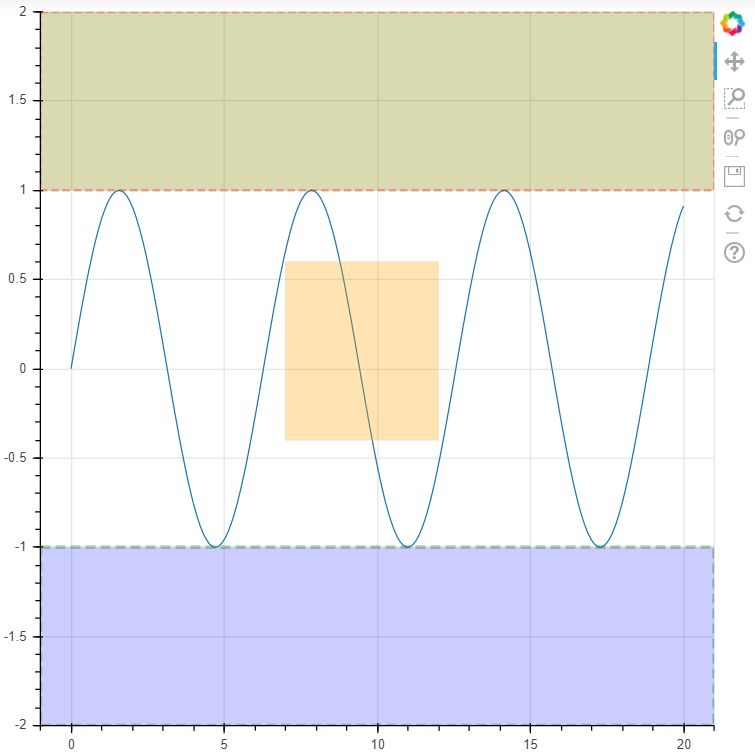
绘图注释
from bokeh.models.annotations import Label#导入Label模块p = figure(x_range = (0, 10), y_range = (0, 10))p.circle([2, 5, 8], [4, 7, 6], color = 'olive', size = 10)#绘制散点图label = Label(x = 5, y = 7, #注释的点x_offset = 12, #x偏移量,同样的还有y_offsettext = 'Second Point', #注释内容text_font_size = "12pt", #字体大小border_line_color = 'red', #注释框颜色background_fill_color = 'gray', #注释的背景颜色background_fill_alpha = 0.5 #注释背景的透明度)p.add_layout(label)show(p)
Label模块可以用来做注释,如下图可见,参数如下:
x,y:设置注释所在的点
x_offset、y_offset:设置偏移量
text:注释内容
text_font_size:设置注释内容字体的大小
border_line_color:设置注释框的颜色
background_fill_color:设置注释框的背景颜色
background_fill_alpha:设置注释框背景颜色的透明度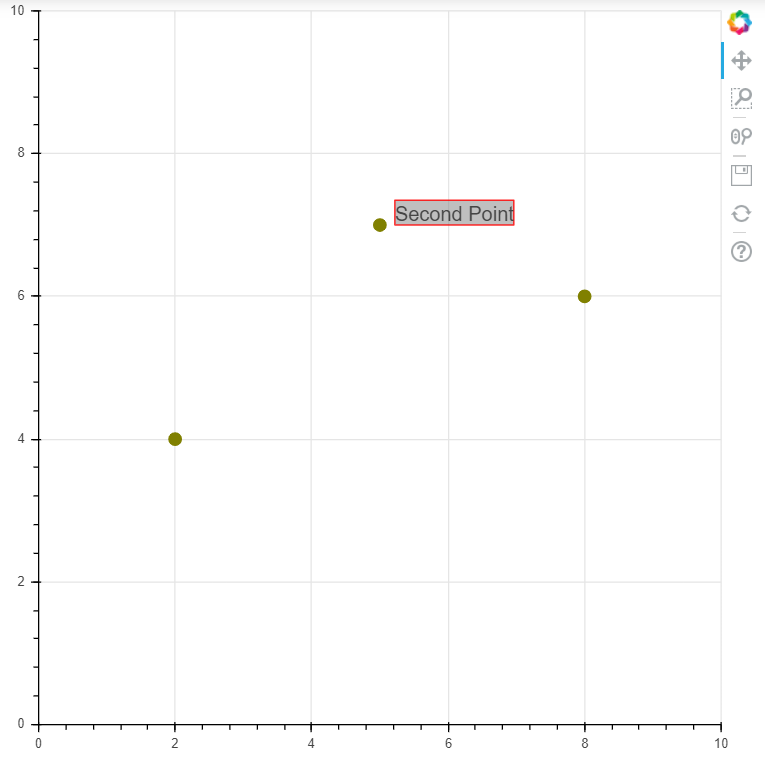
注释箭头
#注释箭头from bokeh.models.annotations import Arrowfrom bokeh.models.arrow_heads import OpenHead, NormalHead, VeeHead #三种箭头类型#导入相关模块p = figure(plot_width = 600, plot_height = 600)p.circle(x = [0, 1, 0.5], y = [0, 0, 0.7], radius = 0.1, color = ['navy', 'yellow', 'red'], fill_alpha = 0.5)#创建散点图#radius圆的半径p.add_layout(Arrow(end = OpenHead(line_color = 'green', line_width = 4), #设置箭头类型x_start = 0, y_start = 0, x_end =1, y_end = 0 #设置箭头的起始位置和终点))#绘制箭头1p.add_layout(Arrow(end = NormalHead(line_color = 'red', line_width = 2), #设置箭头类型x_start = 1, y_start = 0, x_end = 0.5, y_end = 0.7 #设置箭头的起始位置和终点))#绘制箭头2p.add_layout(Arrow(end = VeeHead(line_color = 'blue', line_width = 2), #设置箭头类型x_start = 0.5, y_start = 0.7, x_end = 0, y_end = 0))#绘制箭头3show(p)
绘制箭头类型有三种,分别是OpenHead、NormalHead、VeeHead,其参数如下:
line_color:线头的颜色
line_width:箭头线的粗细
x_start、y_start:箭头的起始位置
x_end、y_end:箭头的终点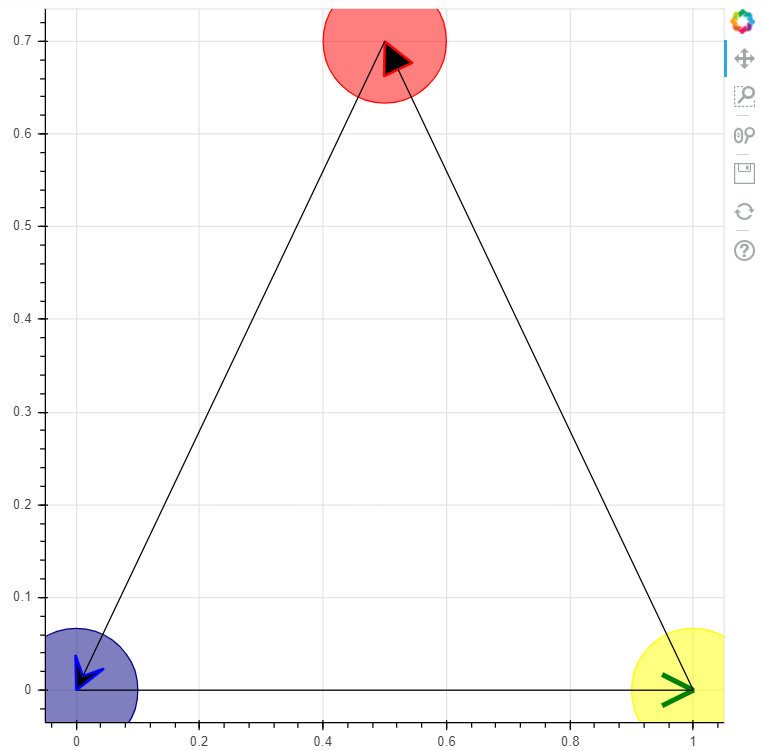
调色盘
# 调色盘# 颜色参考文档:http://bokeh.pydata.org/en/latest/docs/reference/palettes.html# ColorBrewer:http://colorbrewer2.org/#type=sequential&scheme=BuGn&n=3import bokeh.palettes as bpfrom bokeh.palettes import brewerprint('所有调色板名称:\n',bp.__palettes__)print('-------')# 查看所有调色板名称print('蓝色调色盘颜色:\n',bp.Blues)print('-------')# 查看蓝色调色盘颜色n = 8colori = brewer['YlGn'][n]print('YlGn调色盘解析为%i个颜色,分别为:\n' % n, colori)# 调色盘解析 → 不同颜色解析最多颜色有限

若有收获,就点个赞吧
0 人点赞
