导入代码库
import numpy as npimport pandas as pdimport matplotlib.pyplot as plt% matplotlib inlineimport warningswarnings.filterwarnings('ignore')# 不发出警告from bokeh.io import output_notebookoutput_notebook()# 导入notebook绘图模块from bokeh.plotting import figure,showfrom bokeh.models import ColumnDataSource# 导入图表绘制、图标展示模块# 导入ColumnDataSource模块
筛选数据
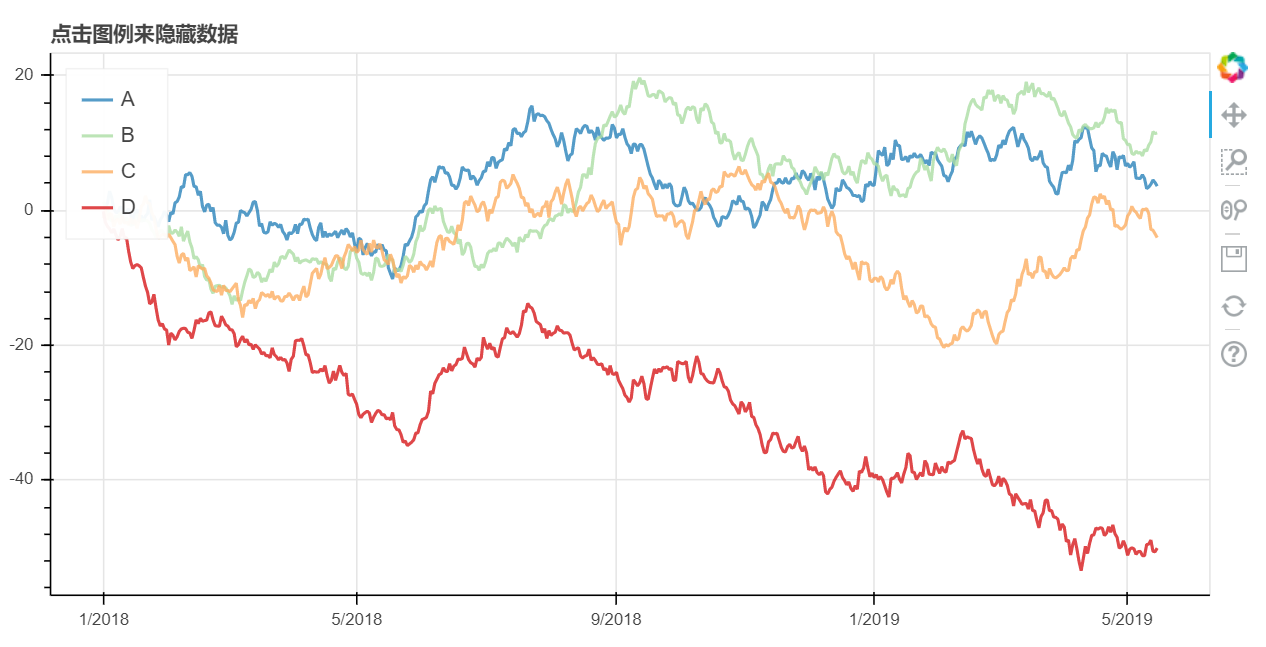
隐藏
# 筛选数据 - 隐藏# legend.click_policyfrom bokeh.palettes import Spectral4# 导入颜色模块df = pd.DataFrame({'A':np.random.randn(500).cumsum(),'B':np.random.randn(500).cumsum(),'C':np.random.randn(500).cumsum(),'D':np.random.randn(500).cumsum()},index = pd.date_range('20180101',freq = 'D',periods=500))# 创建数据p = figure(plot_width=800, plot_height=400, x_axis_type="datetime")p.title.text = '点击图例来隐藏数据'for col,color in zip(df.columns.tolist(),Spectral4):p.line(df.index,df[col],line_width=2, color=color, alpha=0.8,legend = col)p.legend.location = "top_left"p.legend.click_policy="hide"# 设置图例,点击隐藏show(p)
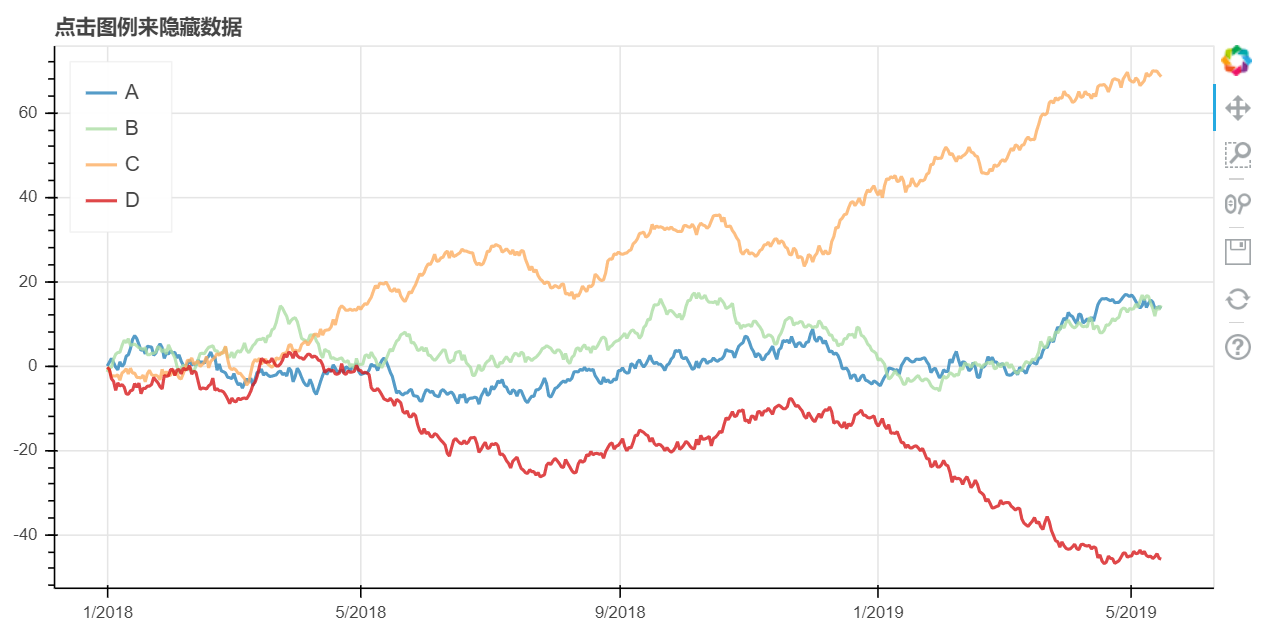
消隐
# 筛选数据 - 消隐# legend.click_policyfrom bokeh.palettes import Spectral4# 导入颜色模块df = pd.DataFrame({'A':np.random.randn(500).cumsum(),'B':np.random.randn(500).cumsum(),'C':np.random.randn(500).cumsum(),'D':np.random.randn(500).cumsum()},index = pd.date_range('20180101',freq = 'D',periods=500))# 创建数据p = figure(plot_width=800, plot_height=400, x_axis_type="datetime")p.title.text = '点击图例来隐藏数据'for col,color in zip(df.columns.tolist(),Spectral4):p.line(df.index,df[col],line_width=2, color=color, alpha=0.8,legend = col,muted_color=color, muted_alpha=0.2) # 设置消隐后的显示颜色、透明度p.legend.location = "top_left"p.legend.click_policy="mute"# 设置图例,点击隐藏show(p)
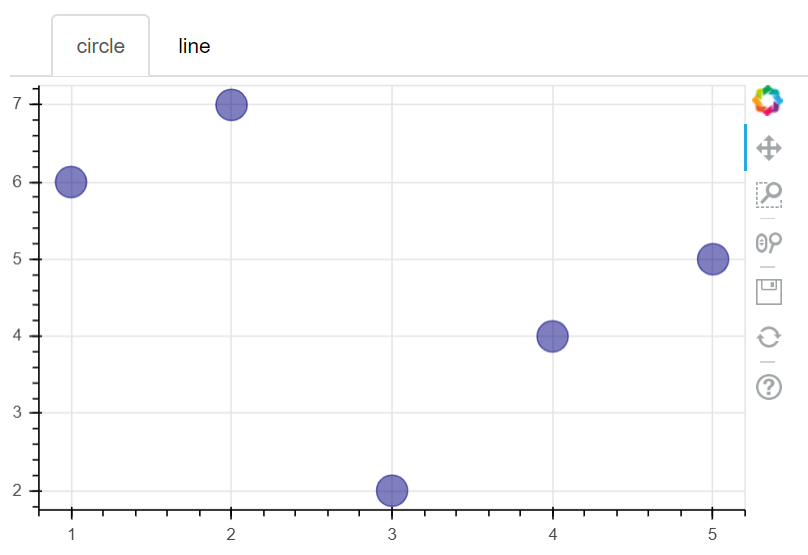
交互小工具—图表分页
# 交互小工具# 图表分页from bokeh.models.widgets import Panel, Tabs# 导入panel,tabs模块p1 = figure(plot_width=500, plot_height=300)p1.circle([1, 2, 3, 4, 5], [6, 7, 2, 4, 5], size=20, color="navy", alpha=0.5)tab1 = Panel(child=p1, title="circle")# child → 页码# title → 分页名称p2 = figure(plot_width=500, plot_height=300)p2.line([1, 2, 3, 4, 5], [4, 2, 3, 8, 6], line_width=3, color="navy", alpha=0.5)tab2 = Panel(child=p2, title="line")tabs = Tabs(tabs=[ tab1, tab2 ])# 设置分页图表show(tabs)


若有收获,就点个赞吧
0 人点赞
