可视化
1、社交媒体分析工具——One Million Tweet Map
https://onemilliontweetmap.com/
One Million Tweet Map,该工具可以在世界地图中可视化汇总实时生成的推文,其中不仅包括 Twitter ,也有 Instagram 等社交媒体软件的推文。
特点:
- 地图显示的是24小时内的地理定位推文
- 数据实时更新,仅保留24小时内的推文
- 每秒都添加大约50条新推文
- 支持使用过滤器来筛选你想要的信息
2、A collection of WebGL and WebGPU frameworks and libraries
https://gist.github.com/dmnsgn/76878ba6903cf15789b712464875cfdc
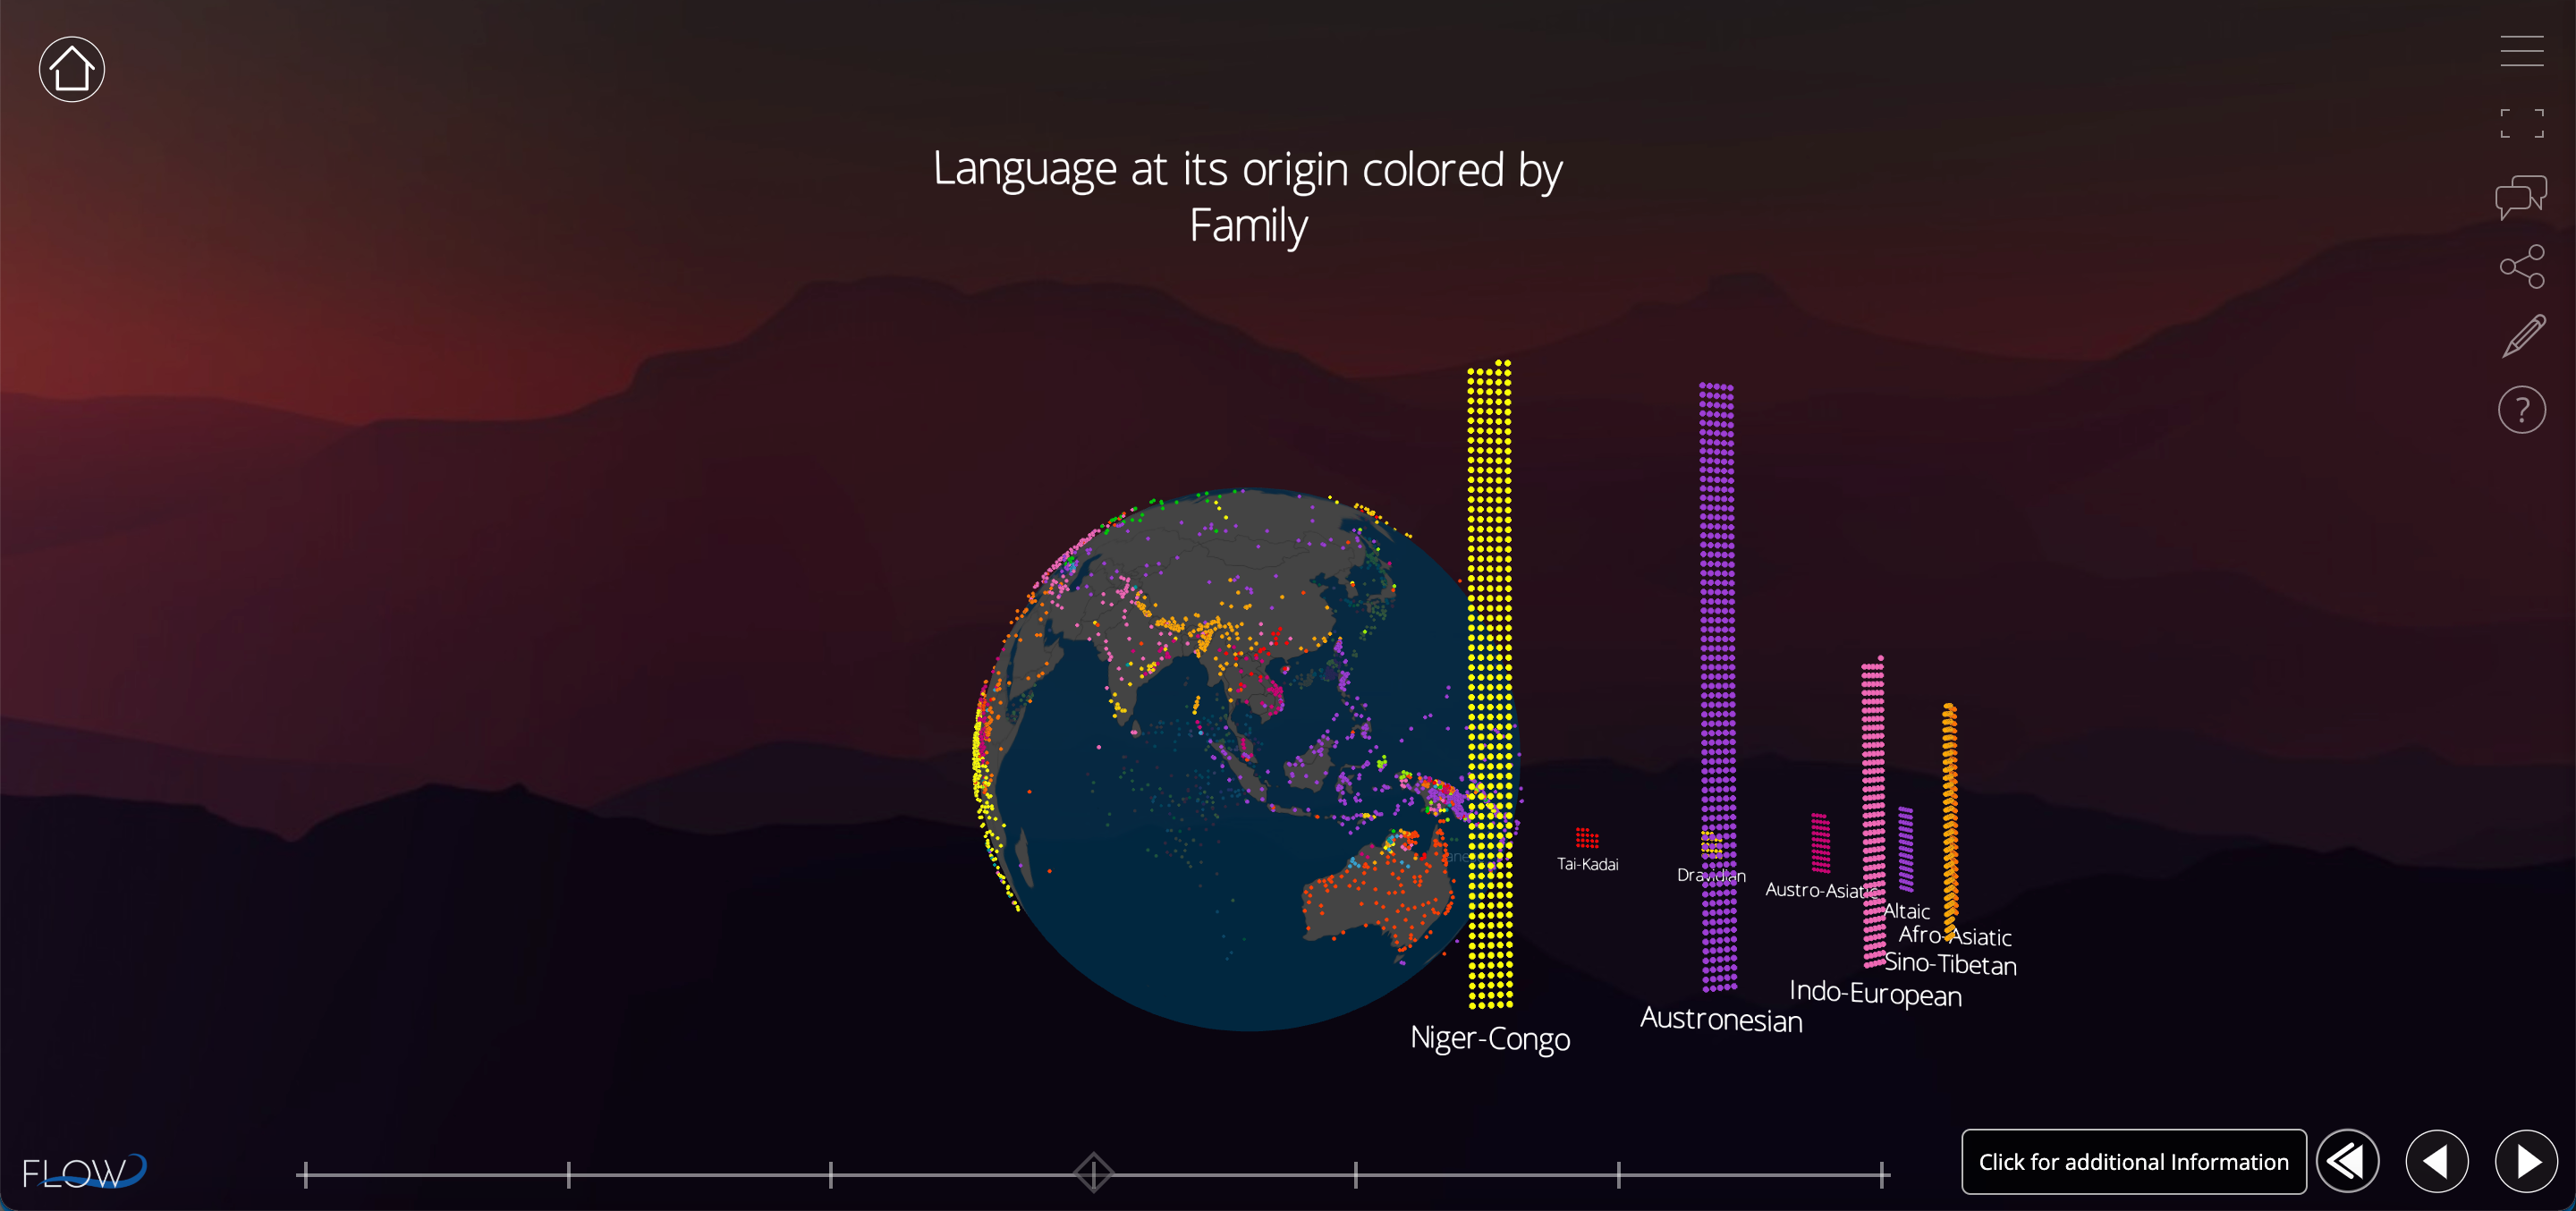
3、flow
4、polygonjs
Polygonjs is a node-based 3D Webgl engine
https://github.com/polygonjs/polygonjs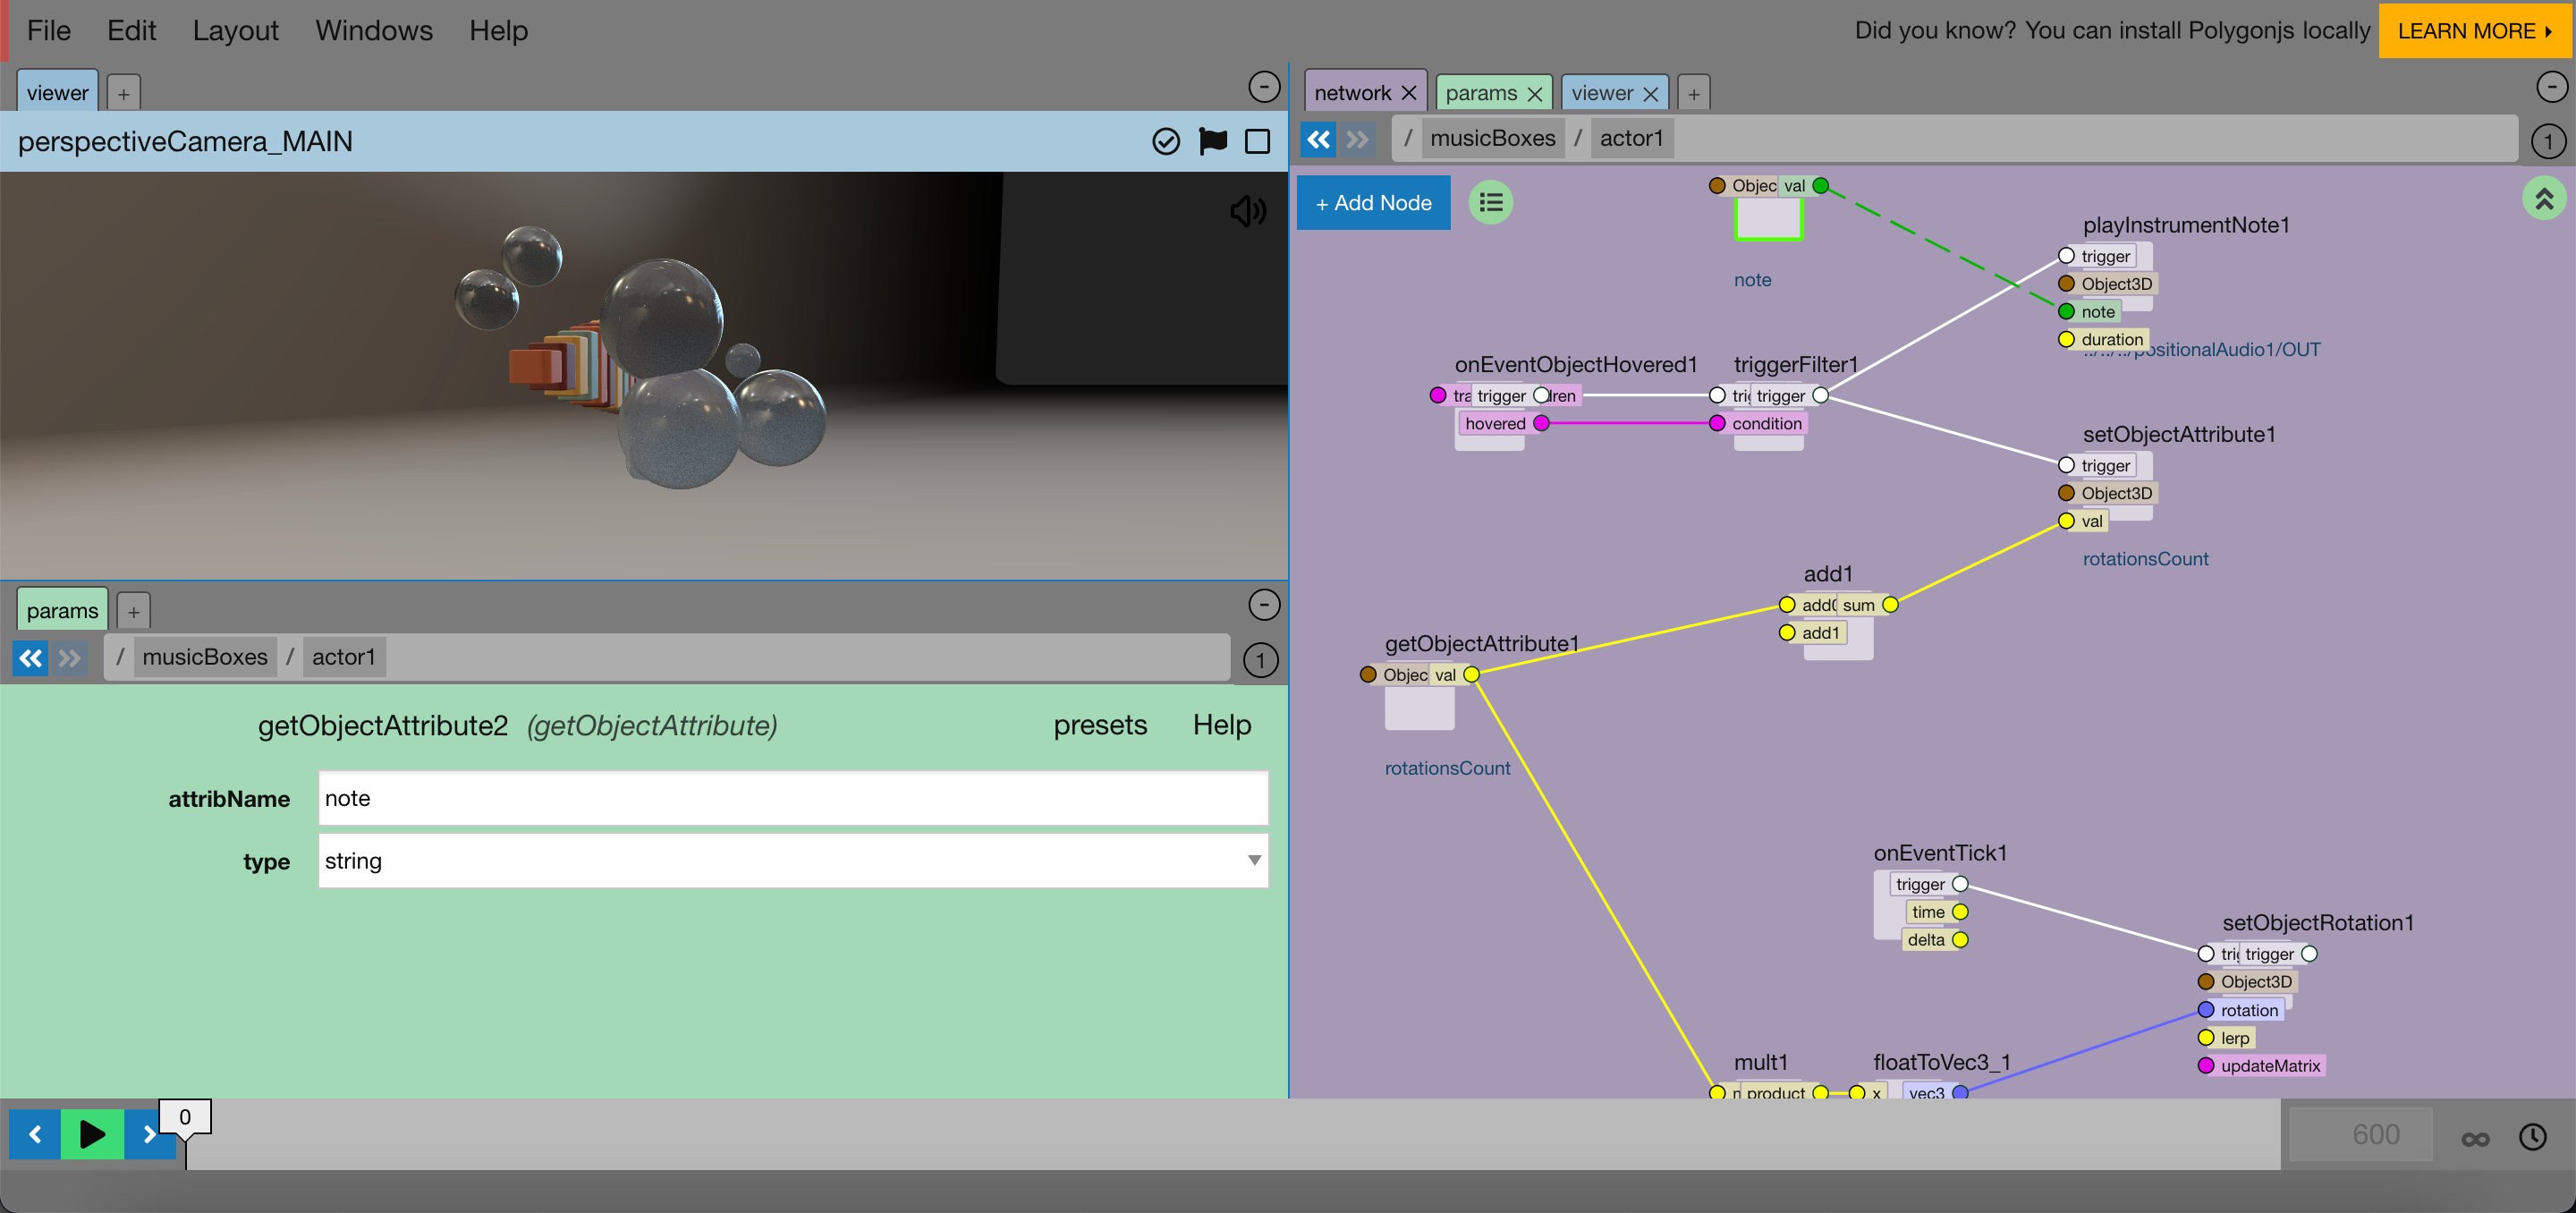
5、ccNetViz
https://github.com/HelikarLab/ccNetViz
JavaScript library for visualization of large-scale network graphs using WebGL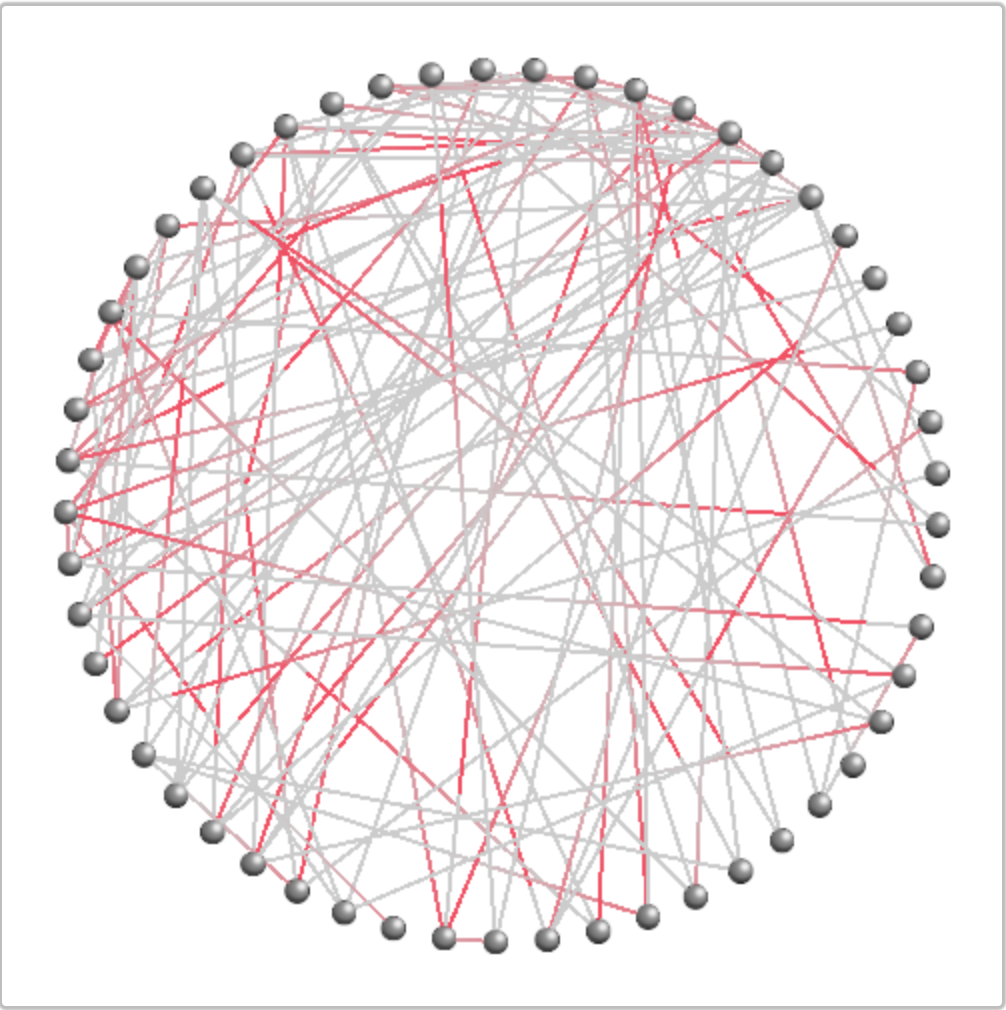
6、flowmap.gl
https://github.com/FlowmapBlue/flowmap.gl
Flow map drawing layer for deck.gl. Can be used for visualizing movement of people (e.g. migration) or objects between geographic locations. The layer is rendered in WebGL and can handle large numbers of flows with a relatively good rendering performance.
7、Grid Map
https://github.com/analyzer2004/gridmap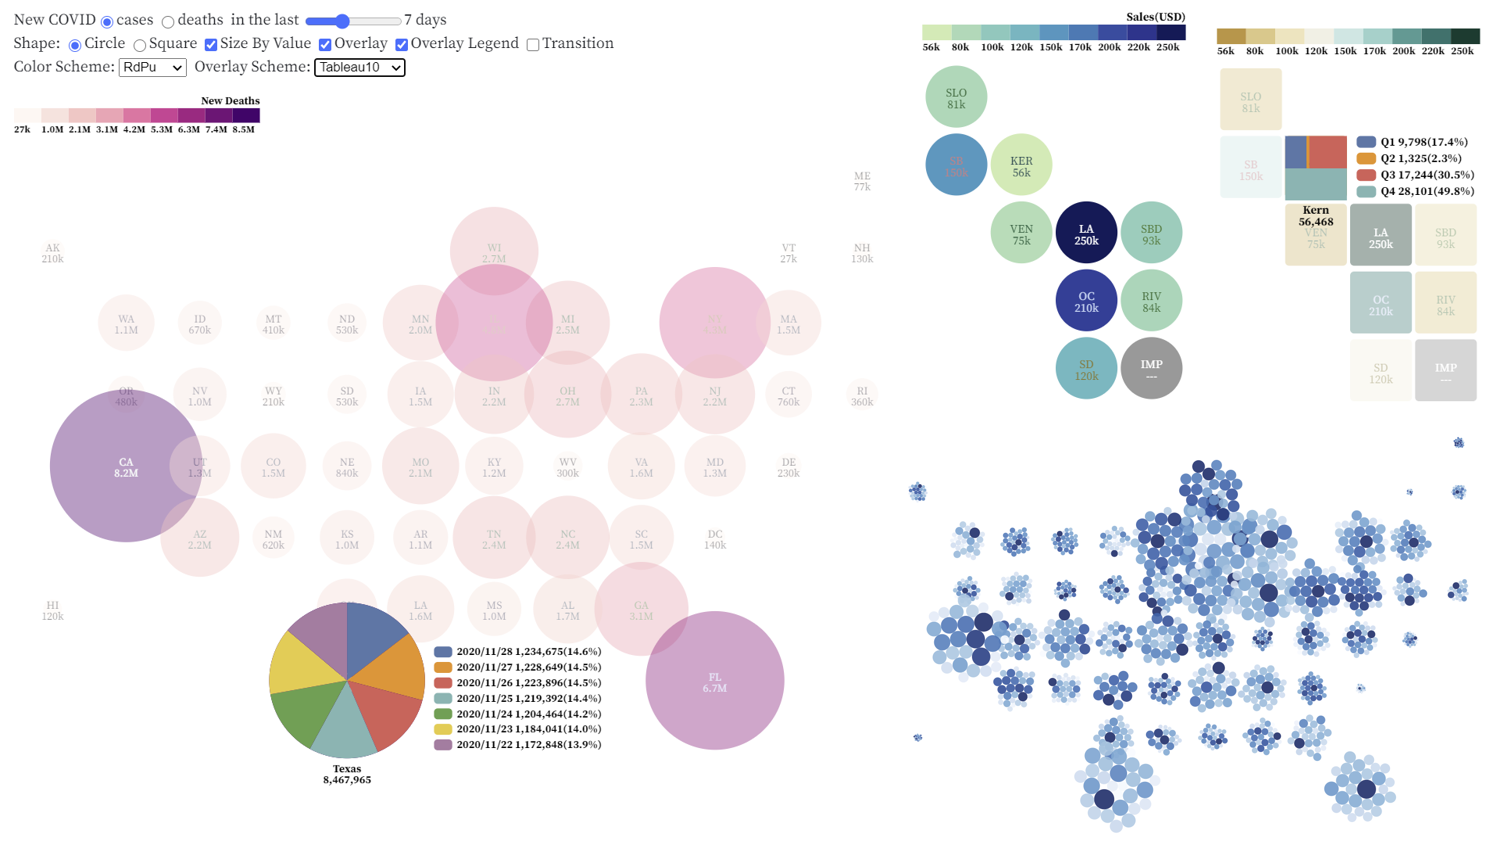
https://github.com/nobuf/grid-map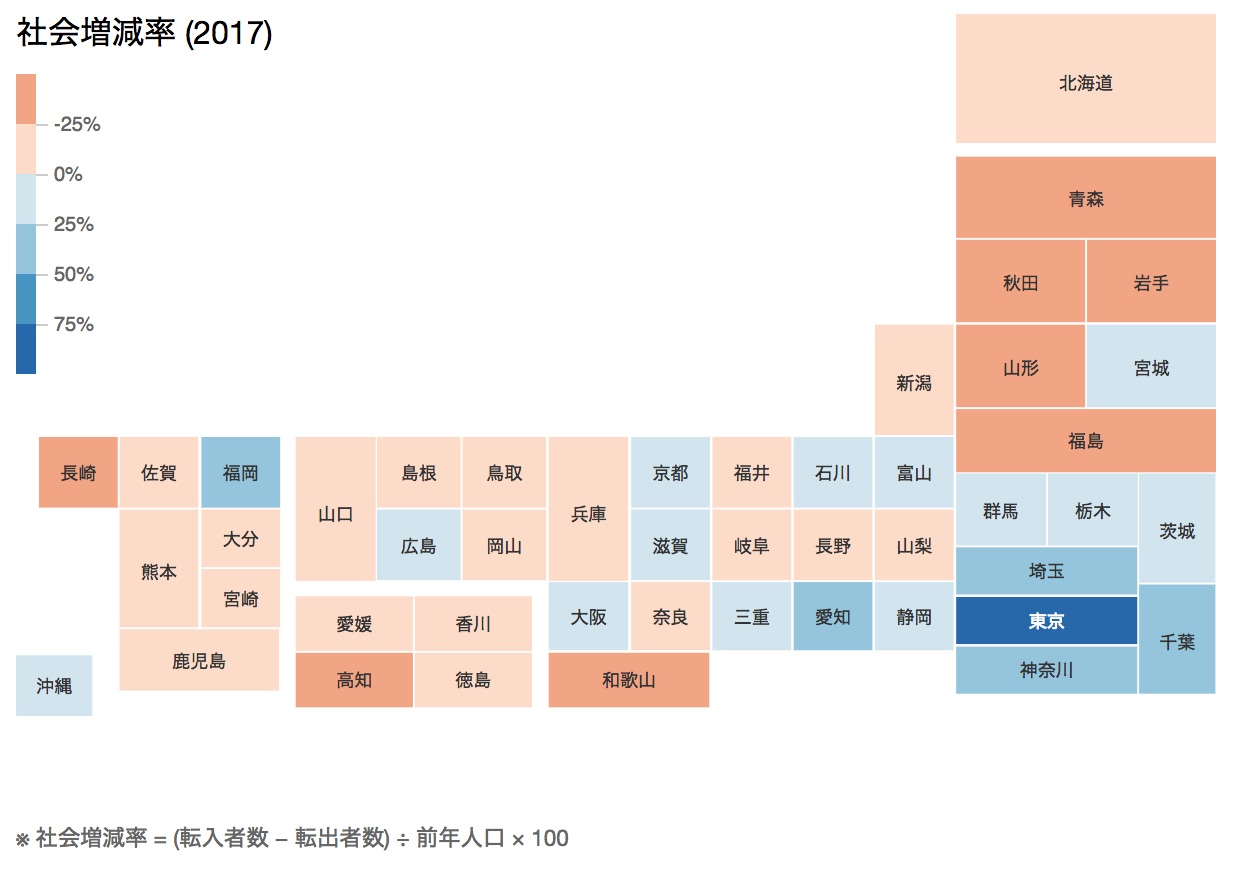
8、Visualization population distributed by latitude and longitude
https://engaging-data.com/population-latitude-longitude/

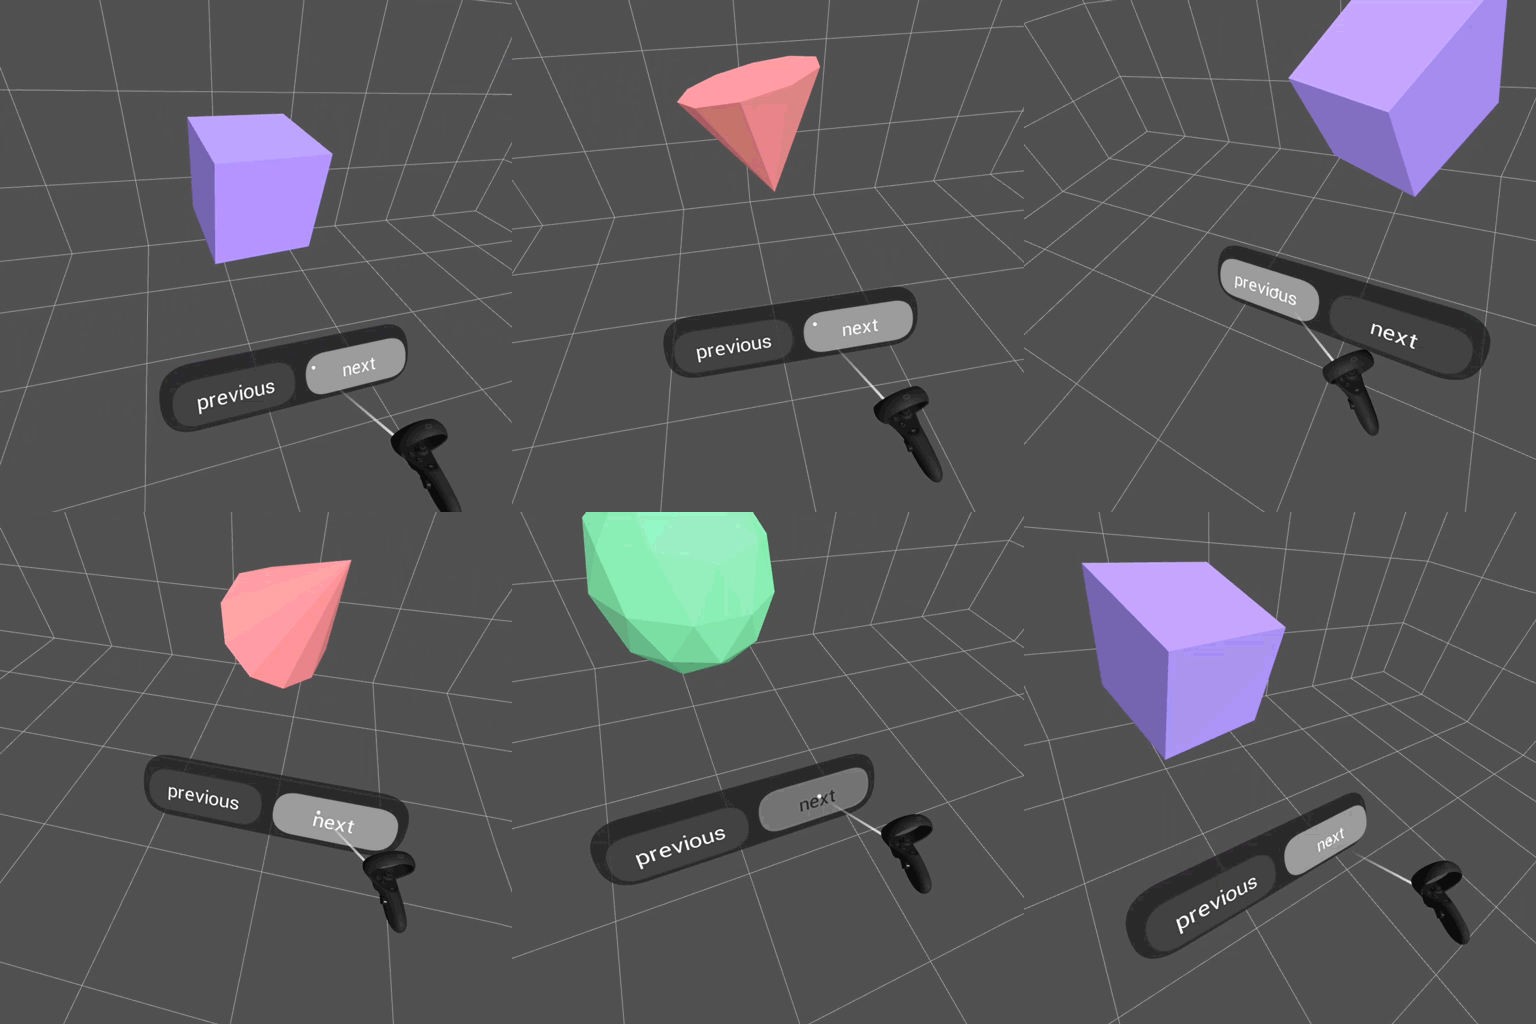
9、three-mesh-ui
Make VR user interfaces for Three.js
https://github.com/felixmariotto/three-mesh-ui
10、d3fc
https://github.com/d3fc/d3fc
A collection of components that make it easy to build interactive charts with D3
11、机器学习可视分析框架设计与实现
https://zhuanlan.zhihu.com/p/429837044
GIS
1、WebGIS中地理坐标与屏幕坐标间的转换原理
https://www.cnblogs.com/naaoveGIS/p/3930603.html
2、地图投影的「年终总结」:自适应地图投影的起源和技术原理
https://zhuanlan.zhihu.com/p/452589632
前端
1、granim.js
https://github.com/sarcadass/granim.js
Create fluid and interactive gradient animations with this small javascript library.
计算机基础
1、一个故事看懂CPU的SIMD技术
https://www.cnblogs.com/xuanyuan/p/16048303.html
前沿进展
1、Gartner Top 10 Data and Analytics Trends for 2021
https://www.gartner.com/smarterwithgartner/gartner-top-10-data-and-analytics-trends-for-2021
