1.概述
除了隔离依赖服务的调用以外,Hystrix还提供了准实时的调用监控(Hystrix Dashboard),Hystrix会持续地记录所有通过Hystrix发起的请求的执行信息,并以统计报表和图形的形式展示给用户,包括每秒执行多少请求多少成功,多少失败等。Netflix通过hystrix-metrics-event-stream项目实现了对以上指标的监控。Spring Cloud也提供了Hystrix Dashboard的整合,对监控内容转化成可视化界面。
2.新建服务监控工程
项目名称:cloud-consumer-hystrix-dashboard9001
鼠标点击父工程项目右击 —> New —> Module
具体创建步骤参考【搭建EurekaServer端服务注册中心】
2.1.添加pom.xml
<dependencies><!--新增hystrix dashboard--><dependency><groupId>org.springframework.cloud</groupId><artifactId>spring-cloud-starter-netflix-hystrix-dashboard</artifactId></dependency><dependency><groupId>org.springframework.boot</groupId><artifactId>spring-boot-starter-actuator</artifactId></dependency><dependency><groupId>org.springframework.boot</groupId><artifactId>spring-boot-devtools</artifactId><scope>runtime</scope><optional>true</optional></dependency><dependency><groupId>org.projectlombok</groupId><artifactId>lombok</artifactId><optional>true</optional></dependency><dependency><groupId>org.springframework.boot</groupId><artifactId>spring-boot-starter-test</artifactId><scope>test</scope></dependency></dependencies>
2.2.添加application.yml
server:
  port: 9001
2.3.添加主启动类
@EnableHystrixDashboard启用HystrixDashboard功能
@SpringBootApplication
@EnableHystrixDashboard
public class HystrixDashboard9001Application {

    public static void main(String[] args) {
        SpringApplication.run(HystrixDashboard9001Application.class, args);
    }

}
2.4.检查服务监控依赖配置
所有Provider微服务提供者(8001/8002/8004)都需要有如下监控依赖配置
<dependency>
    <groupId>org.springframework.boot</groupId>
    <artifactId>spring-boot-starter-actuator</artifactId>
</dependency>
2.5.启动
启动cloud-consumer-hystrix-dashboard9001
浏览器输入:http://localhost:9001/hystrix
会出现如下Hystrix Dashboard可视化界面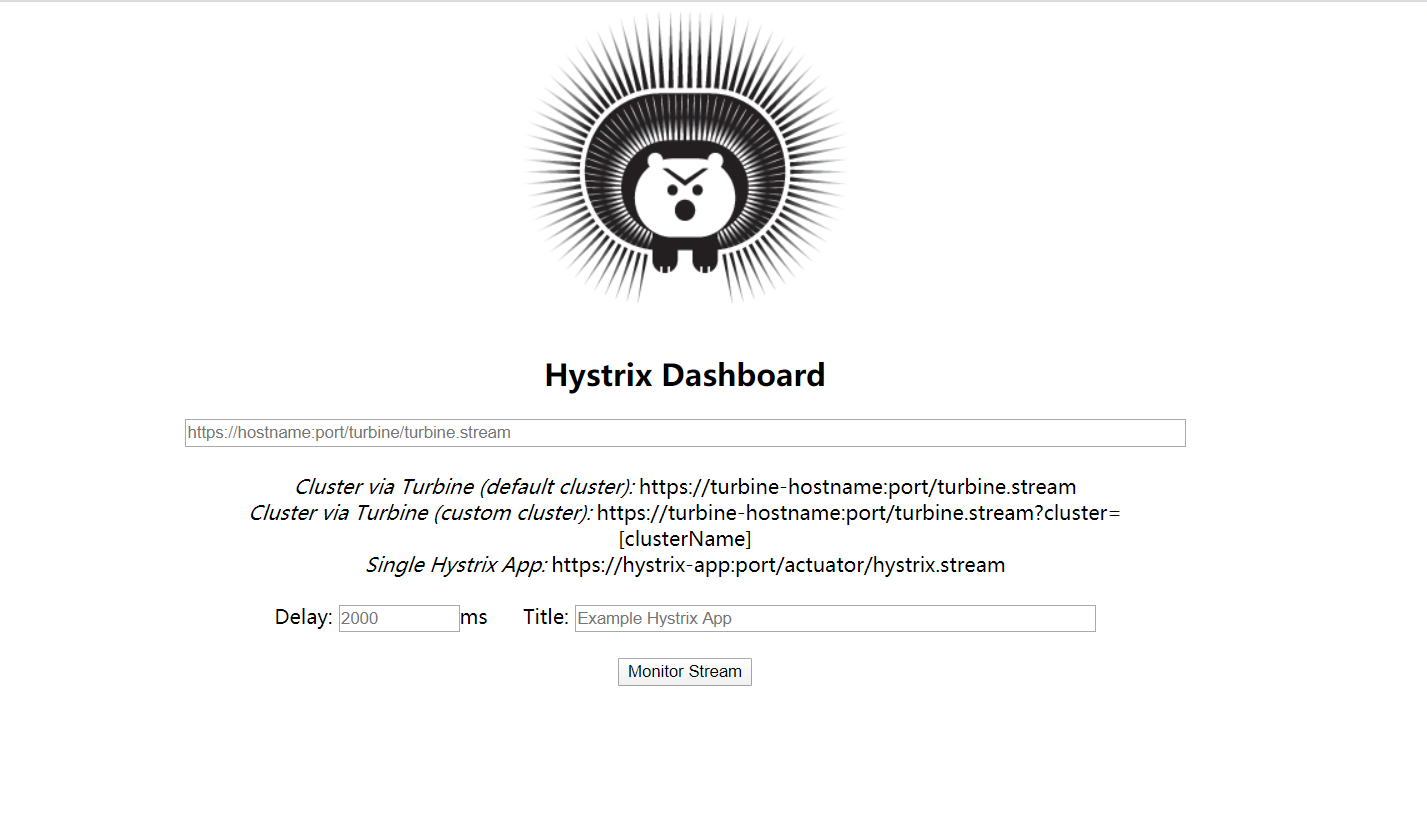
3.演示Hystrix Dashboard使用
修改cloud-provider-hystrix-payment8001
在PaymentHystrix8001Application主启动类中添加如下JavaBean配置
/**
 * 此配置是为了服务监控而配置,与服务容错本身无关,springcloud升级后的坑
 * ServletRegistrationBean因为springboot的默认路径不是"/hystrix.stream",
 * 只要在自己的项目里配置上下面的servlet就可以了
 */
@Bean
public ServletRegistrationBean getServlet() {
    HystrixMetricsStreamServlet streamServlet = new HystrixMetricsStreamServlet();
    ServletRegistrationBean registrationBean = new ServletRegistrationBean(streamServlet);
    registrationBean.setLoadOnStartup(1);
    registrationBean.addUrlMappings("/hystrix.stream");
    registrationBean.setName("HystrixMetricsStreamServlet");
    return registrationBean;
}
或者在application.yml配置文件添加如下内容:management.endpoints.web.exposure.include这个是用来暴露 endpoints 的。由于 endpoints 中会包含很多敏感信息,除了 health 和 info 两个支持 web 访问外,其他的默认不支持 web 访问。详情请看 50. Endpoints
management:
  endpoints:
    web:
      exposure:
        include: hystrix.stream # "*"
      # 跨域
      cors:
        allowed-origins: "*"
        allowed-methods: "*"
注意:上面两个配置添加一个即可
在Hystrix Dashboard可视化监控页面上添加监控的地址:
注意:如果上面采用的是JavaBean配置的这里填写的地址是:http://localhost:8001/hystrix.stream
如果是在application.yml配置文件中配置的这里填写的地址是:http://localhost:8001/actuator/hystrix.stream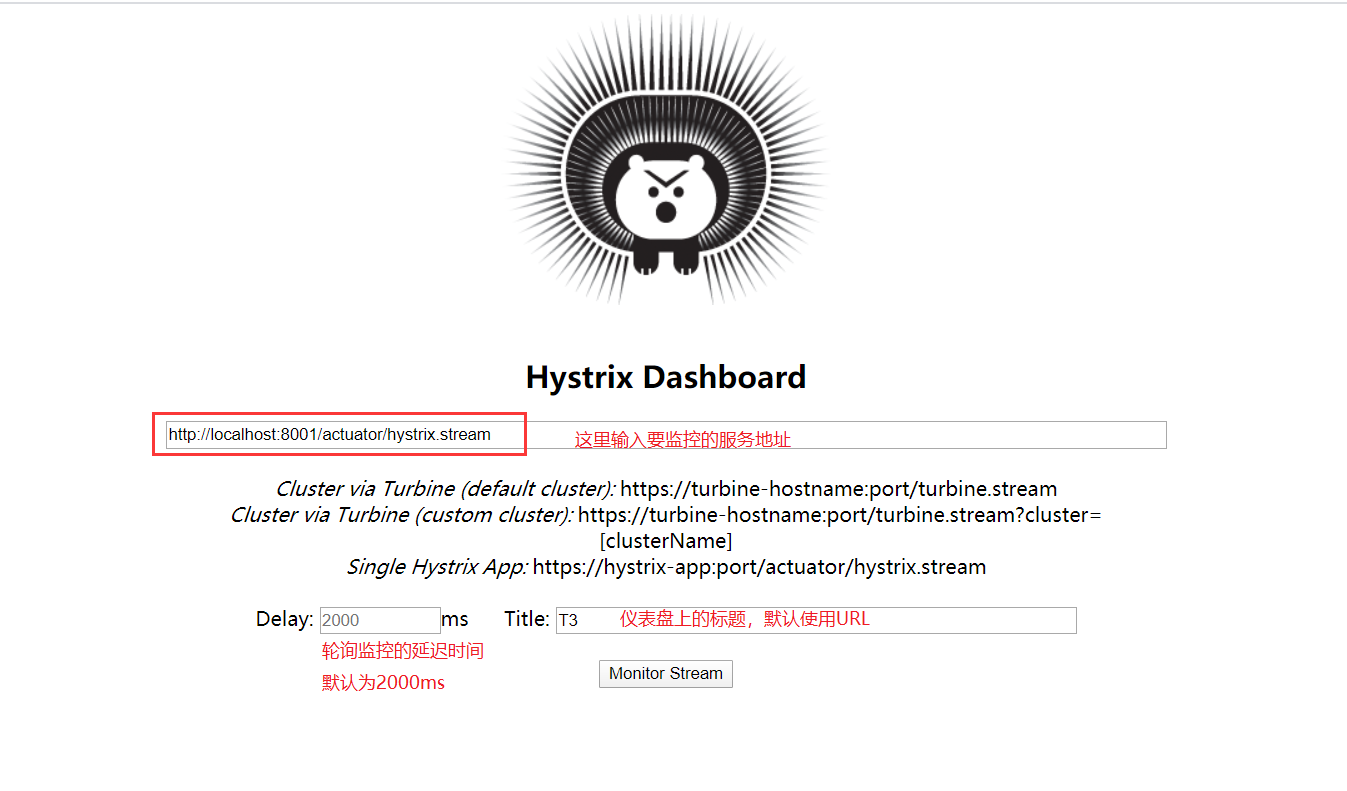
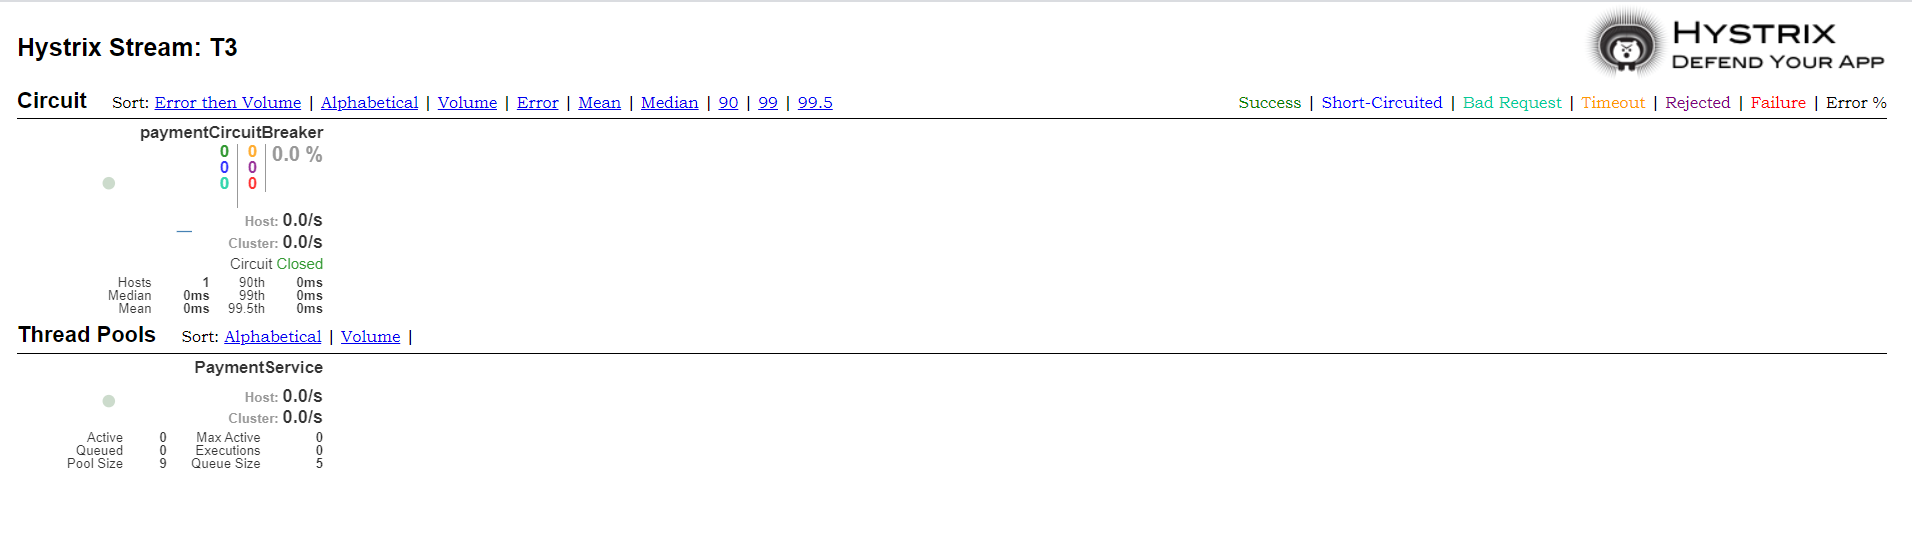
接着点击Monitor Stream按钮,然后出现如下界面
在浏览器输入如下两个地址:
正常请求地址,不会触发熔断:http://localhost:8001/payment/circuit/31
异常请求地址,会触发熔断:http://localhost:8001/payment/circuit/-31
浏览器连续发送多次正常的请求地址,然后观察Hystrix Dashboard监控界面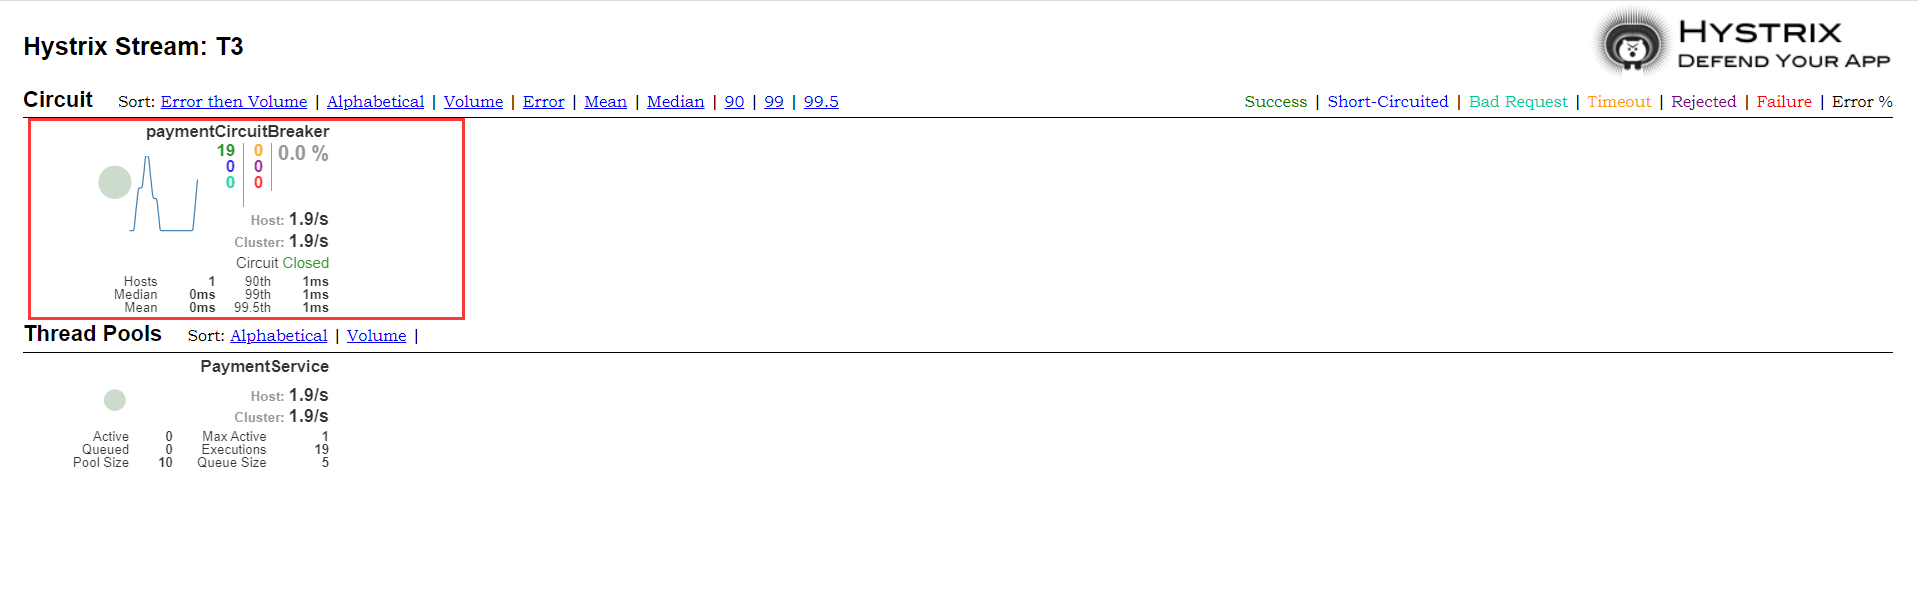
浏览器连续发送多次异常的请求地址,然后观察Hystrix Dashboard监控界面
可以看到请求失败率是**100.0%**, Circuit** Open 表示熔断器已经切换到了**开路状态(OPEN)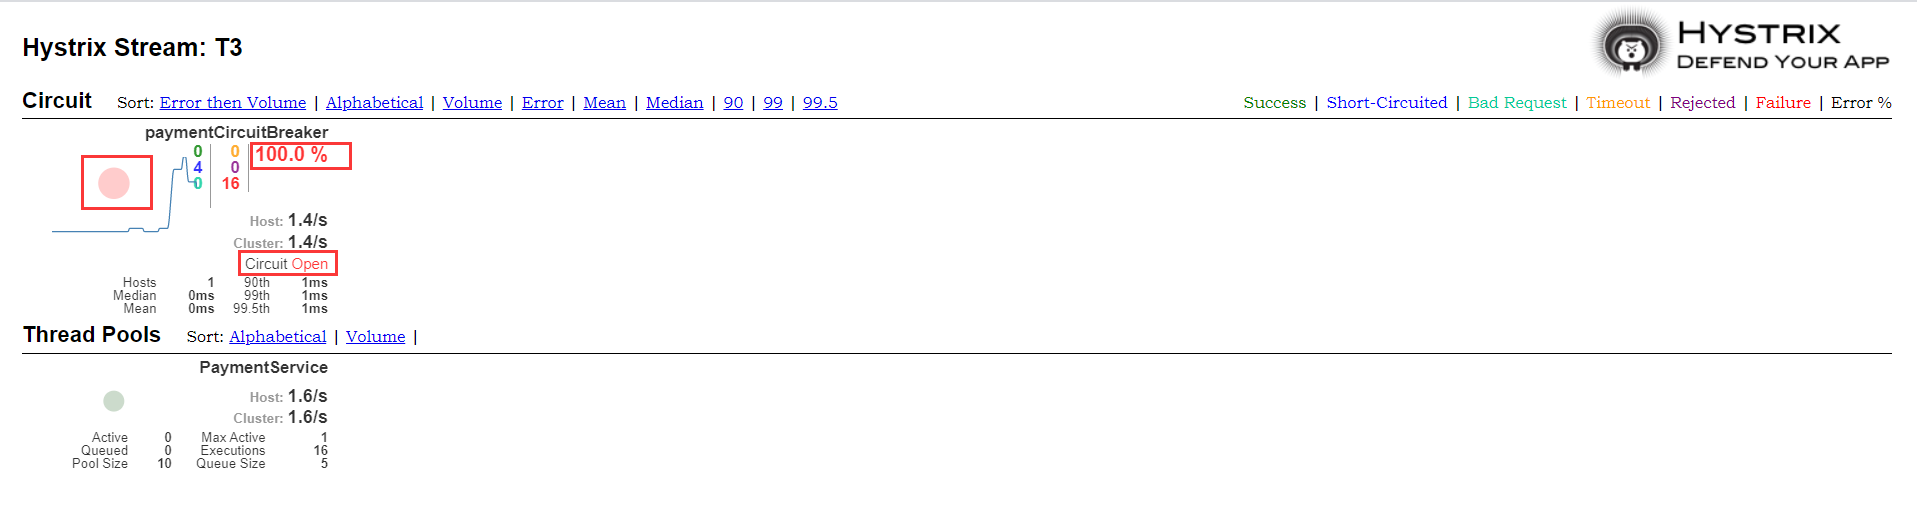
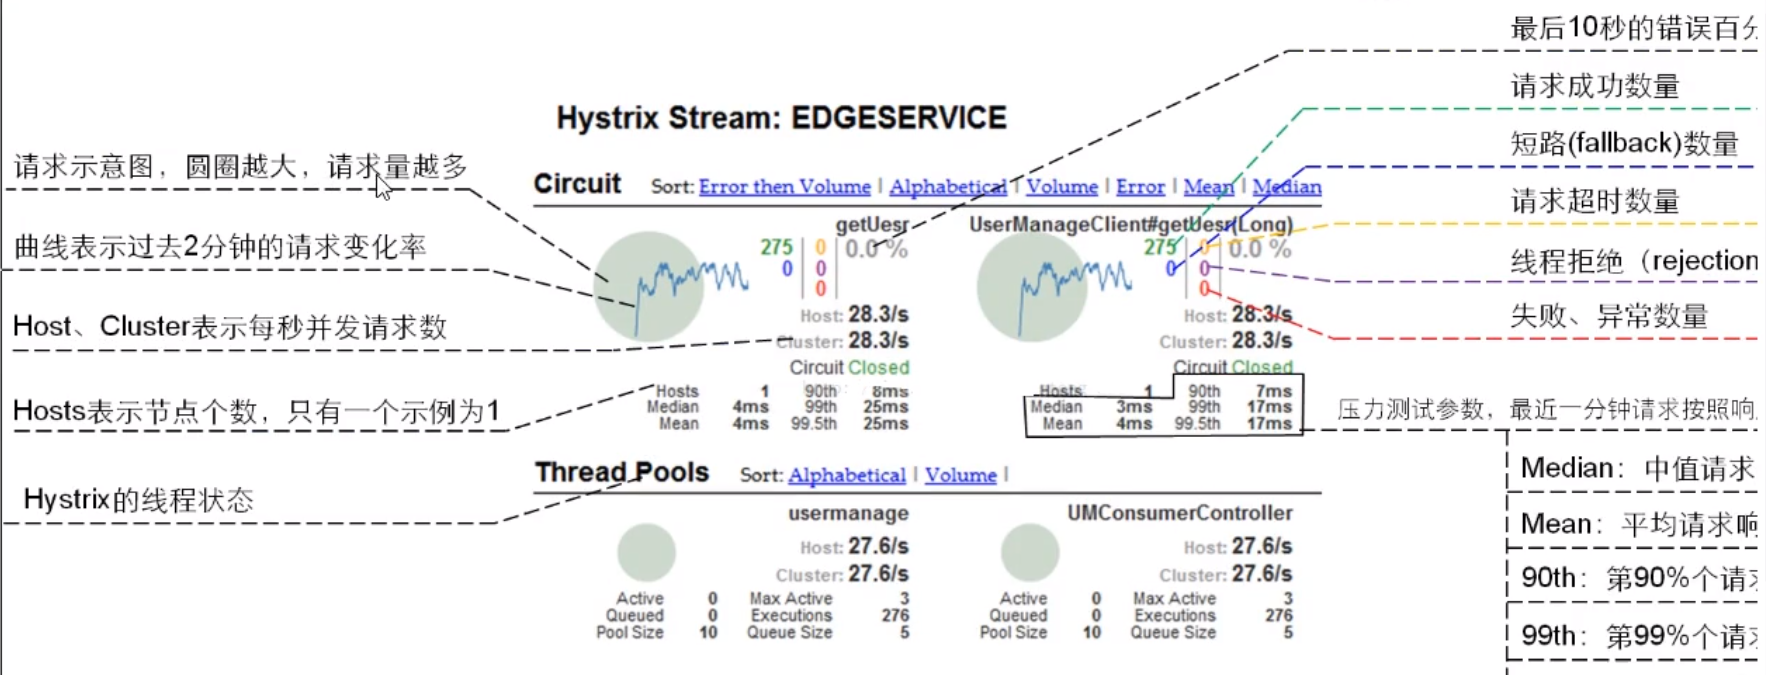
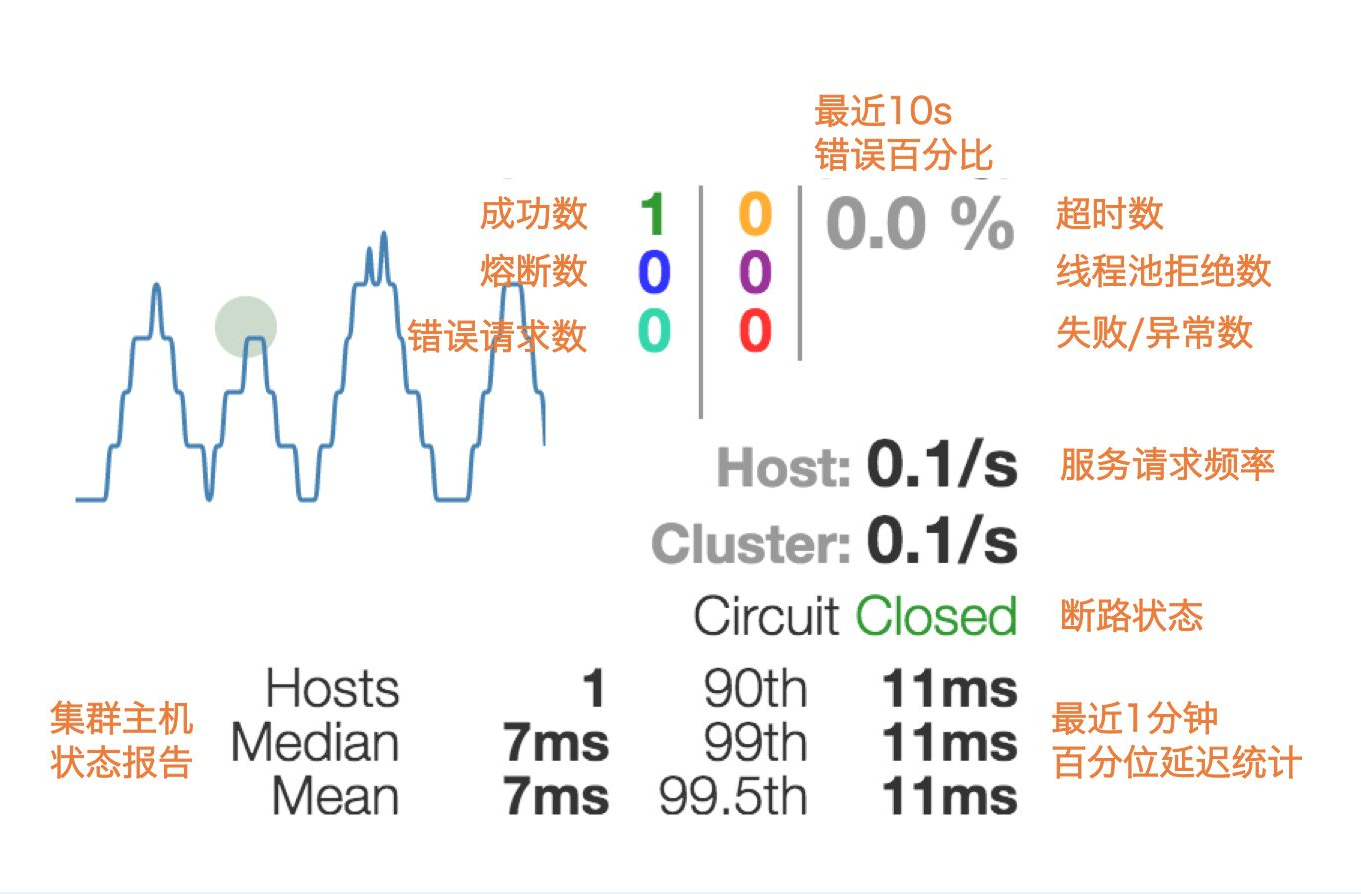
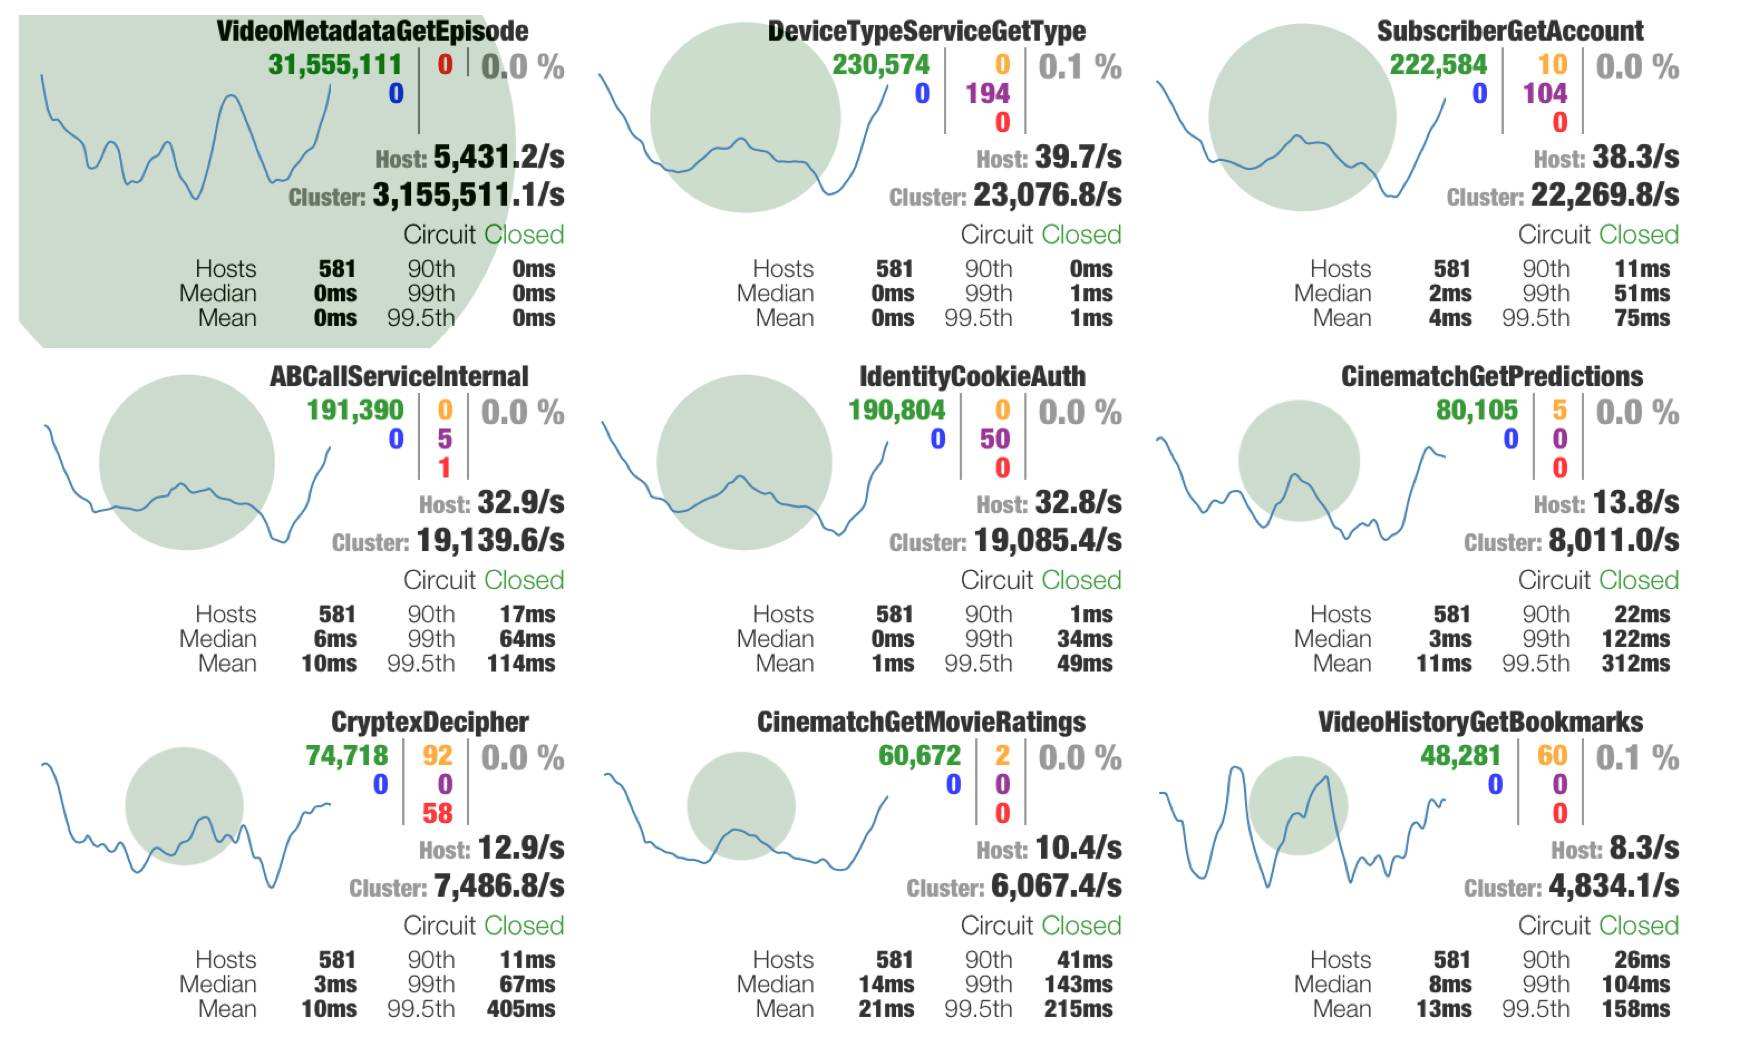
3.1.监控界面详情介绍
Hystrix Dashboard有七种颜色表示各种状态如下图: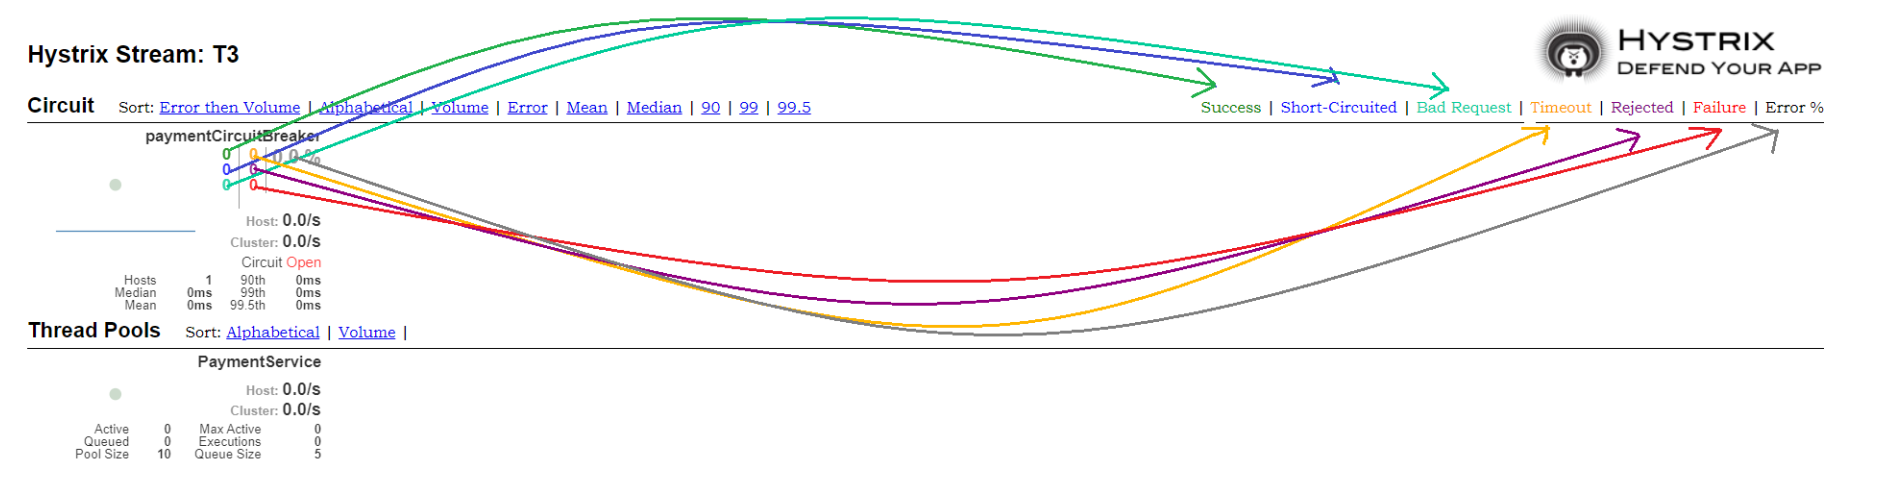
实心圆:共有两种含义。它通过颜色的变化代表了实例的健康程度,它的健康度从绿色<黄色<红色递减。
该实心圆除了颜色的变化之外,它的大小也会根据实例的请求流量发生变化,流量越大该实心圆就越大。所以通过该实心圆的展示,就可以在大量的实例中快速的发现故障实例和高压力实例。
曲线:用来记录2分钟内流量的相对变化,可以通过它来观察到流量的上升和下降趋势。

若有收获,就点个赞吧
0 人点赞
