- 断点设置
- import “ViewController.h”
- import “ViewController.h”
- breakpoint set -n “-[ViewController save:]” -n “-[ViewController pause:]” -n “-[ViewController continueGame:]”
- breakpoint list
- breakpoint disable 1
- breakpoint enable 1
- breakpoint disable 1.1
- breakpoint delete 1
- breakpoint delete
- breakpoint delete 4.1
- help breakpoint
- help breakpoint set
- breakpoint set -n touchesBegan:
- breakpoint set -r touchesBegan:
- breakpoint set —selector touchesBegan:withEvent:
- breakpoint set —file ViewController.m —selector touchesBegan:withEvent:
- b -r touchesBegan
- br dis 1
- br en 1
- br set -f ViewController.m -r touchesBegan
- expression self.view.subviews
- expression self.view.backgroundColor = [UIColor redColor]
- expression self.view.layer.backgroundColor = [UIColor yellowColor].CGColor
- import “ViewController.h”
- import “Person.h”
- import “ViewController.h”
- import “ViewController.h”
- frame variable
- c
- watchpoint set variable p1->_name
- c
- po 0x0000000102404088
- po 0x00000001024040a8
- p &p1->_name
- watchpoint set expression 0x0000000281e2ebb0
- c
- po 4371808392
- po 4371808424
- br set -f ViewController.m -r touchesBegan:
- br command add 3
- target stop-hook add -o “frame variable”
- target stop-hook list
- target stop-hook delete
lldb(Low Lever Debug):默认内置于Xcode中的动态调试工具。标准的lldb提供了一组广泛的命令,旨在与老版本的GDB命令兼容。 除了使用标准配置外,还可以很容易地自定义lldb以满足实际需要
lldb语法:
<command> [<subcommand> [<subcommand>...]] <action> [-options [option-value]] [argument [argument...]]
<command>(命令)和<subcommand>(子命令):lldb调试命令的名称<action>:执行命令的操作<options>:命令选项<arguement>:命令的参数[]:表示命令是可选的,可以有也可以没有示例:
breakpoint set -n test
command:breakpoint表示断点命令action:set表示设置断点option:-n表示根据方法name设置断点arguement:test表示方法名为tset
断点设置
日常开发中,最常用的是
Xcode断点
但是在逆向环境中,我们并没有第三方应用的源码,也不可能通过界面设置断点
这种情况,只能使用
breakpoint指令,在Xcode中lldb控制台,或直接在终端进行断点设置案例1:
breakpoint指令的使用打开
ViewController.m文件,写入以下代码:```
import “ViewController.h”
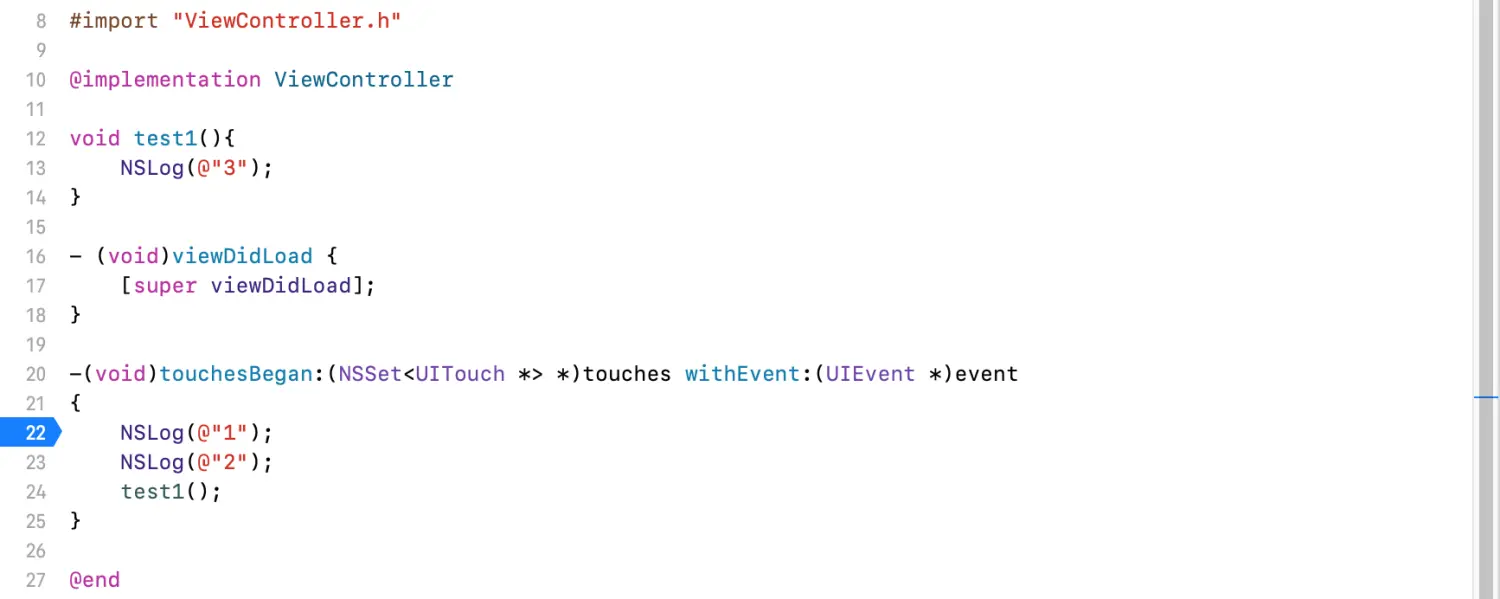
@implementation ViewController
void test1(){ NSLog(@”3”); }
- (void)viewDidLoad { [super viewDidLoad]; }
-(void)touchesBegan:(NSSet
@end
> 对`test1`函数设置断点>
breakpoint set -n test1
Breakpoint 2: where = 001—LLDB调试`test1 + 16 at ViewController.m:13:5, >address = 0x0000000102ef1cb4
> - 对符号设置断点> - `set`是子命令> - `-n`是选项,是`--name`的缩写> - 显示`Breakpoint 2`,说明在`001--LLDB调试`的进程中,设置的`第2个`断点,`第1个`是使用`Xcode`在`touchesBegan`中设置的> 案例2:> 对控制器的指定方法设置断点> 打开`ViewController.m`文件,写入以下代码:>
import “ViewController.h”
@implementation ViewController
(void)viewDidLoad { [super viewDidLoad]; }
(IBAction)save:(id)sender { NSLog(@”保存”); }
(IBAction)pause:(id)sender { NSLog(@”暂停”); }
(IBAction)continueGame:(id)sender { NSLog(@”继续”); }
@end
> 在逆向环境中,运行第三方程序,使用暂停可进入`lldb`控制台,相当于`Debug`进程附加<br />> 对`ViewController`中的多个符号设置断点>
breakpoint set -n “-[ViewController save:]” -n “-[ViewController pause:]” -n “-[ViewController continueGame:]”
Breakpoint 1: 3 locations.
> - `Breakpoint 1`表示`分组1`> - `3 locations`表示`分组1`下设置了`3个`断点> 使用`breakpoint list`查看断点>
breakpoint list
Current breakpoints:
1: names = {‘-[ViewController save:]’, ‘-[ViewController pause:]’, ‘-[ViewController continueGame:]’}, locations = 3, resolved = 3, hit count = 0
1.1: where = 001—LLDB调试-[ViewController save:] + 60 at ViewController.m:17:5, address = 0x0000000104995cd0, resolved, hit count = 0
1.2: where = 001--LLDB调试-[ViewController pause:] + 60 at ViewController.m:21:5, address = 0x0000000104995d28, resolved, hit count = 0
1.3: where = 001—LLDB调试`-[ViewController continueGame:] + 60 at ViewController.m:25:5, address = 0x0000000104995d80, resolved, hit count = 0
> 案例3:> 断点的禁用、启动和删除> 禁用断点>
breakpoint disable 1
1 breakpoints disabled.
> - 将`分组1`下的所有断点禁用> 启用断点>
breakpoint enable 1
1 breakpoints enabled.
> - 将`分组1`下的所有断点启用> 也可以对单一断点禁用或启用,例如:>
breakpoint disable 1.1
1 breakpoints disabled.
> 删除`分组1`下的所有断点>
breakpoint delete 1
1 breakpoints deleted; 0 breakpoint locations disabled.
> 删除全部断点>
breakpoint delete
About to delete all breakpoints, do you want to do that?: [Y/n] y All breakpoints removed. (1 breakpoint)
> 不支持删除某单一断点,例如:>
breakpoint delete 4.1
0 breakpoints deleted; 1 breakpoint locations disabled.
> 案例4:> 了解更多`breakpoint`指令> 使用`help`指令>
help breakpoint
Commands for operating on breakpoints (see 'help b' for shorthand.)
Syntax: breakpoint
The following subcommands are supported:
clear -- Delete or disable breakpoints matching the specified sourcefile and line.command -- Commands for adding, removing and listing LLDB commandsexecuted when a breakpoint is hit.delete -- Delete the specified breakpoint(s). If no breakpoints arespecified, delete them all.disable -- Disable the specified breakpoint(s) without deleting them. Ifnone are specified, disable all breakpoints.enable -- Enable the specified disabled breakpoint(s). If no breakpointsare specified, enable all of them.list -- List some or all breakpoints at configurable levels of detail.modify -- Modify the options on a breakpoint or set of breakpoints inthe executable. If no breakpoint is specified, acts on thelast created breakpoint. With the exception of -e, -d and -i,passing an empty argument clears the modification.name -- Commands to manage name tags for breakpointsread -- Read and set the breakpoints previously saved to a file with"breakpoint write".set -- Sets a breakpoint or set of breakpoints in the executable.write -- Write the breakpoints listed to a file that can be read inwith "breakpoint read". If given no arguments, writes allbreakpoints.
For more help on any particular subcommand, type ‘help
> 也可以了解更多选项的参数设置,例如:>
help breakpoint set
Sets a breakpoint or set of breakpoints in the executable.
Syntax: breakpoint set
Command Options Usage:
breakpoint set [-DHd] -l
> 案例5:> 对包含字符串的符号设置断点> 使用`breakpoint set -n`,对`touchesBegan`方法设置断点>
breakpoint set -n touchesBegan:
Breakpoint 5: no locations (pending). WARNING: Unable to resolve breakpoint to any actual locations.
> - 并没有设置上断点,因为完整的符号为`touchesBegan:withEvent:`> 使用`breakpoint set -r`,对包含`touchesBegan`的符号设置断点>
breakpoint set -r touchesBegan:
Breakpoint 7: 101 locations.
> 使用`breakpoint set --selector`,对项目内指定名称的`selector`设置断点>
breakpoint set —selector touchesBegan:withEvent:
Breakpoint 9: 96 locations.
> 案例6:> 指定文件设置断点> 使用`breakpoint set --file`,在指定文件内设置断点>
breakpoint set —file ViewController.m —selector touchesBegan:withEvent:
Breakpoint 2: where = 001—LLDB调试`-[ViewController touchesBegan:withEvent:] + 92 at ViewController.m:30:4, address = 0x0000000100745d44
> 案例7:> `lldb`强大的缩写功能> 对包含`touchesBegan`的符号设置断点>
b -r touchesBegan
Breakpoint 3: 105 locations.
> 查看断点的列表>
break list
> 更简单的写法:>
br list
> 对禁用断点`disable`选项的简写:>
br dis 1
1 breakpoints disabled.
> 对启用断点`enable`选项的简写:>
br en 1
1 breakpoints enabled.
#####代码执行> `expression`指令,用于执行代码,缩写指令为`p`、`exp`> 配合`p`指令使用的`po`指令,意思是`print object`,用于打印对象,本质上调用了对象的`description`> 案例1:> 使用`expression`指令执行代码> 对`ViewController`中的`touchesBegan`设置断点>
br set -f ViewController.m -r touchesBegan
Breakpoint 2: where = 001—LLDB调试`-[ViewController touchesBegan:withEvent:] + 92 at ViewController.m:30:4, address = 0x0000000102de5d44
> 点击屏幕,进入断点,使用`expression`指令执行代码>
expression self.view.subviews
(__NSArrayM *) $0 = 0x00000002822eaee0 @”3 elements”
> 案例2:> 设置背景色> 使用`expression`指令,设置`self.view`的背景色>
expression self.view.backgroundColor = [UIColor redColor]
error:
> - 报错,无法直接修改`backgroundColor`属性> 换一种方式,修改`layer`下的`backgroundColor`属性>
expression self.view.layer.backgroundColor = [UIColor yellowColor].CGColor
(CGColorRef) $7 = 0x00000002808a0d20
> 案例3:> 对数组追加元素> 打开`ViewController.m`文件,写入以下代码:>
import “ViewController.h”
import “Person.h”
@interface ViewController ()
@property(nonatomic, strong) NSMutableArray
@implementation ViewController
(void)viewDidLoad { [super viewDidLoad];
Person p1 = [[Person alloc] initWithName:@”one” age:1]; Person p2 = [[Person alloc] initWithName:@”two” age:2]; Person * p3 = [[Person alloc] initWithName:@”three” age:3];
[self.models addObject:p1]; [self.models addObject:p2]; [self.models addObject:p3]; }
-(void)touchesBegan:(NSSet
-(NSMutableArray
@end
> 对`ViewController`中的`touchesBegan`设置断点>
br set -f ViewController.m -r touchesBegan
Breakpoint 1: where = 001—LLDB调试`-[ViewController touchesBegan:withEvent:] + 84 at ViewController.m:33:25, address = 0x0000000100cc5a6c
> 点击屏幕,进入`touchesBegan`方法的断点,追加数组元素>
p [self.models addObject:[[Person alloc] initWithName:@”haha” age:4]]
> 使用`c`(`continue`)指令,继续执行>
c
001—LLDB调试[12107:2333568] models:(
“
> 输出的`models`数组中存储了`4个`对象,元素追加成功> 案例4:> 修改数组中对象的属性> 点击屏幕,进入`touchesBegan`方法的断点,获取数组的第一个元素>
p (Person *)self.models.firstObject
(Person *) $4 = 0x0000000281043640
> - `$4`为标号,代表`Person`对象,可以使用> 使用标号,修改对象`name`属性>
p $4.name=@”123”
(NSTaggedPointerString *) $5 = 0xb868e91f5b072f35 @”123”
> 验证`name`属性是否修改成功>
po self.models.firstObject
>
p ((Person *)0x281043640).name
(NSTaggedPointerString *) $10 = 0xb868e91f5b072f35 @”123”
> 案例5:> 执行多行代码> 点击屏幕,进入`touchesBegan`方法的断点> 通过`Option+Enter`进行换行,在`lldb`控制台写入以下代码:>
p Person * $tmp = self.models.firstObject; p $tmp.name = @”Zang”;
p $tmp.age = 18;
(NSTaggedPointerString *) $6 = 0x996ea49769521a4e @”Zang” (int) $7 = 18
> 案例6:> 其他流程控制的指令> 使用`c`(`continue`)指令,继续执行>
c
> 使用`n`(`next`)指令,单步运行,将子函数当做整体一步执行>
n
> 使用`s`指令,单步运行,遇到子函数会进去>
s
#####堆栈信息> 案例1:> 查看函数调用栈> 使用`bt`指令,查看函数调用栈<br />> - `*`指向当前的函数调用栈> 使用`up`指令,查看上一个函数>
up
frame #1: 0x0000000100151c68 001—LLDB调试`test1 at >ViewController.m:22:5
19 }
20
21 void test1(){
-> 22 test2();
^
23 }
24
25 void test2(){
> 同时`*`也指向上一个函数<br />> 使用`down`指令,查看下一个函数>
down
frame #0: 0x0000000100151c80 001—LLDB调试`test2 at >ViewController.m:26:4
23 }
24
25 void test2(){
-> 26 NSLog(@”test2”);
^
27 }
28
29 @end
> 使用`frame select`指令,选择指定函数>
frame select 10
frame #10: 0x000000019ef67480 UIKitCore__eventFetcherSourceCallback + 156
UIKitCore__eventFetcherSourceCallback:
-> 0x19ef67480 <+156>: ldr x0, [x19, #0x10]
0x19ef67484 <+160>: mov x1, x21
0x19ef67488 <+164>: bl 0x19c2d1e28
0x19ef6748c <+168>: mov x1, x0
> 使用上述指令,可以将断点定位到指定函数。它的作用可以查看函数的调用者,通过汇编代码分析参数的传递。但寄存器的环境并不会发生变化,数据保存的还是最后一个函数执行完毕的结果> 案例2:> 查看方法的参数和局部变量> 打开`ViewController.m`文件,写入以下代码:>
import “ViewController.h”
@implementation ViewController
- (void)viewDidLoad { [super viewDidLoad]; }
-(void)touchesBegan:(NSSet
-(void)lalala1:(NSString *)str{ [self lalala2:str]; }
-(void)lalala2:(NSString )str{ NSString str1 = @”Zang”; NSLog(@”%@:%@”,str1, str); }
@end
> 点击屏幕,进入`lalala2`方法的断点,使用`frame variable`指令,查看方法的参数和局部变量>
frame variable
(ViewController ) self = 0x0000000105506860 (SEL) _cmd = “lalala2:” (__NSCFConstantString ) str = 0x0000000104f94080 @”HAHA” (__NSCFConstantString *) str1 = 0x0000000104f940a0 @”Zang”
> 在逆向过程中,进入一个方法,最想看到的就是该方法的调用者、方法名称、参数等信息,我们可以使用`frame variable`指令进行查看。还可以配合`up`、`down`、`frame select`指令,查看调用栈中其他方法的信息> 案例3:> 修改方法的参数> 上述案例,点击屏幕,进入`lalala2`方法的断点> 使用`frame variable`指令,查看方法的参数和局部变量>
frame variable
(ViewController ) self = 0x0000000100708b60 (SEL) _cmd = “lalala2:” (__NSCFConstantString ) str = 0x0000000100124080 @”HAHA” (__NSCFConstantString *) str1 = 0x00000001001240a0 @”Zang”
> 使用`p`指令,修改`str`的值>
p str = @”COOL”
(NSTaggedPointerString *) $0 = 0xb4f673513386c4f4 @”COOL”
> 使用`c`指令,继续运行>
c
001—LLDB调试[13539:2617881] Zang:COOL
> 输出结果变为修改后的内容,只针对当前未执行完的方法有效。对于已经执行完的方法,修改里面的内容,并不影响最终的结果> 案例4:> 让方法直接返回,不执行里面的代码> 打开`ViewController.m`文件,写入以下代码:>
import “ViewController.h”
@implementation ViewController
- (void)viewDidLoad { [super viewDidLoad]; }
-(void)touchesBegan:(NSSet
-(void)check:(NSString *)str{
if([str isEqualToString:@”HOOK”]){ NSLog(@”有人HOOK我…”); exit(0); } }
@end
> 点击屏幕,进入`check`方法的断点> 使用`thread return`指令,让`check`方法直接返回,不执行里面的代码>
thread return
> 使用`frame variable`指令,查看`thread return`指令执行后的函数>
frame variable
(ViewController ) self = 0x0000000100e07ee0 (SEL) _cmd = “touchesBegan:withEvent:” (__NSSetM ) touches = 0x0000000283e4dbc0 1 element (UITouchesEvent *) event = 0x0000000280b61200
> - 已经回到`touchesBegan:withEvent:`方法> 使用`c`指令,继续运行>
c
001—LLDB调试[13574:2625998] 一切正常~
> - `check`方法直接返回,方法内验证`str`参数的代码没有被触发> `thread return`指令,可用于调试阶段,绕过指定方法> 使用场景:原本执行到某方法,执行就会中断。使用`thread return`指令绕过方法,如果可以正常执行,证明此方法为检测方法。后续可针对不同情况,选择`Method Swizzle`、`fishHook`、`InlineHook`对其进行`HOOK`,将方法直接`return`#####内存断点> 案例1:> 在对象的属性上设置断点> 对`p1`修改`name`属性时,设置断点<br />> 进入断点,使用`watchpoint`指令,在`p1`对象的`name`上设置断点>
watchpoint set variable p1->_name
Watchpoint created: Watchpoint 1: addr = 0x280207570 size = 8 state = enabled type = w declare @ ‘/Users/zang/Zang/Spark/LG/14/LLDB/001—LLDB调试/ViewController.m:13’ watchpoint spec = ‘p1->_name’ new value: 0x0000000102404088
> 使用`c`指令,继续运行>
c
Watchpoint 1 hit: old value: 0x0000000102404088 new value: 0x00000001024040a8
> 使用`po`指令>
po 0x0000000102404088
one
>
po 0x00000001024040a8
new
> 当调用`name`属性的`get/set`方法,都会触发此断点。可获取到`name`属性的原始值,和即将修改的值。配合`bt`指令,查看函数调用栈,可以跟踪`name`属性的修改是由哪个方法触发的> 案例2:> 对属性地址设置内存断点> 进入断点,获取`name`属性的地址>
p &p1->_name
(NSString **) $0 = 0x0000000281e2ebb0
> 使用`watchpoint`指令,对属性地址设置内存断点>
watchpoint set expression 0x0000000281e2ebb0
Watchpoint created: Watchpoint 1: addr = 0x281e2ebb0 size = 8 state = enabled type = w new value: 4371808392
> 使用`c`指令,继续运行>
c
Watchpoint 1 hit: old value: 4371808392 new value: 4371808424
> 使用`po`指令>
po 4371808392
one
>
po 4371808424
new
#####其他指令> 案例1:> 当分组下断点被触发,自动执行指令> 在`touchesBegan`方法设置断点>
br set -f ViewController.m -r touchesBegan:
Breakpoint 3: where = 001—LLDB调试`-[ViewController touchesBegan:withEvent:] + 84 at ViewController.m:20:26, address = 0x0000000104945a6c
> 对`分组3`断点,设置进入断点后的执行的指令>
br command add 3
Enter your debugger command(s). Type ‘DONE’ to end. >
> 输入指令>
frame variable DONE
使用`c`指令,继续运行c
点击屏幕,进入`touchesBegan`方法的断点,同时输出以下信息:frame variable (ViewController ) self = 0x0000000103507fc0 (SEL) _cmd = “touchesBegan:withEvent:” (__NSSetM ) touches = 0x0000000282cea2e0 1 element (UITouchesEvent ) event = 0x00000002819c6640 (Person ) p1 = 0x00000001e3fe2f18
案例2:当任何断点被触发,自动执行指令target stop-hook add -o “frame variable”
Stop hook #1 added.
查看`stop-hook`的指令列表target stop-hook list
Hook: 1 State: enabled Commands: frame variable
删除某一条指令target stop-hook delete 1
undisplay 1
删除全部指令target stop-hook delete
Delete all stop hooks?: [Y/n] y
禁用某一条指令target stop-hook disable 1
启用某一条指令target stop-hook enable 1
添加执行代码display self.view
- 等同于`expr -- self.view`对于`frame variable`指令,基本上每个断点触发后都要使用。但`lldb`每次启动都要重新配置命令,有没有一劳永逸的方法呢?案例3:配置`lldb`初始化文件在家目录下,存储了`lldb`的初始化文件cd / ls
`lldbinit`文件的作用,当`lldb`启动,就会加载此文件,执行文件内的指令使用`vi ~/.lldbinit`,写入以下指令:target stop-hook add -o “frame variable”
运行项目,`lldb`启动,输出以下内容:Stop hook #1 added.
进入`viewDidLoad`断点,输出以下内容:(ViewController *) self = 0x0000000135f093a0 (SEL) _cmd = “viewDidLoad” ```
总结
断点设置
breakpoint set -n xxx:对方法/函数名称设置断点breakpoint set -r xxx:对包含字符串的符号设置断点breakpoint set --selector xxx:对项目内指定名称的selector设置断点breakpoint set --file xxx:在指定文件中设置断点breakpoint list:查看断点列表breakpoint disable:禁用断点breakpoint enable:启用断点breakpoint delete:删除断点- 缩写:
break、br,设置断点可缩写指令:b代码执行
po指令:意思是print object,用于打印对象,本质上调用了对象的descriptionexpression指令:用于执行代码
◦ 缩写:exp、p
◦ 可以使用标号
◦ 可执行多行代码- 流程控制
◦c(continue)指令:继续执行
◦n(next)指令:单步运行,将子函数当做整体一步执行
◦ni指令:单步运行汇编级别
◦s指令:单步运行,遇到子函数会进去
◦si指令:单步运行可跳转指令内部,汇编级别
◦finish指令:直接走完当前方法,返回到上层frame堆栈信息
bt指令:查看函数调用栈up指令:查看上一个函数down指令:查看下一个函数frame select指令:选择指定函数frame variable指令:查看方法调用者、方法名称、参数和局部变量thread return指令:让方法直接返回,不执行里面的代码内存断点:
watchpoint指令,设置内存断点其他指令
br command add指令:给断点添加命令的命令target stop-hook add -o "xxx":每次stop的时候去执行一些命令,针对breadpoint、watchpoint- 配置
lldb初始化文件,当lldb启动,就会加载此文件,执行文件内的指令,一劳永逸
lldb更多文档

若有收获,就点个赞吧
0 人点赞
