gops (Go Process Status)是Go团队提供的命令行工具,它可以用来获取go进程运行时信息。
可以查看:
- 当前有哪些go语言进程,哪些使用gops的go进程
- 进程的概要信息
- 进程的调用栈
- 进程的内存使用情况
- 构建程序的Go版本
- 运行时统计信息
可以获取:
- trace
- cpu profile和memory profile
还可以:
import ( “log” “runtime” “time”
"github.com/google/gops/agent"
)
func main() { if err := agent.Listen(agent.Options{ Addr: “0.0.0.0:8848”, // ConfigDir: “/home/centos/gopsconfig”, // 最好使用默认 ShutdownCleanup: true}); err != nil { log.Fatal(err) }
// 测试代码_ = make([]int, 1000, 1000)runtime.GC()_ = make([]int, 1000, 2000)runtime.GC()time.Sleep(time.Hour)
}
<a name="kWnFn"></a>## agent Option选项agent有3个配置:- Addr:agent要监听的ip和端口,默认ip为环回地址,端口随机分配。- ConfigDir:该目录存放的不是agent的配置,而是每一个使用了agent的go进程信息,文件以pid命名,内容是该pid进程所监听的端口号,所以其中文件的目的是形成pid到端口的映射。默认值为~/.config/gops- ShutdownCleanup:进程退出时,是否清理ConfigDir中的文件,默认值为false,不清理通常可以把Addr设置为要监听的IP,把ShutdownCleanup设置为ture,进程退出后,残留在ConfigDir目录的文件不再有用,最好清除掉。<br />ConfigDir示例:```bash// gopsconfig为设置的ConfigDir目录,2051为pid,8848为端口号。➜ ~ cat gopsconfig/20518848%➜ ~ netstat -nap | grep `pgrep gopsexample`tcp6 0 0 :::8848 :::* LISTEN 2051/./gopsexample
gops原理
gops的原理是,代码中导入gops/agent,建立agent服务,gops命令连接agent读取进程信息。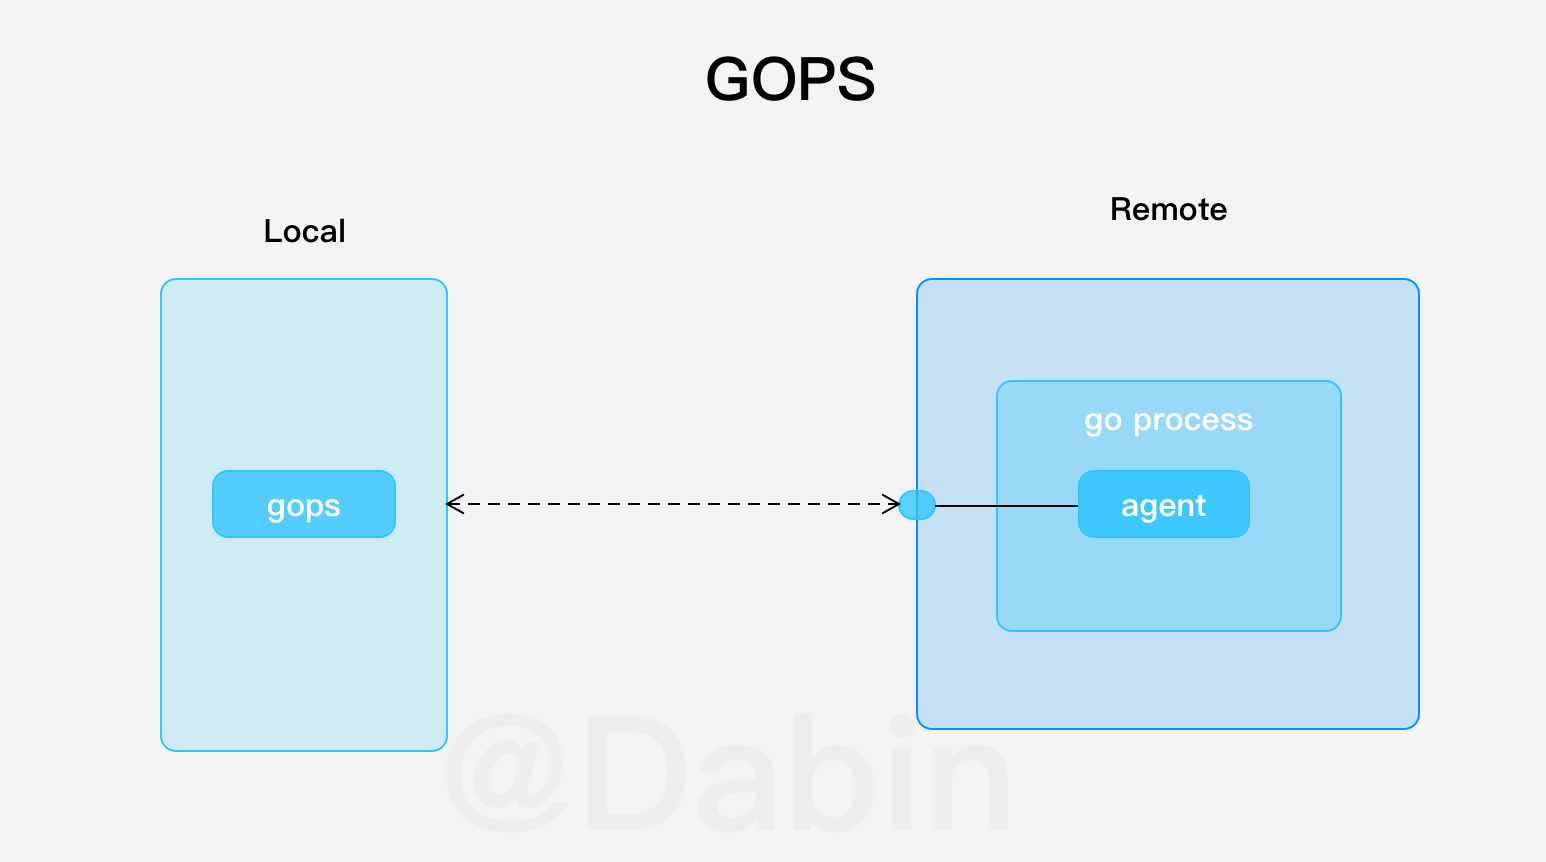
agent的实现原理可以查看agent/handle函数。
使用go标准库中原生接口实现相关功能,如同你要在自己的程序中开启pprof类似,只不过这部分功能由gops/agent实现了:
- 使用runtime.MemStats获取内存情况
- 使用runtime/pprof获取调用栈、cpu profile和memory profile
- 使用runtime/trace获取trace
- 使用runtime获取stats信息
- 使用runtime/debug、GC设置和启动GC
再谈ConfigDir。从源码上看,ConfigDir对agent并没有用途,对gops有用。当gops和ConfigDir在一台机器上时,即gops查看本机的go进程信息,gops可以通过其中的文件,快速找到agent服务的端口。能够实现:gops
如果代码中通过ConfigDir指定了其他目录,使用gops时,需要添加环境变量GOPS_CONFIG_DIR指向ConfigDir使用的目录。
子命令介绍
gops后面可以跟子命令,然后是pid或者远端地址。
也可以直接跟pid,查看本机进程信息。
➜ ~ gops help memstatsgops is a tool to list and diagnose Go processes.Usage:gops <cmd> <pid|addr> ...gops <pid> # displays process infogops help # displays this help messageCommands:stack Prints the stack trace.gc Runs the garbage collector and blocks until successful.setgc Sets the garbage collection target percentage.memstats Prints the allocation and garbage collection stats.version Prints the Go version used to build the program.stats Prints runtime stats.trace Runs the runtime tracer for 5 secs and launches "go tool trace".pprof-heap Reads the heap profile and launches "go tool pprof".pprof-cpu Reads the CPU profile and launches "go tool pprof".All commands require the agent running on the Go process."*" indicates the process is running the agent.
查看当前机器上go程序进程信息
查看当前机器上的go进程,可以列出pid、ppid、进程名、可执行程序所使用的go版本,以及可执行程序的路径。
➜ ~ gops67292 66333 gops * go1.13 /Users/shitaibin/Workspace/golang_step_by_step/gops/gops67434 65931 gops go1.13 /Users/shitaibin/go/bin/gops66551 1 gocode go1.11.2 /Users/shitaibin/go/bin/gocode137 1 com.docker.vmnetd go1.12.7 /Library/PrivilegedHelperTools/com.docker.vmnetd811 807 com.docker.backend go1.12.13 /Applications/Docker.app/Contents/MacOS/com.docker.backend807 746 com.docker.supervisor go1.12.13 /Applications/Docker.app/Contents/MacOS/com.docker.supervisor810 807 com.docker.driver.amd64-linux go1.12.13 /Applications/Docker.app/Contents/MacOS/com.docker.driver.amd64-linux
带的是程序中使用了gops/agent,不带的是普通的go程序。
go程序进程树
查看进程树:
➜ ~ gops tree...├── 66333│ └── [*] 67292 (gops) {go1.13}├── 1│ ├── 66551 (gocode) {go1.11.2}│ └── 137 (com.docker.vmnetd) {go1.12.7}├── 65931│ └── 67476 (gops) {go1.13}└── 746└── 807 (com.docker.supervisor) {go1.12.13}├── 811 (com.docker.backend) {go1.12.13}└── 810 (com.docker.driver.amd64-linux) {go1.12.13}
pid:进程概要信息
查看进程的概要信息,非gops进程也可以:
➜ ~ gops 67292parent PID: 66333threads: 7memory usage: 0.018%cpu usage: 0.000%username: shitaibincmd+args: ./gopselapsed time: 11:28local/remote: 127.0.0.1:54753 <-> :0 (LISTEN)➜ ~➜ ~ gops 807parent PID: 746threads: 28memory usage: 0.057%cpu usage: 0.003%username: shitaibincmd+args: /Applications/Docker.app/Contents/MacOS/com.docker.supervisor -watchdog fd:0elapsed time: 27-23:36:35local/remote: 127.0.0.1:54832 <-> :0 ()local/remote: *:53849 <-> :0 ()local/remote: 127.0.0.1:49473 <-> :0 (LISTEN)
stack:当前调用栈
查看使用gops的进程的调用栈:
➜ ~ gops stack 67292goroutine 19 [running]:runtime/pprof.writeGoroutineStacks(0x1197160, 0xc00009c028, 0x0, 0x0)/Users/shitaibin/goroot/src/runtime/pprof/pprof.go:679 +0x9druntime/pprof.writeGoroutine(0x1197160, 0xc00009c028, 0x2, 0x0, 0x0)/Users/shitaibin/goroot/src/runtime/pprof/pprof.go:668 +0x44runtime/pprof.(*Profile).WriteTo(0x1275c60, 0x1197160, 0xc00009c028, 0x2, 0xc00009c028, 0x0)/Users/shitaibin/goroot/src/runtime/pprof/pprof.go:329 +0x3dagithub.com/google/gops/agent.handle(0x1665008, 0xc00009c028, 0xc000014068, 0x1, 0x1, 0x0, 0x0)/Users/shitaibin/go/src/github.com/google/gops/agent/agent.go:185 +0x1abgithub.com/google/gops/agent.listen()/Users/shitaibin/go/src/github.com/google/gops/agent/agent.go:133 +0x2bfcreated by github.com/google/gops/agent.Listen/Users/shitaibin/go/src/github.com/google/gops/agent/agent.go:111 +0x364goroutine 1 [sleep]:runtime.goparkunlock(...)/Users/shitaibin/goroot/src/runtime/proc.go:310time.Sleep(0x34630b8a000)/Users/shitaibin/goroot/src/runtime/time.go:105 +0x157main.main()/Users/shitaibin/Workspace/golang_step_by_step/gops/example.go:15 +0xa3goroutine 18 [syscall]:os/signal.signal_recv(0x0)/Users/shitaibin/goroot/src/runtime/sigqueue.go:144 +0x96os/signal.loop()/Users/shitaibin/goroot/src/os/signal/signal_unix.go:23 +0x22created by os/signal.init.0/Users/shitaibin/goroot/src/os/signal/signal_unix.go:29 +0x41
memstats: 内存使用情况
查看gops进程内存使用情况:
➜ ~ gops memstats 67944alloc: 136.80KB (140088 bytes) // 当前分配出去未收回的内存总量total-alloc: 152.08KB (155728 bytes) // 已分配出去的内存总量sys: 67.25MB (70518784 bytes) // 当前进程从OS获取的内存总量lookups: 0mallocs: 418 // 分配的对象数量frees: 82 // 释放的对象数量heap-alloc: 136.80KB (140088 bytes) // 当前分配出去未收回的堆内存总量heap-sys: 63.56MB (66650112 bytes) // 当前堆从OS获取的内存heap-idle: 62.98MB (66035712 bytes) // 当前堆中空闲的内存量heap-in-use: 600.00KB (614400 bytes) // 当前堆使用中的内存量heap-released: 62.89MB (65945600 bytes)heap-objects: 336 // 堆中对象数量stack-in-use: 448.00KB (458752 bytes) // 栈使用中的内存量stack-sys: 448.00KB (458752 bytes) // 栈从OS获取的内存总量stack-mspan-inuse: 10.89KB (11152 bytes)stack-mspan-sys: 16.00KB (16384 bytes)stack-mcache-inuse: 13.56KB (13888 bytes)stack-mcache-sys: 16.00KB (16384 bytes)other-sys: 1.01MB (1062682 bytes)gc-sys: 2.21MB (2312192 bytes)next-gc: when heap-alloc >= 4.00MB (4194304 bytes) // 下次GC的条件last-gc: 2020-03-16 10:06:26.743193 +0800 CST // 上次GC的世界gc-pause-total: 83.84µs // GC总暂停时间gc-pause: 44891 // 上次GC暂停时间,单位纳秒num-gc: 2 // 已进行的GC次数enable-gc: true // 是否开始GCdebug-gc: false
stats: 运行时信息
查看运行时统计信息:
➜ ~ gops stats 68125goroutines: 3OS threads: 12GOMAXPROCS: 8num CPU: 8
trace
获取当前运行5s的trace信息,会打开网页:
➜ ~ gops trace 68125Tracing now, will take 5 secs...Trace dump saved to: /var/folders/5g/rz16gqtx3nsdfs7k8sb80jth0000gn/T/trace1164474312020/03/16 10:23:37 Parsing trace...2020/03/16 10:23:37 Splitting trace...2020/03/16 10:23:37 Opening browser. Trace viewer is listening on http://127.0.0.1:55480
cpu profile
获取cpu profile,并进入交互模式:
➜ ~ gops pprof-cpu 68125Profiling CPU now, will take 30 secs...Profile dump saved to: /var/folders/5g/rz16gqtx3nsdfs7k8sb80jth0000gn/T/profile431166544Binary file saved to: /var/folders/5g/rz16gqtx3nsdfs7k8sb80jth0000gn/T/binary765361519File: binary765361519Type: cpuTime: Mar 16, 2020 at 10:25am (CST)Duration: 30s, Total samples = 0No samples were found with the default sample value type.Try "sample_index" command to analyze different sample values.Entering interactive mode (type "help" for commands, "o" for options)(pprof)(pprof) topShowing nodes accounting for 0, 0% of 0 totalflat flat% sum% cum cum%
memory profile
获取memory profile,并进入交互模式:
➜ ~ gops pprof-heap 68125Profile dump saved to: /var/folders/5g/rz16gqtx3nsdfs7k8sb80jth0000gn/T/profile292136242Binary file saved to: /var/folders/5g/rz16gqtx3nsdfs7k8sb80jth0000gn/T/binary693335273File: binary693335273Type: inuse_spaceTime: Mar 16, 2020 at 10:27am (CST)No samples were found with the default sample value type.Try "sample_index" command to analyze different sample values.Entering interactive mode (type "help" for commands, "o" for options)(pprof)(pprof) tracesFile: binary693335273Type: inuse_spaceTime: Mar 16, 2020 at 10:27am (CST)-----------+-------------------------------------------------------bytes: 256kB0 compress/flate.(*compressor).initcompress/flate.NewWritercompress/gzip.(*Writer).Writeruntime/pprof.(*profileBuilder).buildruntime/pprof.profileWriter-----------+-------------------------------------------------------bytes: 64kB0 compress/flate.newDeflateFastcompress/flate.(*compressor).initcompress/flate.NewWritercompress/gzip.(*Writer).Writeruntime/pprof.(*profileBuilder).buildruntime/pprof.profileWriter-----------+-------------------------------------------------------
使用远程连接
agent的默认配置Option{},监听的是环回地址。
➜ ~ sudo netstat -nap | grep 414➜ ~ netstat -nap | grep `pgrep gopsexample`(Not all processes could be identified, non-owned process infowill not be shown, you would have to be root to see it all.)tcp 0 0 127.0.0.1:36812 0.0.0.0:* LISTEN 414/./gopsexample
修改程序,在Option中设置监听的地址和端口:
agent.Listen(agent.Options{Addr:"0.0.0.0:8848"})
在远程主机上重新编译、重启进程,确认进程监听的端口:
➜ ~ netstat -nap | grep `pgrep gopsexample`(Not all processes could be identified, non-owned process infowill not be shown, you would have to be root to see it all.)tcp6 0 0 :::8848 :::* LISTEN 887/./gopsexample
在本地主机上使用gops连接远端go进程,并查看数据:
➜ ~ gops stats 192.168.9.137:8848goroutines: 3OS threads: 9GOMAXPROCS: 4num CPU: 4
gops后面只能跟pid查看进程简要信息,不能跟ip和port查看远端go进程简要信息,这些简要信息可以通过子命令汇集起来。
➜ ~ gops 192.168.9.137:8848gops: unknown subcommand➜ ~➜ ~ gops version 192.168.9.137:8848go1.13

若有收获,就点个赞吧
0 人点赞
