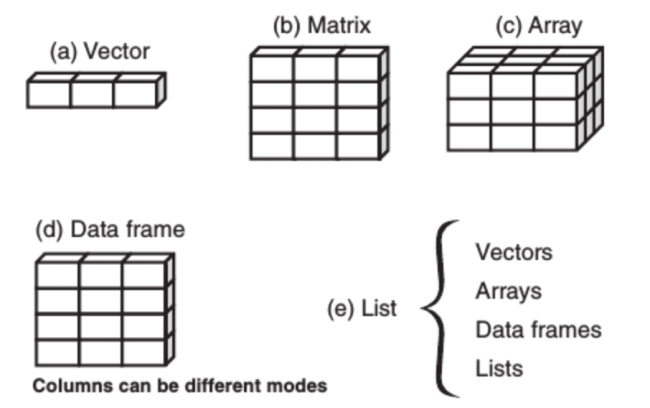
一、R语言数据类型分类与区别(学会区分⭐️⭐️)
1、向量(vector)——最基本数据类型
详见前一章
2、矩阵(matrice)——具有维度属性的向量,矩阵都是二维的,矩阵中也仅能包含一种数据类型
3、数组(array)——与矩阵类似,维度可大于二
4、列表(list)——可包含多种不同类型对象的向量,是一些对象的有序集合。
5、数据框(Data Frames)——是一种特殊的列表,其中所用元素长度都相等,列表中的每个元素都可以看作一列,每个元素的长度可以看作行数,每列只允许一种数据类型。(包容性更强)
二、数据框操作(使用频繁⭐️⭐️⭐️⭐️⭐️)
1、数据框来源
(1)在R中新建
(2)由已有数据转换或处理得到
(3)从文件中读取(如excel表)
(4)内置数据集(如iris)
2、新建与读取数据框(data.frame构建,把不同向量加进来)
#函数创建> df <- data.frame(gene = paste0("gene",1:4),+ change = rep(c("up","down"),each = 2),+ score = c(5,3,-2,-4))> dfgene change score1 gene1 up 52 gene2 up 33 gene3 down -24 gene4 down -4#文件读取> df2 <- read.csv("gene.csv")> df2
3、判断数据框属性(维度、行名列名)
dim(数据框名)nrow(df)#行数ncol(df)#列数rownames(df)#行名colnames(df)#列名
4、数据框取子集(中括号中“,”代表维度分割[行,列],若空缺代表全选,能使用函数表示就不手动输入)
> df$score # $符号选取列名操作[1] 5 3 -2 -4> mean(df$score) #对列(数值型)进行运算操作[1] 0.5> ## 按坐标(行,列)> df[2,2][1] "up"> df[2,]#数据类型data.frmaegene change score2 gene2 up 3> df[,2]#不写表示全选[1] "up" "up" "down" "down"> df[c(1,3),1:2]gene change1 gene1 up3 gene3 down> df[,ncol(df)]#能用函数的不手写[1] 5 3 -2 -4> df[,-ncol(df)]gene change1 gene1 up2 gene2 up3 gene3 down4 gene4 down> ## 按名字,等同于$列名> df[,"gene"][1] "gene1" "gene2" "gene3" "gene4"> df[,c('gene','change')]#(同时提取多列)gene change1 gene1 up2 gene2 up3 gene3 down4 gene4 down> ## 按条件(逻辑值)> df[df$score>0,]gene change score1 gene1 up 52 gene2 up 3> #筛选score>0的gene> df[df$score>0,1][1] "gene1" "gene2"
5、数据框修改(修改要赋值,否则白忙)⭐️⭐️注意[]中的“,”,否则可能报错(见错题!)
> #改一个格> df[3,3]<- 5> dfgene change score1 gene1 up 52 gene2 up 33 gene3 down 54 gene4 down -4> #改一整列> df$score<-c(12,23,50,2)> dfgene change score1 gene1 up 122 gene2 up 233 gene3 down 504 gene4 down 2> #新增一列名为p.value> df$p.value <-c(0.01,0.02,0.07,0.05)> dfgene change score p.value1 gene1 up 12 0.012 gene2 up 23 0.023 gene3 down 50 0.074 gene4 down 2 0.05> #改行名和列名> rownames(df) <- c("r1","r2","r3","r4")> colnames(df) <- c("a","b","d")> #只修改某一列的名,注意括号顺序> colnames(df)[2]="CHANGE"
6、数据框高端操作⭐️⭐️⭐️⭐️⭐️——merge函数
#数据框行数较多时,可以选择截取前/后任意行查看head(iris)head(iris,3)#查看前3行tail(iris)#行列数都多的数据框可取前几行前几列查看iris[1:3,1:3]#查看每一列的数据类型和具体内容str(数据框名)#去除含有缺失值的行na.omit(数据框名)#表格连接!!!(重点)———————merge(数据框1,数据框2,by=“连接条件(共同列名)”)> test1 <- data.frame(name = c('jimmy','nicker','Damon','Sophie'),+ blood_type = c("A","B","O","AB"))> test1name blood_type1 jimmy A2 nicker B3 Damon O4 Sophie AB> test2 <- data.frame(name = c('Damon','jimmy','nicker','tony'),+ group = c("group1","group1","group2","group2"),+ vision = c(4.2,4.3,4.9,4.5))> test2name group vision1 Damon group1 4.22 jimmy group1 4.33 nicker group2 4.94 tony group2 4.5> test3 <- data.frame(NAME = c('Damon','jimmy','nicker','tony'),+ weight = c(140,145,110,138))> merge(test1,test2,by="name")name blood_type group vision1 Damon O group1 4.22 jimmy A group1 4.33 nicker B group2 4.9> merge(test1,test3,by.x = "name",by.y = "NAME")#R语言区大小写!!!name blood_type weight1 Damon O 1402 jimmy A 1453 nicker B 110
merge函数解释:merge is a generic function whose principal method is for data frames: the default method coerces its arguments to data frames and calls the “data.frame” method. By default the data frames are merged on the columns with names they both have, but separate specifications of the columns can be given by by.x and by.y. The rows in the two data frames that match on the specified columns are extracted, and joined together.
三、矩阵操作——matrix函数(数据从上向下排列,数据长度应为矩阵行/列数整数倍,否则出现错误),矩阵不支持$取子集,矩阵可用来绘制热图
#矩阵创建> m <- matrix(1:9, nrow = 3)#matrix可以自定义ncol和nrow> m[,1] [,2] [,3][1,] 1 4 7[2,] 2 5 8[3,] 3 6 9> m <- matrix(1:4,ncol=6 );mWarning message:In matrix(1:4, ncol = 6) : 数据长度[4]不是矩阵列数[6]的整倍数 #warning不代表没错[,1] [,2] [,3] [,4] [,5] [,6][1,] 1 2 3 4 1 2#更改列/行名——向量赋值rownames(m) <- c("gene1","gene2","gene3","gene4")colnames(m) <- c("a","b","c")#矩阵取子集不支持$,只能[]m[2:3,1:2][,1] [,2][1,] 2 5[2,] 3 6#转置> t(m)[,1] [,2] [,3][1,] 1 2 3[2,] 4 5 6[3,] 7 8 9#转换为数据框——注意区别!> m <- matrix(1:9, nrow = 3);m;dim(m)[,1] [,2] [,3][1,] 1 4 7[2,] 2 5 8[3,] 3 6 9[1] 3 3> m1 <- as.data.frame(m);m1;dim(m1)V1 V2 V31 1 4 72 2 5 83 3 6 9[1] 3 3#绘制热图pheatmap::pheatmap(m)pheatmap::pheatmap(m,cluster_cols = F,cluster_rows = F)——关闭聚类
matrix函数解释:If one of nrow or ncol is not given, an attempt is made to infer it from the length of data and the other parameter. If neither is given, a one-column matrix is returned.
If there are too few elements in data to fill the matrix, then the elements in data are recycled(循环补齐). If data has length zero, NA of an appropriate type is used for atomic vectors (0 for raw vectors) and NULL for lists.
四、列表操作——list函数(大杂烩,把不同类型数据加进来),列表取子集记得[[]]⭐️
> l <- list(m=matrix(1:9, nrow = 3),+ df=data.frame(gene = paste0("gene",1:3),+ sam = paste0("sample",1:3),+ exp = c(32,34,45)),+ x=c(1,3,5))> l$m[,1] [,2] [,3][1,] 1 4 7[2,] 2 5 8[3,] 3 6 9$dfgene sam exp1 gene1 sample1 322 gene2 sample2 343 gene3 sample3 45$x[1] 1 3 5#取子集l[[2]]#列表取数据框l$df#names(m)判断列表名
五、错题重现⭐️⭐️⭐️
#提取test中,最后一列值为a或c的行,组成一个新的数据框,赋值给test2。!!!(使用%in%逻辑判断,注意[]中",")test2=test[test$Species %in% c("a","c"),]#统计iris最后一列有哪几个取值,每个取值重复了多少次table(iris[,ncol(iris)]) #table函数#提取iris的前10行,前4列,并转换为矩阵,赋值给aa=as.matrix(iris[1:10,1:4])#将a的行名改为flower1,flower2...flower10。rownames(a)=paste0("flower",1:nrow(a)) #paste函数创建连接#将a的第4到7行删除(提示:删除也是一种修改)a1=a[-(4:7),] #反选4:7行#将a的第1和第2行删除a1=a[-c(1,3),]


