By reading this article, you will learn how to use Merico to view the development heat map in the. The development heat map shows a member inDevelopment activity changes in all projects.To learn about changes in the activity of a developer in a code base/project, please go to Recent Development Trends; to learn about the development trend of the team in a single code base/project team, please go to Changes in Dev Equivalent .
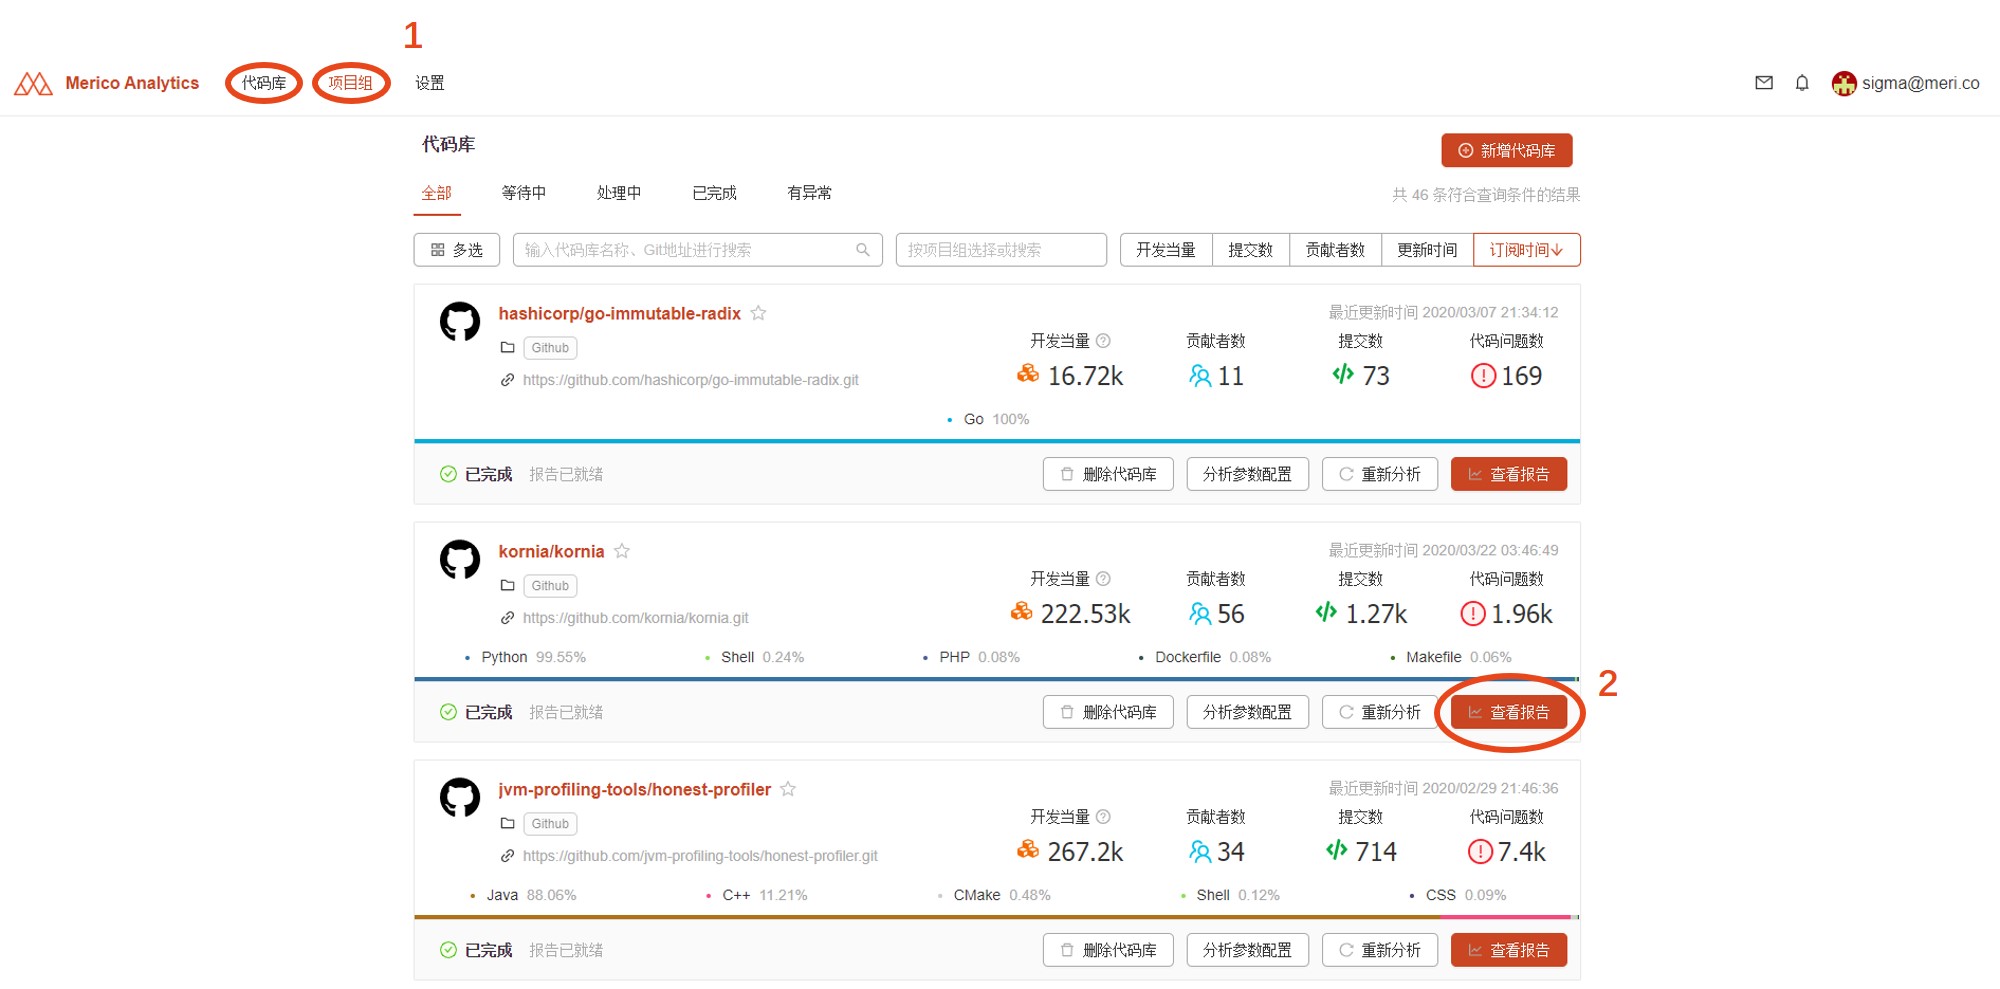
First in Repository/Project List, please find the repository/project in which the member you want to view is working on, and click View Report.
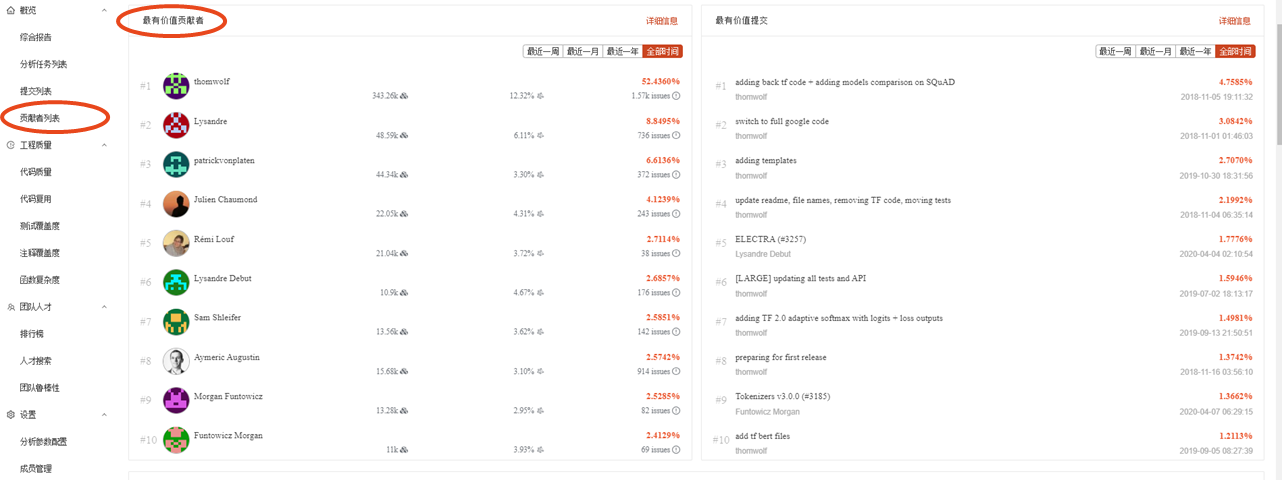
After entering the overview page, you can directly drop down and find The most valuable contributor List, which lists the top 10 developers in the code base/project group. You can also find Contributors in the navigation menu, which lists all contributors in this repository/project. Click on the developer you want to view to enter the detailed report page.
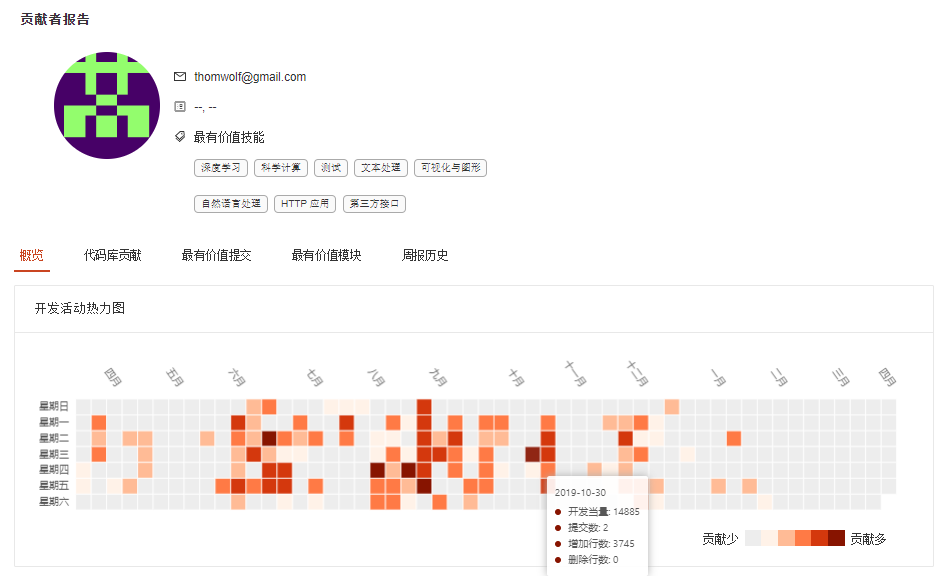
In the developer’s personal report page, you can view the heat map of his/her development activities. Each square corresponds to a day. You can hover mouse over a square to view development details about that day, including dev equivalent, number of submissions, lines of code changed, and more.
In contrast, the heat map focuses on finding the fluctuation law of Member activity from a long time range and all project data, thus helping managers planMore suitableThe working habits of developers. To viewMembers develop fluctuations in activity in a specific project and in a short period of time, so as to understand its recent work, please go to Recent Development Trends.

