By reading this article, you will learn how to use Merico to view your team’s development trends. If you need to know about changes of development equivalent by a single member, please go to Member’s Development Heat Map and Member’s Recent Development Trends. If you need to know the statistical principle of development equivalent, please go to What is development equivalent.
In the Repository/Project list, please find the one you want to view, and click View Report.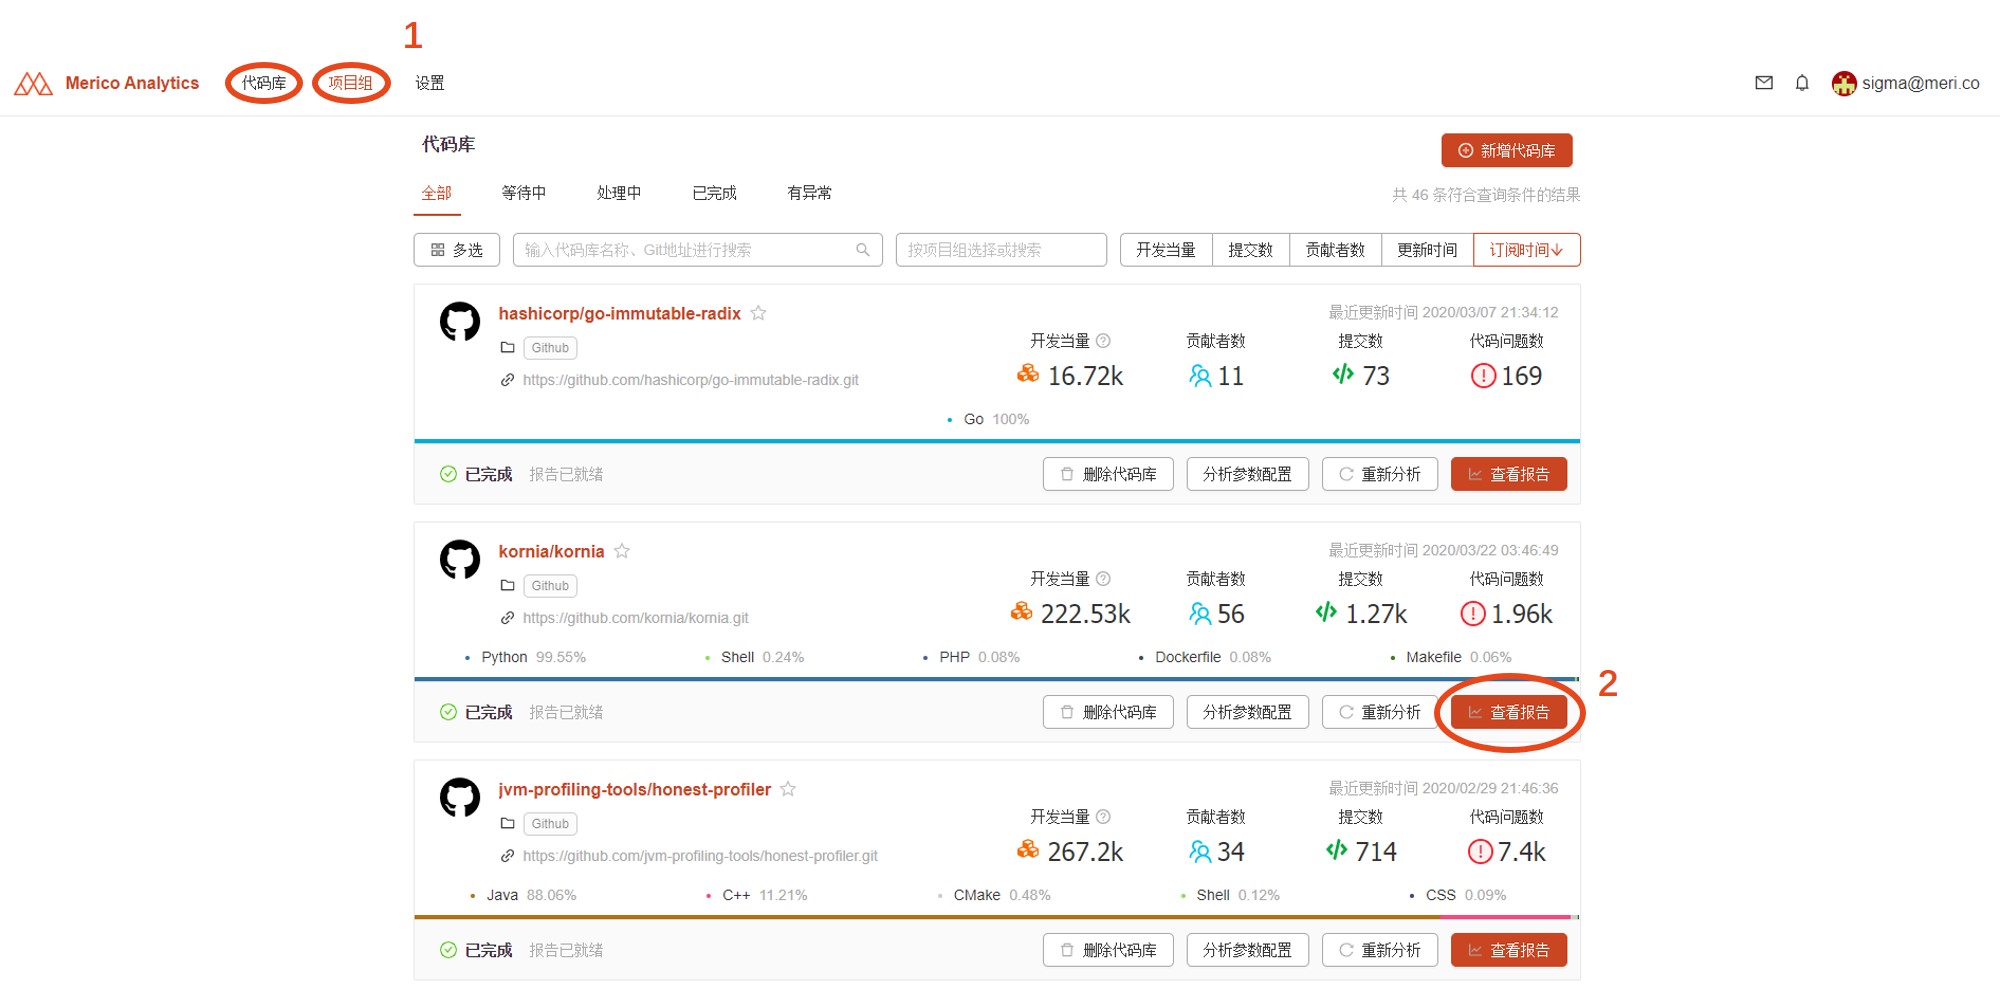
On the overview page, you can directly view the development equivalent history chart. The view displayed by default is the full history of the code baseCumulative equivalent, this view can clearly reflect the overall development speed of the project. Chart also shows the currentNon-repeating equivalent(To understand the definition of this indicator, please goWhat is development equivalent).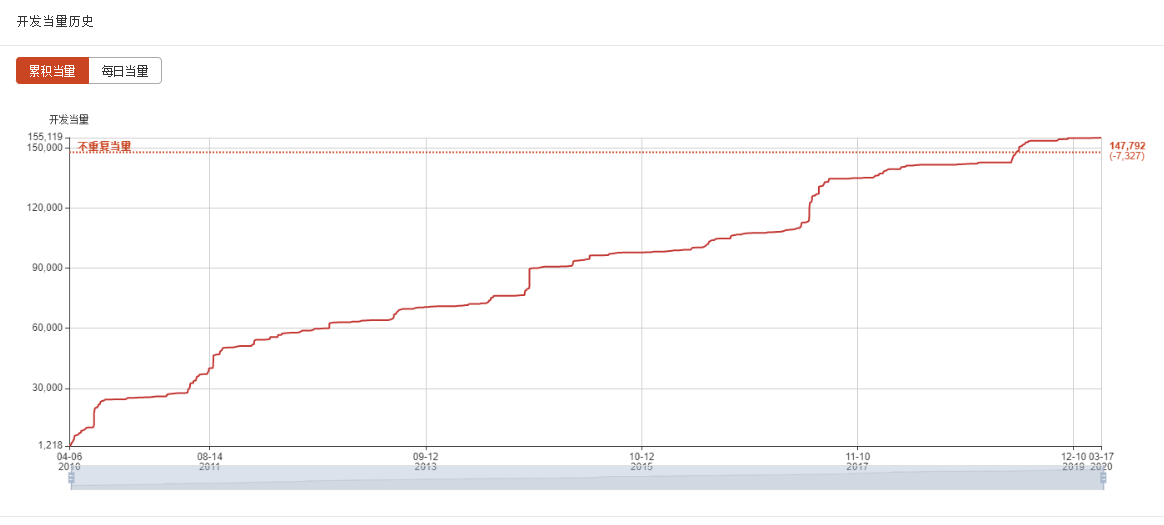 You may click on switch in the upper-left corner change the chart to Daily equivalent, this view focuses more on reflecting the daily increase or decrease of development equivalent.
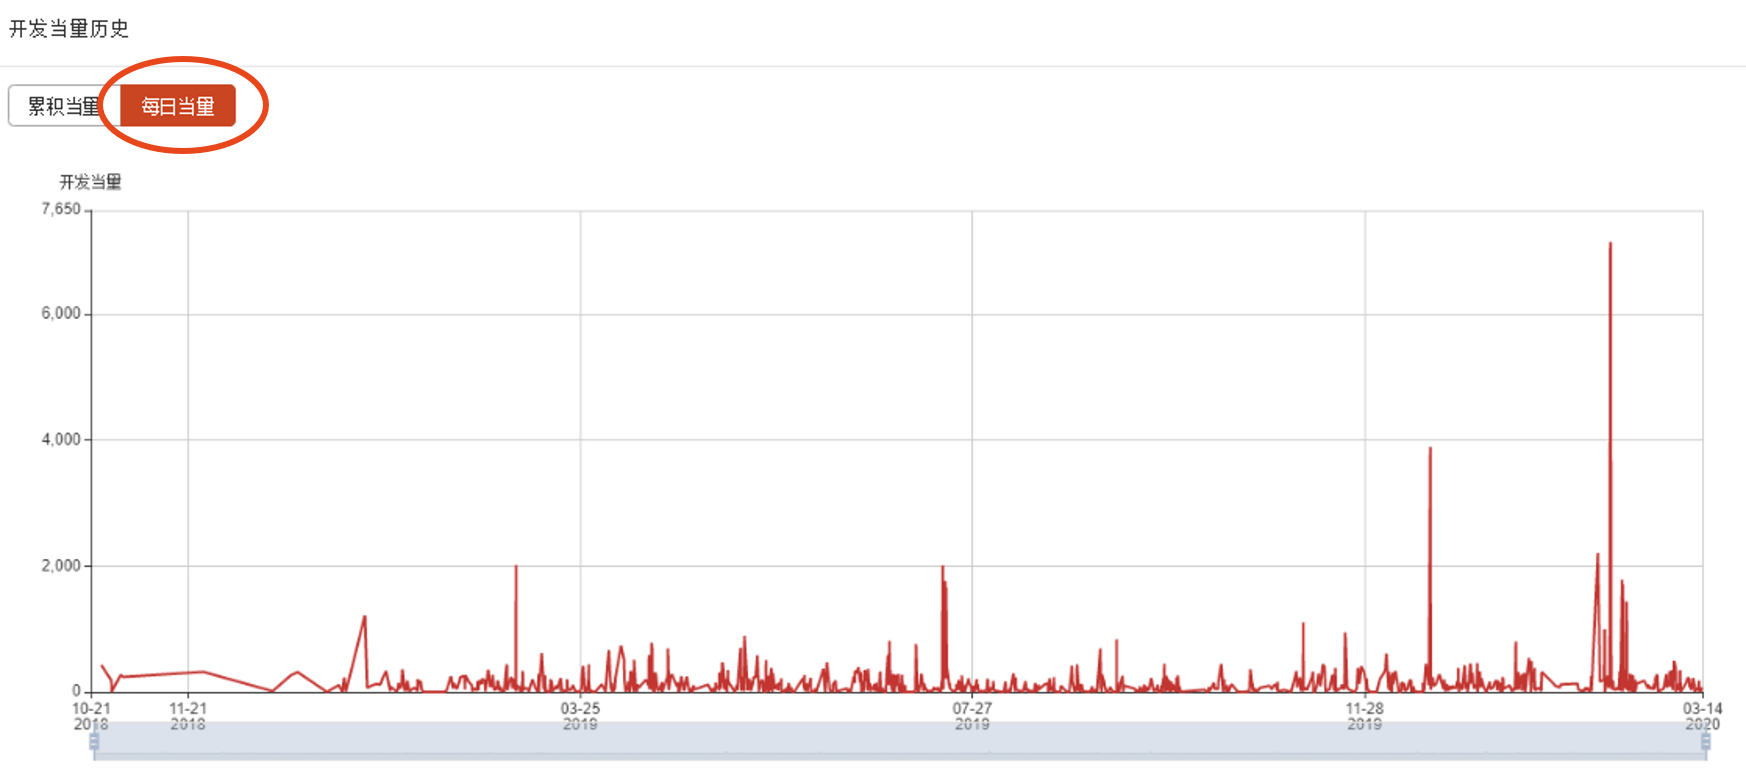
To view the development equivalent changes within a specific time range, you may drag the timeline below the chart to select any time period.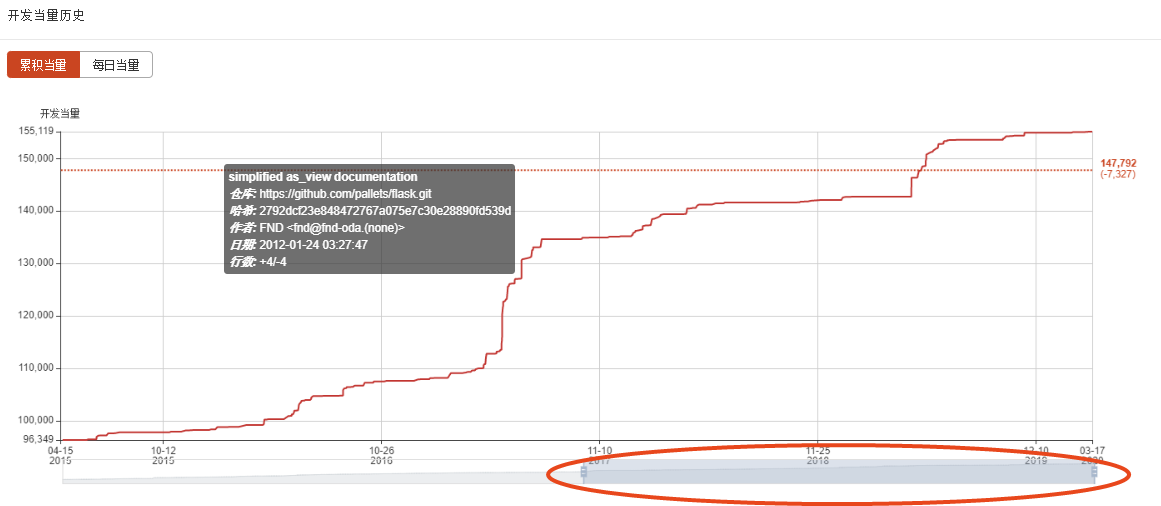

若有收获,就点个赞吧
0 人点赞
