
AntV X6(流程图的制作dome)
安装
通过 npm 或 yarn 命令安装 X6。
# npm$ npm install @antv/x6 --save# yarn$ yarn add @antv/x6
安装完成之后,使用 import 或 require 进行引用。
import { Graph } from '@antv/x6';
demo
<!--* @description:* @author: wanghao* @Date: 2022-03-01 20:36:46* @Modified By:* @version: 1.0.0--><template><div id="container">你好</div></template><script>import { Graph } from "@antv/x6";const data = {nodes: [{id: "node1",x: 40,y: 40,width: 100,height: 40,attrs: {body: {fill: "#2ECC71",stroke: "#000",strokeDasharray: "10,2",},label: {text: "Hello",fill: "#333",fontSize: 13,},},},{id: "node2",x: 180,y: 240,width: 100,height: 40,attrs: {body: {fill: "#F39C12",stroke: "#000",rx: 16,ry: 16,},label: {text: "World",fill: "#333",fontSize: 18,fontWeight: "bold",fontVariant: "small-caps",},},},],edges: [{source: "node1",target: "node2",attrs: {line: {stroke: "orange",},},},],};export default {name: "index",mounted() {this.init();},methods: {init() {// 渲染画布const graph = new Graph({container: document.getElementById("container"),width: 800,height: 600,background: {color: "pink", // 设置画布背景颜色},grid: {size: 20, // 网格大小 10pxvisible: true, // 渲染网格背景},});graph.fromJSON(data);},},};</script>
开始使用
接下来我们就一起来创建一个最简单的 Hello —> World 应用。
Step 1 创建容器
在页面中创建一个用于容纳 X6 绘图的容器,可以是一个 div 标签。
<div id="container"></div>
Step 2 准备数据
X6 支持 JSON 格式数据,该对象中需要有节点 nodes 和边 edges 字段,分别用数组表示:
const data = {// 节点nodes: [{id: 'node1', // String,可选,节点的唯一标识x: 40, // Number,必选,节点位置的 x 值y: 40, // Number,必选,节点位置的 y 值width: 80, // Number,可选,节点大小的 width 值height: 40, // Number,可选,节点大小的 height 值label: 'hello', // String,节点标签},{id: 'node2', // String,节点的唯一标识x: 160, // Number,必选,节点位置的 x 值y: 180, // Number,必选,节点位置的 y 值width: 80, // Number,可选,节点大小的 width 值height: 40, // Number,可选,节点大小的 height 值label: 'world', // String,节点标签},],// 边edges: [{source: 'node1', // String,必须,起始节点 idtarget: 'node2', // String,必须,目标节点 id},],};
Step 3 渲染画布
首先,我们需要创建一个 Graph 对象,并为其指定一个页面上的绘图容器,通常也会指定画布的大小。
import { Graph } from '@antv/x6';// 使用 CDN 引入时暴露了 X6 全局变量// const { Graph } = X6const graph = new Graph({container: document.getElementById('container'),width: 800,height: 600,});
如果是通过 script 标签引入方式,我们的 Graph 对象是挂载在 X6 这个全局变量下面:
<script src="https://unpkg.com/@antv/x6/dist/x6.js"></script><script>const graph = new X6.Graph({container: document.getElementById('container'),width: 800,height: 600,});</script>
然后,我们就可以使用刚刚创建的 graph 来渲染我们的节点和边。
graph.fromJSON(data)
到此,我们就得到一个最简单的 Hello —> World 示例,看下面的完整代码。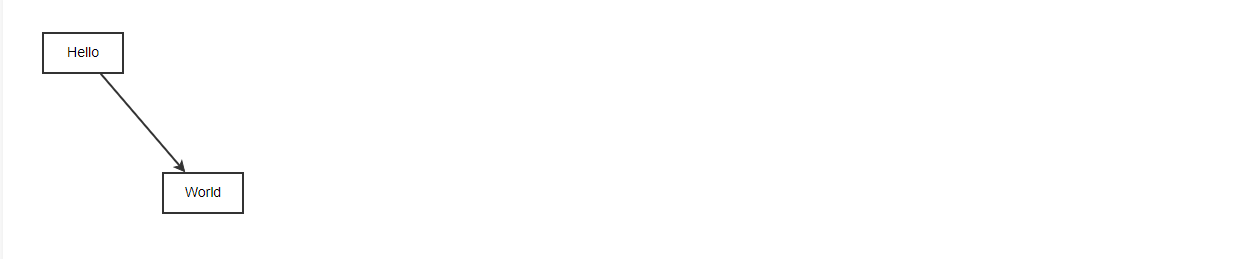
画布
背景和网格
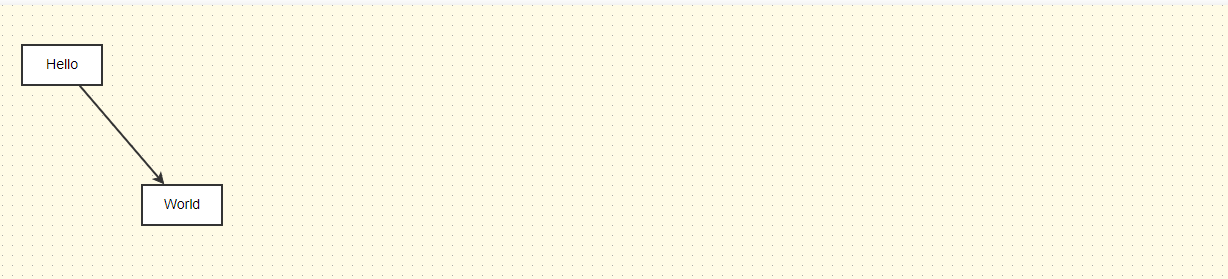
接下来,我们来给画布设置一个背景颜色和网格,另外还支持背景图片、网格类型等配置,点击查看完整的背景配置和网格配置。
import { Graph } from '@antv/x6';const graph = new Graph({container: document.getElementById('container'),width: 800,height: 600,background: {color: '#fffbe6', // 设置画布背景颜色},grid: {size: 10, // 网格大小 10pxvisible: true, // 渲染网格背景},});
缩放和平移
创建画布后,可以调用graph.zoom(factor: number)和graph.translate(tx: number, ty: number) 来缩放和平移画布。
graph.zoom(-0.5)graph.translate(80, 40)
节点
使用图形
在上面示例中,我们使用了默认图形 rect 来渲染节点,除此之外,我们在 X6 中也内置了 circle、ellipse、polygon 等基础图形,可以通过 shape 属性为节点指定渲染的图形,如果你对 SVG 图形还不熟悉,可以参考 SVG 图像入门教程
const data = {nodes: [{id: 'node1',shape: 'rect', // 使用 rect 渲染x: 100,y: 200,width: 80,height: 40,label: 'hello',},{id: 'node2',shape: 'ellipse', // 使用 ellipse 渲染x: 300,y: 200,width: 80,height: 40,label: 'world',},],edges: [{source: 'node1',target: 'node2',},],};
定制样式
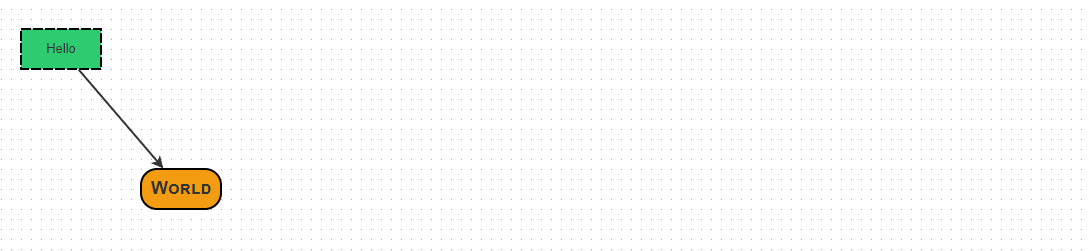
在创建节点或准备节点数据时,我们可以通过 attrs 对象来配置节点样式,该对象的 Key 是节点 SVG 元素的选择器(Selector),对应的值是应用到该 SVG 元素的 SVG 属性值(如 fill 和 stroke),如果你对 SVG 属性还不熟悉,可以参考 MDN 提供的填充和边框入门教程。
我们对 ‘rect’ 图形中定义了 ‘body’(代表
const data = {nodes: [{id: 'node1',x: 40,y: 40,width: 100,height: 40,attrs: {body: {fill: '#2ECC71',stroke: '#000',strokeDasharray: '10,2',},label: {text: 'Hello',fill: '#333',fontSize: 13,}}},{id: 'node2',x: 180,y: 240,width: 100,height: 40,attrs: {body: {fill: '#F39C12',stroke: '#000',rx: 16,ry: 16,},label: {text: 'World',fill: '#333',fontSize: 18,fontWeight: 'bold',fontVariant: 'small-caps',},},},],edges: [{source: 'node1',target: 'node2',},],};
边
使用图形
在上面示例中,我们使用了默认图形 edge 来渲染边,除此之外,在 X6 中还内置了 double-edge 和 shadow-edge 两种图形,可以通过 shape 属性为边指定渲染的图形,例如:
onst data = {nodes: [{id: 'node1',shape: 'rect',x: 100,y: 100,width: 80,height: 40,label: 'hello',},{id: 'node2',shape: 'ellipse',x: 240,y: 300,width: 80,height: 40,label: 'world',},],edges: [{source: 'node1',target: 'node2',shape: 'double-edge',},],}
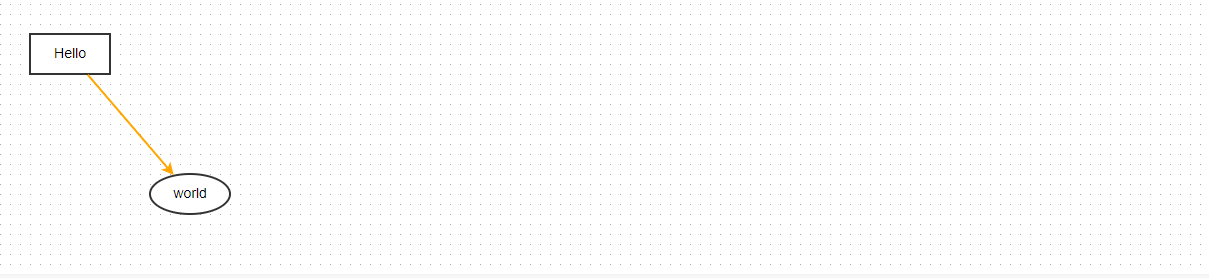
定制样式
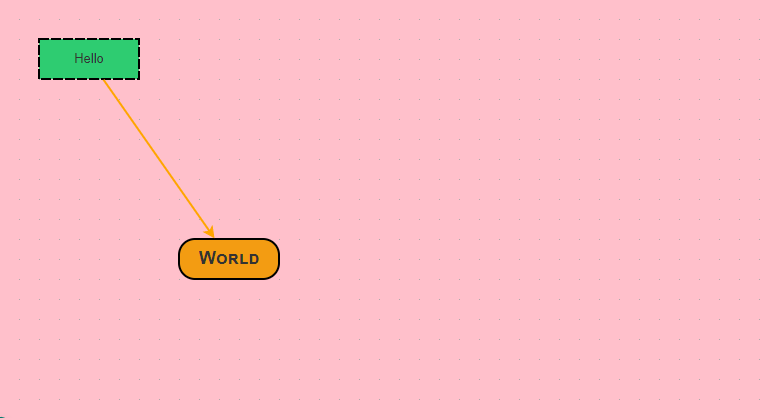
与定制节点样式一样,我们使用 attrs 对象来配置边的样式,默认的 edge 图形定义了 ‘line’(
const data = {nodes: [{id: 'node1',shape: 'rect',x: 100,y: 100,width: 80,height: 40,label: 'hello',},{id: 'node2',shape: 'ellipse',x: 240,y: 300,width: 80,height: 40,label: 'world',},],edges: [{source: 'node1',target: 'node2',attrs: {line: {stroke: 'orange',},},},],}

若有收获,就点个赞吧
0 人点赞
