题目:
对所给音频信号,进行时域压缩和扩展,画出时域波形与幅度谱,使其满足以下要求。
1、将music1.wav的音调变低a倍(0.8
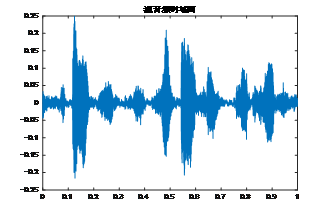
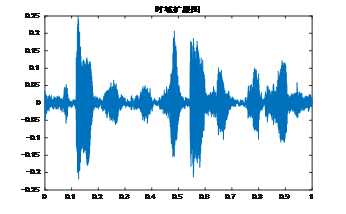
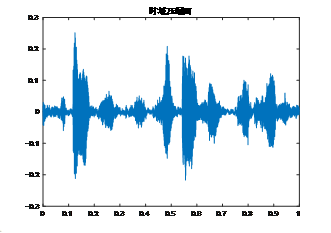
(1) 原音频、音调降低、音调升高的时域波形分别如图3.1、图3.2、图3.3所示,频域波形分别如图3.4、 图3.5、图3.6所示,分析前后的10%带宽(最大值10%处的带宽)的变化情况如图3_1所示。
[Origin_Wav, fs] = audioread('C:\Users\yang\Desktop\matlab\music1.wav'); %读取音频文件信息% sound(Origin_Wav);N = 62500;f=(-N/2:N/2-1)/N*fs; %自变量,fs采样频率Origin_Dt = 1/length(Origin_Wav);Origin_t = (0:Origin_Dt:1-Origin_Dt);figure;plot(Origin_t,Origin_Wav);title('源音频时域图');%绘制时域图Origin_X = fftshift(fft(Origin_Wav,N)); %傅里叶变换Origin_AMP = abs(Origin_X); %得频域点figure;plot(f,Origin_AMP);title('源音频频谱图'); %绘制幅频图Max_Origin_AMP = max(Origin_AMP); %求频谱最大值TenPer_Max_Origin_AMP = 0.1 * Max_Origin_AMP;hold on;plot([f(1) f(length(f))],[TenPer_Max_Origin_AMP TenPer_Max_Origin_AMP],'r-');Low_Wav = resample(Origin_Wav,10,9); %时域扩展Low_Dt = 1/length(Low_Wav);Low_t = (0:Low_Dt:1-Low_Dt);figure;plot(Low_t,Low_Wav);title('时域扩展图');%绘制时域图Low_X = fftshift(fft(Low_Wav,N)); %傅里叶变换Low_AMP = abs(Low_X); %得频域点figure;plot(f,Low_AMP);title('时域扩展幅频图');%绘制幅频图Max_Low_AMP = max(Low_AMP); %求频谱最大值TenPer_Max_Low_AMP = 0.1 * Max_Low_AMP;hold on;plot([f(1) f(length(f))],[TenPer_Max_Low_AMP TenPer_Max_Low_AMP],'r-');High_Wav = resample(Origin_Wav,10,12); %时域压缩High_Dt = 1/length(High_Wav);High_t = (0:High_Dt:1-High_Dt);figure;plot(High_t,High_Wav);title('时域压缩图');%绘制时域图High_X = fftshift(fft(High_Wav,N)); %傅里叶变换High_AMP = abs(High_X); %得频域点figure;plot(f,High_AMP);title('时域压缩幅频图');%绘制幅频图Max_High_AMP = max(High_AMP); %求频谱最大值TenPer_Max_High_AMP = 0.1 * Max_High_AMP;hold on;plot([f(1) f(length(f))],[TenPer_Max_High_AMP TenPer_Max_High_AMP],'r-');


图3.1 原音频时域图 图3.2 音调降低后时域图 图3.3 音调升高后时域图 

 图3.4 原音频频谱图图 3.5 音调降低后频谱图 图3.6 音调升高后频谱图

图3_1 变换前后10%带宽分析
2、根据时域频域关系的知识,时域扩展1.2倍,频域压缩,原音频变为男声,时域压缩1.4倍时,频域扩 展,原音频变为童声。原音频、变化到男声、变化到童声的时域波形分别如图3.7、图3.8、图3.9所 示,频域波形分别如图3.10、图3.11、图3.12所示, 变换前后的10%带宽(最大值10%处的带宽)的变 化情况如图3_2所示。
[Origin_Wav, fs] = audioread('C:\Users\yang\Desktop\matlab\music2.wav');  %读取音频文件信息
sound(Origin_Wav);
N = 62500;%length(Low_Wav);             %点的数量
f=(-N/2:N/2-1)/N*fs;                    %自变量,fs采样频率
Origin_Dt = 1/length(Origin_Wav);
Origin_t = (0:Origin_Dt:1-Origin_Dt);
figure;
plot(Origin_t,Origin_Wav);title('源音频时域图');%绘制时域图

Origin_X = fftshift(fft(Origin_Wav,N));       %傅里叶变换
Origin_AMP = abs(Origin_X);                   %得频域点
figure;
plot(f,Origin_AMP);title('源音频频谱图');     %绘制幅频图
Max_Origin_AMP = max(Origin_AMP);             %求频谱最大值
TenPer_Max_Origin_AMP = 0.1 * Max_Origin_AMP;
hold on;
plot([f(1) f(length(f))],[TenPer_Max_Origin_AMP TenPer_Max_Origin_AMP],'r-');

Low_Wav = resample(Origin_Wav,12,10);   %时域扩展
%sound (Low_Wav,fs);     %播放
Low_Dt = 1/length(Low_Wav);
Low_t = (0:Low_Dt:1-Low_Dt);
figure;
plot(Low_t,Low_Wav);title('时域扩展图');%绘制时域图

Low_X = fftshift(fft(Low_Wav,N));       %傅里叶变换
Low_AMP = abs(Low_X);                   %得频域点
figure;
plot(f,Low_AMP);title('时域扩展幅频图');%绘制幅频图
Max_Low_AMP = max(Low_AMP);             %求频谱最大值
TenPer_Max_Low_AMP = 0.1 * Max_Low_AMP;
hold on;
plot([f(1) f(length(f))],[TenPer_Max_Low_AMP TenPer_Max_Low_AMP],'r-');

High_Wav = resample(Origin_Wav,10,14);  %时域压缩
%sound(High_Wav,fs);     %播放
High_Dt = 1/length(High_Wav);
High_t = (0:High_Dt:1-High_Dt);
figure;
plot(High_t,High_Wav);title('时域压缩图');%绘制时域图

High_X = fftshift(fft(High_Wav,N));     %傅里叶变换
High_AMP = abs(High_X);                 %得频域点
figure;
plot(f,High_AMP);title('时域压缩幅频图');%绘制幅频图
Max_High_AMP = max(High_AMP);           %求频谱最大值
TenPer_Max_High_AMP = 0.1 * Max_High_AMP;
hold on;
plot([f(1) f(length(f))],[TenPer_Max_High_AMP TenPer_Max_High_AMP],'r-');
<br /> 图3.7 原音频时域图 图3.8 变化到男声时域图图 3.9 变化到童声时域图<br /> 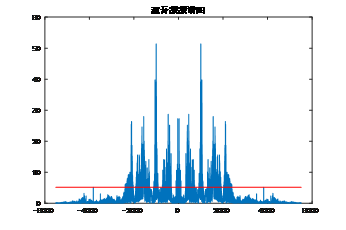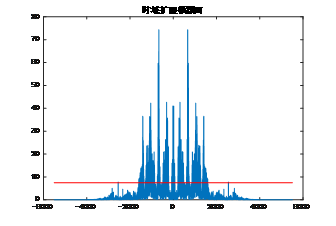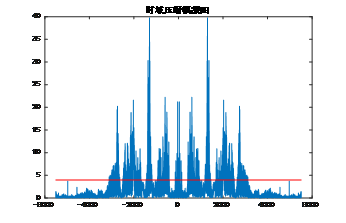<br />图3.10 原音频频谱图 图3.11 变化到男声频谱图 图3.12 变化到童声频谱图<br /> 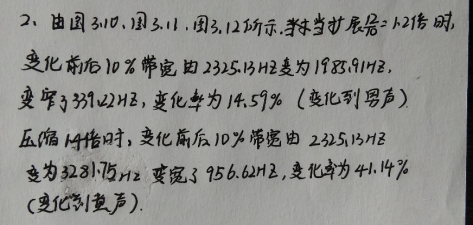<br />图3_2 变换前后10%带宽分析<br />

若有收获,就点个赞吧
0 人点赞
