使用Operator管理告警
使用PrometheusRule定义告警规则
对于Prometheus而言,在原生的管理方式上,我们需要手动创建Prometheus的告警文件,并且通过在Prometheus配置中声明式的加载。而在Prometheus Operator模式中,告警规则也编程一个通过Kubernetes API 声明式创建的一个资源,如下所示:
apiVersion: monitoring.coreos.com/v1kind: PrometheusRulemetadata:labels:prometheus: examplerole: alert-rulesname: prometheus-example-rulesspec:groups:- name: ./example.rulesrules:- alert: ExampleAlertexpr: vector(1)
将以上内容保存为example-rule.yaml文件,并且通过kubectl命令创建相应的资源:
$ kubectl -n monitoring create -f example-rule.yamlprometheusrule "prometheus-example-rules" created
告警规则创建成功后,通过在Prometheus中使用ruleSelector通过选择需要关联的PrometheusRule即可:
apiVersion: monitoring.coreos.com/v1kind: Prometheusmetadata:name: instnamespace: monitoringspec:serviceAccountName: prometheusserviceMonitorSelector:matchLabels:team: frontendruleSelector:matchLabels:role: alert-rulesprometheus: exampleresources:requests:memory: 400Mi
Prometheus重新加载配置后,从UI中我们可以查看到通过PrometheusRule自动创建的告警规则配置:
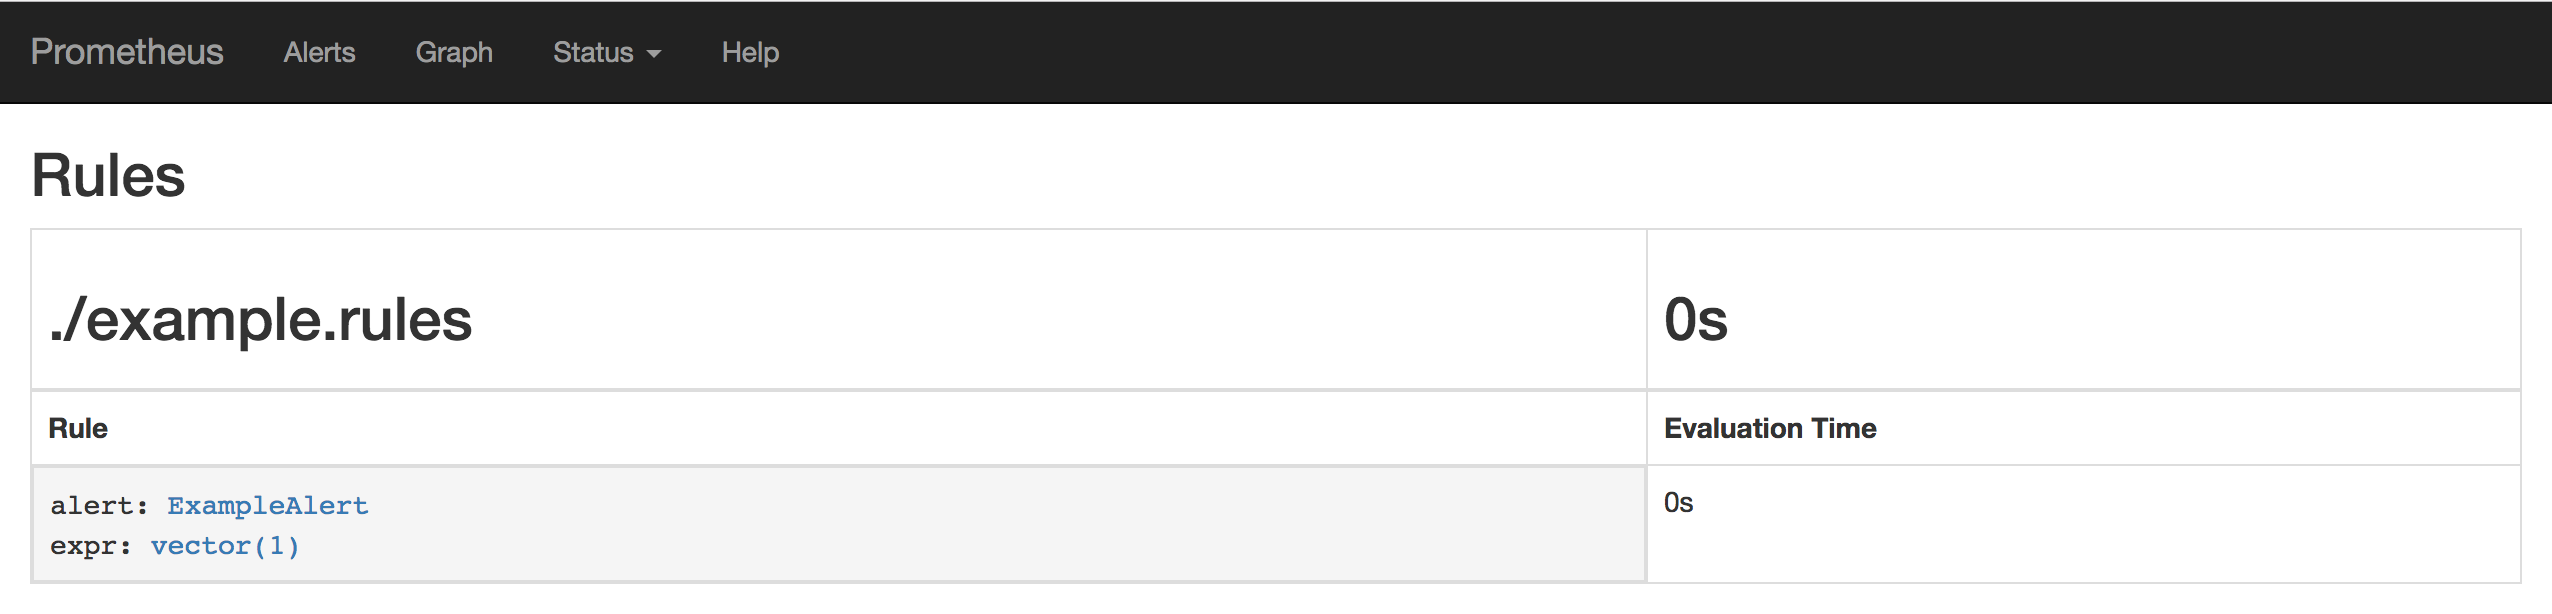
Prometheus告警规则
如果查看Alerts页面,我们会看到告警已经处于触发状态。
使用Operator管理Alertmanager实例
到目前为止,我们已经通过Prometheus Operator的自定义资源类型管理了Promtheus的实例,监控配置以及告警规则等资源。通过Prometheus Operator将原本手动管理的工作全部变成声明式的管理模式,大大简化了Kubernetes下的Prometheus运维管理的复杂度。 接下来,我们将继续使用Promtheus Operator定义和管理Alertmanager相关的内容。
为了通过Prometheus Operator管理Alertmanager实例,用户可以通过自定义资源Alertmanager进行定义,如下所示,通过replicas可以控制Alertmanager的实例数:
apiVersion: monitoring.coreos.com/v1kind: Alertmanagermetadata:name: instnamespace: monitoringspec:replicas: 3
当replicas大于1时,Prometheus Operator会自动通过集群的方式创建Alertmanager。将以上内容保存为文件alertmanager-inst.yaml,并通过以下命令创建:
$ kubectl -n monitoring create -f alertmanager-inst.yamlalertmanager.monitoring.coreos.com/inst created
查看Pod的情况如下所示,我们会发现Alertmanager的Pod实例一直处于ContainerCreating的状态中:
$ kubectl -n monitoring get podsNAME READY STATUS RESTARTS AGEalertmanager-inst-0 0/2 ContainerCreating 0 32s
通过kubectl describe命令查看该Alertmanager的Pod实例状态,可以看到类似于以下内容的告警信息:
MountVolume.SetUp failed for volume "config-volume" : secrets "alertmanager-inst" not found
这是由于Prometheus Operator通过Statefulset的方式创建的Alertmanager实例,在默认情况下,会通过alertmanager-{ALERTMANAGER_NAME}的命名规则去查找Secret配置并以文件挂载的方式,将Secret的内容作为配置文件挂载到Alertmanager实例当中。因此,这里还需要为Alertmanager创建相应的配置内容,如下所示,是Alertmanager的配置文件:
global:resolve_timeout: 5mroute:group_by: ['job']group_wait: 30sgroup_interval: 5mrepeat_interval: 12hreceiver: 'webhook'receivers:- name: 'webhook'webhook_configs:- url: 'http://alertmanagerwh:30500/'
将以上内容保存为文件alertmanager.yaml,并且通过以下命令创建名为alrtmanager-inst的Secret资源:
$ kubectl -n monitoring create secret generic alertmanager-inst --from-file=alertmanager.yamlsecret/alertmanager-inst created
在Secret创建成功后,查看当前Alertmanager Pod实例状态。如下所示:
$ kubectl -n monitoring get podsNAME READY STATUS RESTARTS AGEalertmanager-inst-0 2/2 Running 0 5malertmanager-inst-1 2/2 Running 0 52salertmanager-inst-2 2/2 Running 0 37s
使用port-forward将Alertmanager映射到本地:
$ kubectl -n monitoring port-forward statefulsets/alertmanager-inst 9093:9093
访问 http://localhost:9093/#/status ,并查看当前集群状态:
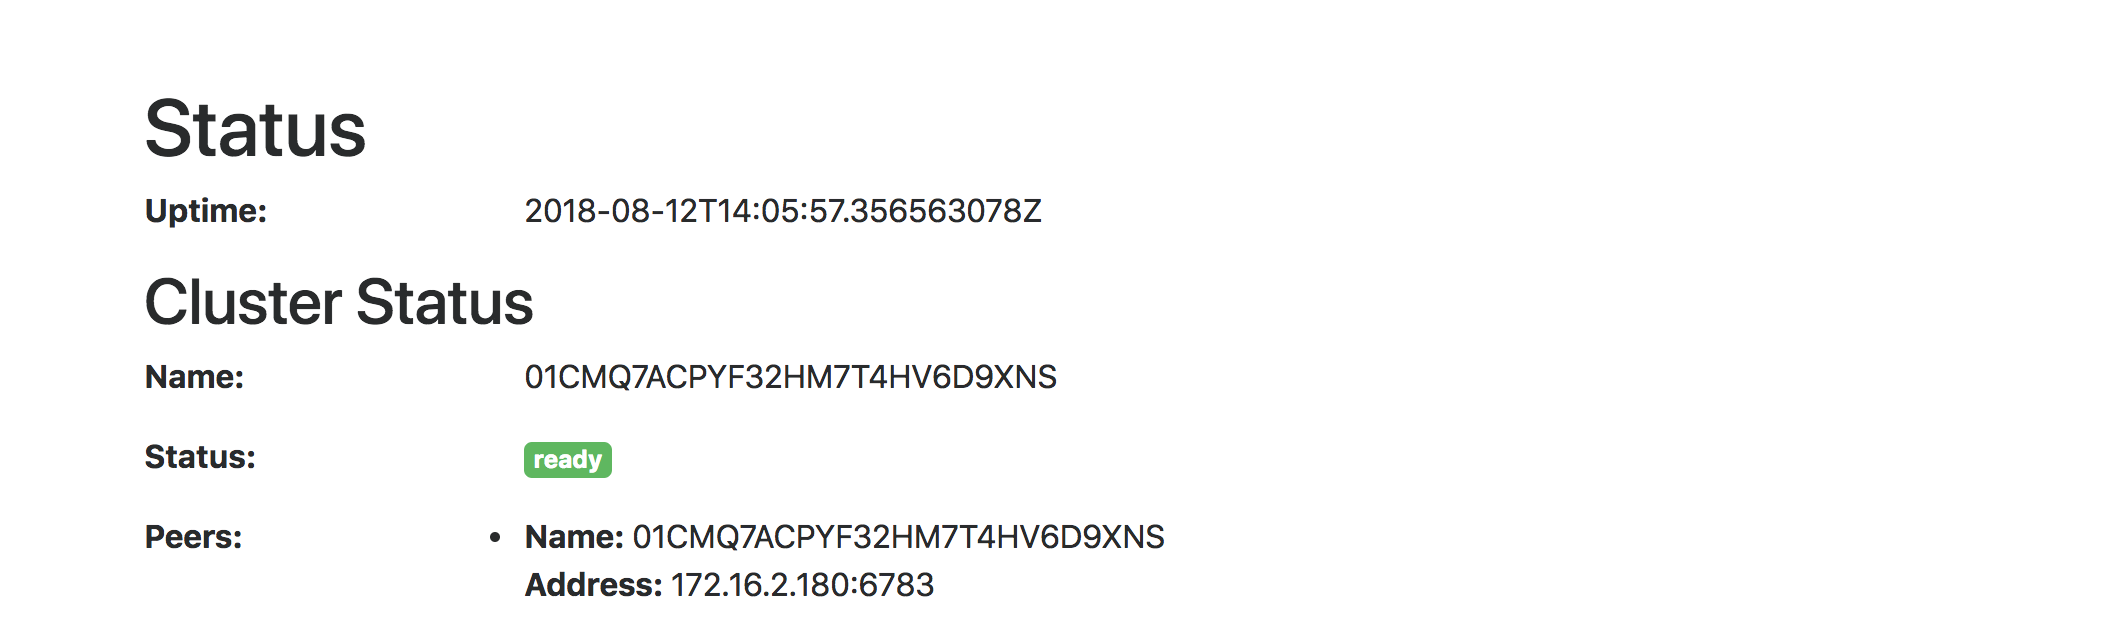
Alertmanager集群状态
接下来,我们只需要修改我们的Prometheus资源定义,通过alerting指定使用的Alertmanager资源即可:
apiVersion: monitoring.coreos.com/v1kind: Prometheusmetadata:name: instnamespace: monitoringspec:serviceAccountName: prometheusserviceMonitorSelector:matchLabels:team: frontendruleSelector:matchLabels:role: alert-rulesprometheus: examplealerting:alertmanagers:- name: alertmanager-examplenamespace: monitoringport: webresources:requests:memory: 400Mi
等待Prometheus重新加载后,我们可以看到Prometheus Operator在配置文件中添加了以下配置:
alertmanagers:- kubernetes_sd_configs:- role: endpointsnamespaces:names:- monitoringscheme: httppath_prefix: /timeout: 10srelabel_configs:- source_labels: [__meta_kubernetes_service_name]separator: ;regex: alertmanager-examplereplacement: $1action: keep- source_labels: [__meta_kubernetes_endpoint_port_name]separator: ;regex: webreplacement: $1action: keep
通过服务发现规则将Prometheus与Alertmanager进行了自动关联。

若有收获,就点个赞吧
0 人点赞
