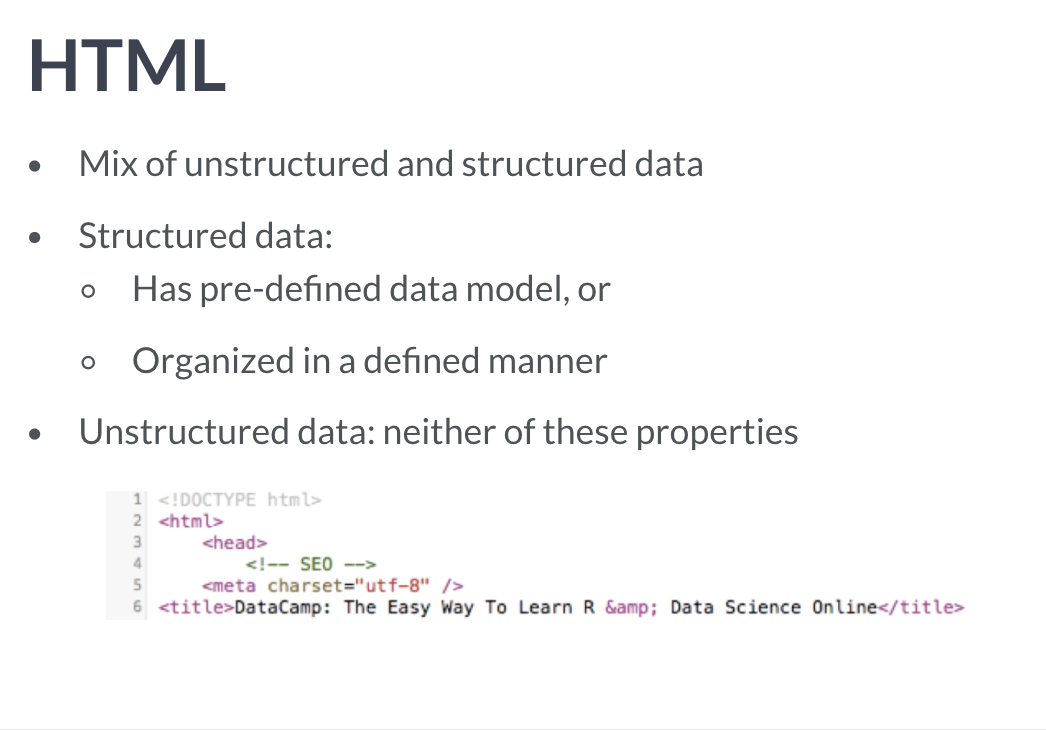
URL与HTTP
使用urllib 下载文件
# Import packagefrom urllib.request import urlretrieve# Import pandasimport pandas as pd# Assign url of file: urlurl = 'https://s3.amazonaws.com/assets.datacamp.com/production/course_1606/datasets/winequality-red.csv'# Save file locallyurlretrieve(url, 'winequality-red.csv')# Read file into a DataFrame and print its headdf = pd.read_csv('winequality-red.csv', sep=';')print(df.head())
获取request方式
想要得到网页内容,必须得先向该网页发送一个request,以获得访问。
通过urllib
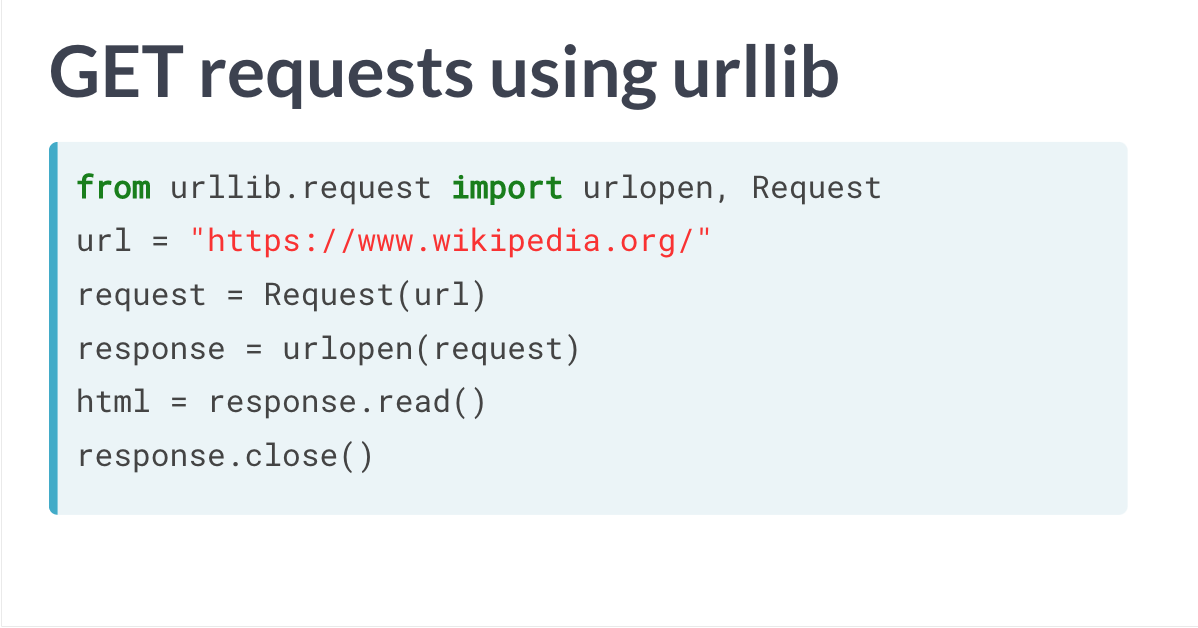
# Import packagesfrom urllib.request import urlopen, Request# Specify the urlurl = "http://www.datacamp.com/teach/documentation"# This packages the requestrequest = Request(url)# Sends the request and catches the response: responseresponse = urlopen(request)# Extract the response: htmlhtml = response.read()# Print the htmlprint(html)# Be polite and close the response!response.close()
通过request
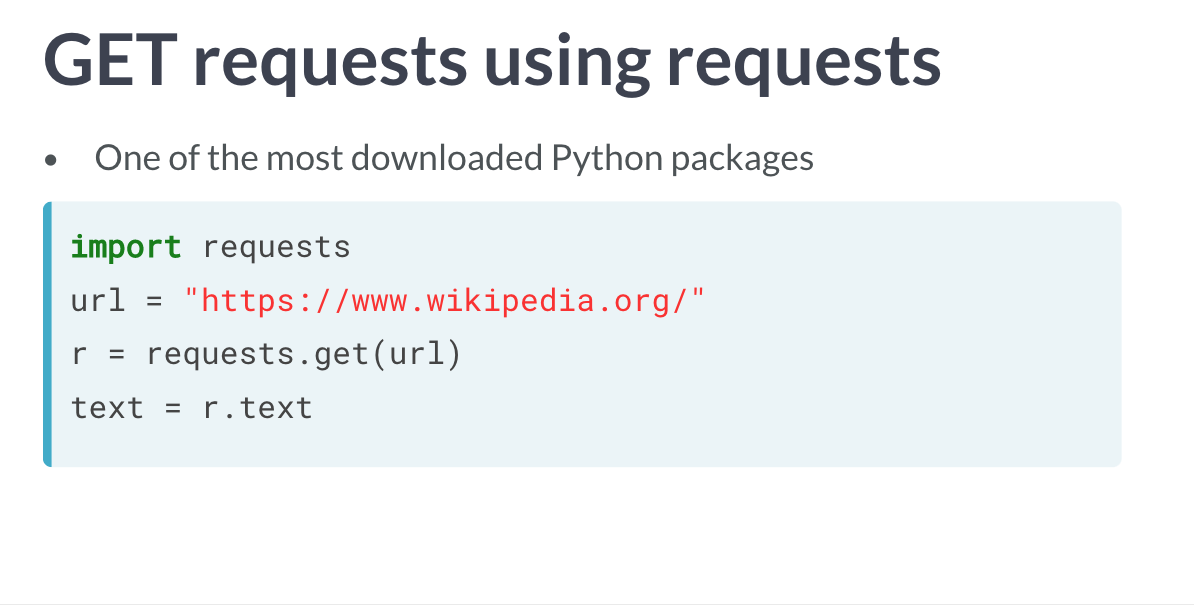
# Import packageimport requests# Specify the url: urlurl = "http://www.datacamp.com/teach/documentation"# Packages the request, send the request and catch the response: rr = requests.get(url)# Extract the response: texttext = r.text# Print the htmlprint(text)
通过bs4获取HTML 内容
ps:关于bs4 库详细用法,可以参考010_爬虫学习004-006内容。
# Import packagesimport requestsfrom bs4 import BeautifulSoup# Specify urlurl = 'https://www.python.org/~guido/'# Package the request, send the request and catch the response: rr = requests.get(url)# Extracts the response as html: html_dochtml_doc = r.text# create a BeautifulSoup object from the HTML: soupsoup = BeautifulSoup(html_doc)# Print the title of Guido's webpageprint(soup.title)# Find all 'a' tags (which define hyperlinks): a_tagsa_tags = soup.find_all('a')# Print the URLs to the shellfor link in a_tags:print(link.get('href'))
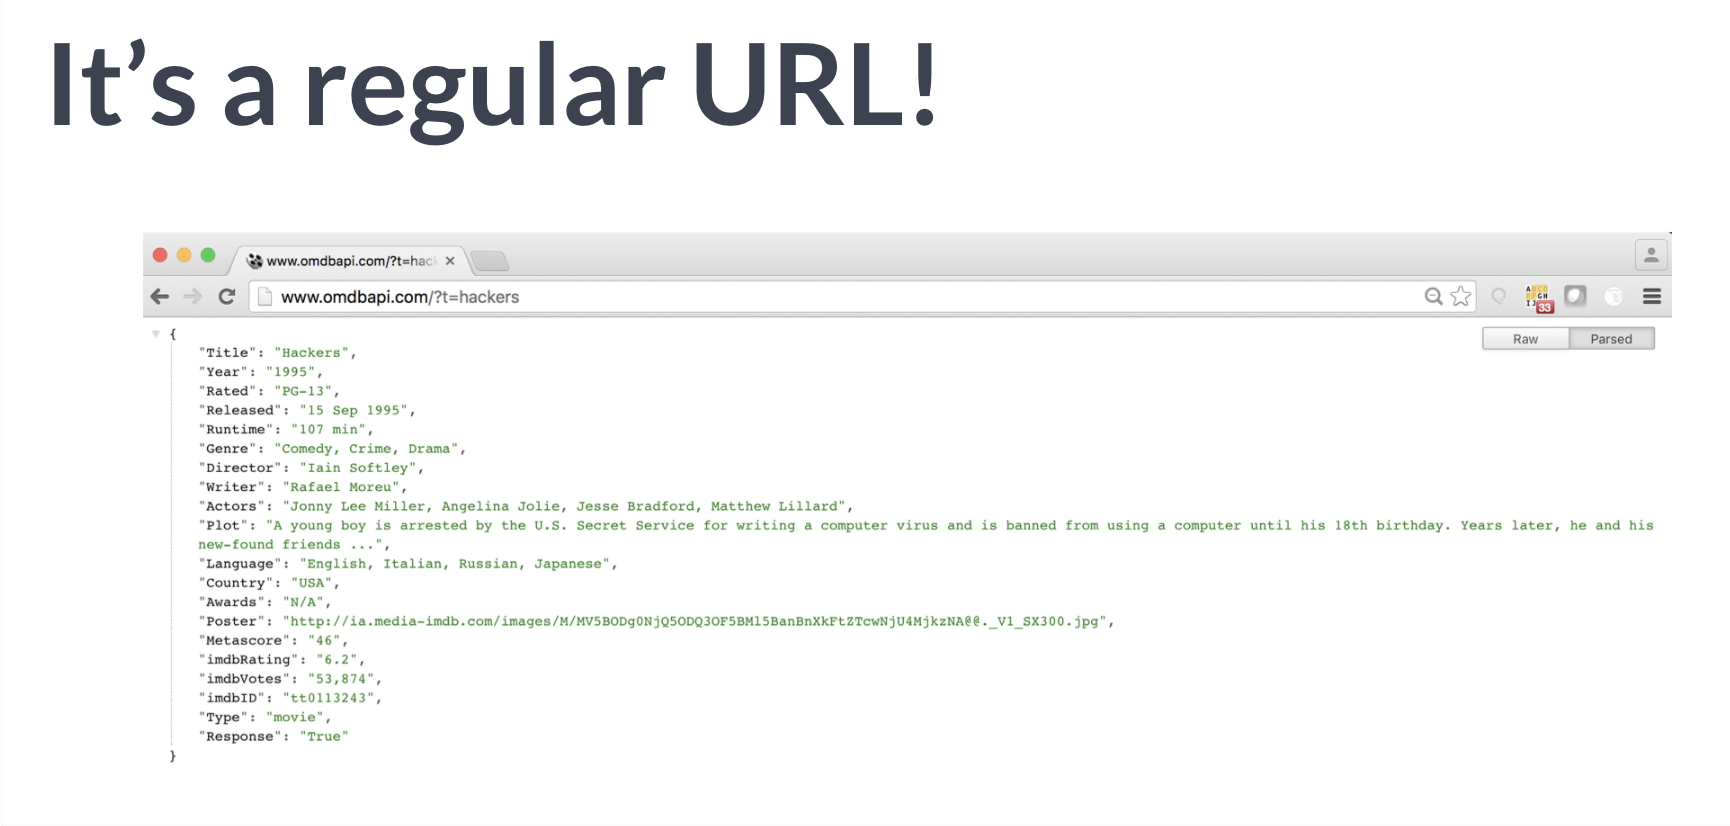
通过APIs 获取信息
JSON
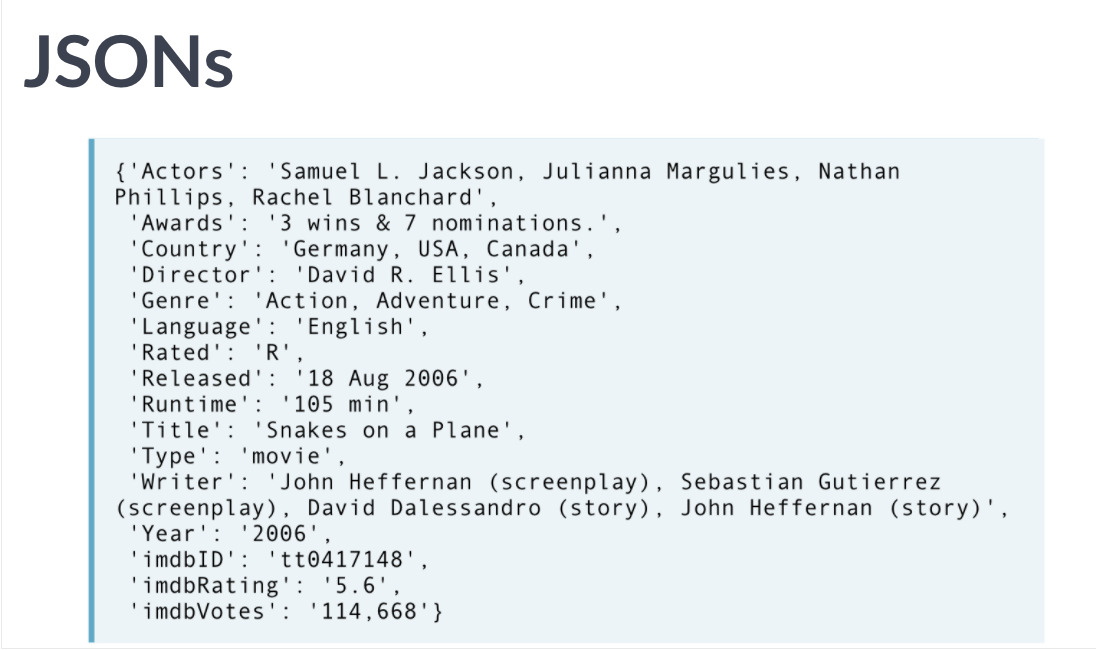
采用有类型的key-value,适合程序使用(直接作为程序的一部分)。
# Load JSON: json_datawith open("a_movie.json") as json_file:json_data = json.load(json_file)# Print each key-value pair in json_datafor k in json_data.keys():print(k + ': ', json_data[k])
获取APIs 过程
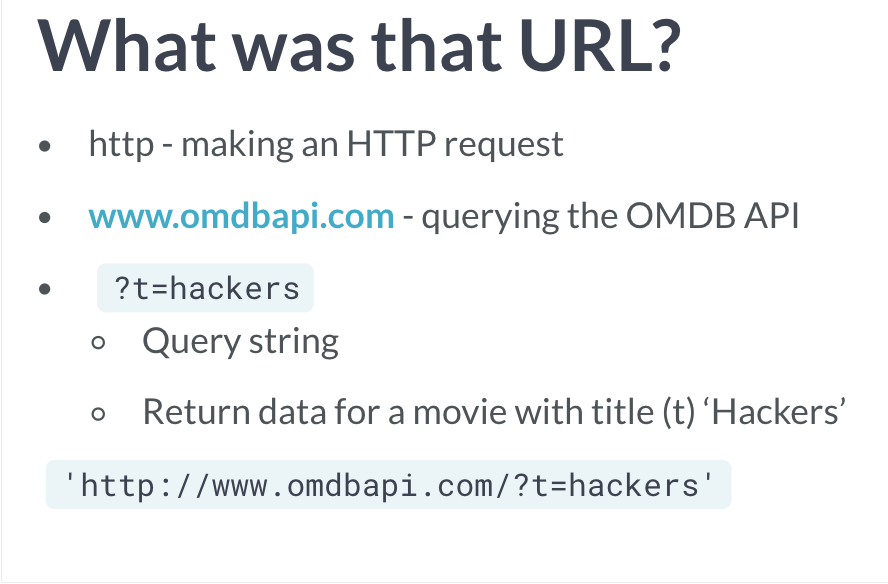
# Import packageimport requests# Assign URL to variable: urlurl = 'https://en.wikipedia.org/w/api.php?action=query&prop=extracts&format=json&exintro=&titles=pizza'# Package the request, send the request and catch the response: rr = requests.get(url)# Decode the JSON data into a dictionary: json_datajson_data = r.json()# Print the Wikipedia page extractpizza_extract = json_data['query']['pages']['24768']['extract']print(pizza_extract)
获取推特API 进行分析
- 创建推特账户
- 获取token 与API 与相关的密钥
- 推特提供许多APIs 选择合适的(streaming API,public stream)
- 使用get statuses,获取小量随机的public statuses。如果获取大量的实际public statuses,可以使用firehose API。
- 获取JSON文件。
代码操作:
1)通过token 与API 与相关的密钥访问,获得授权(authorization)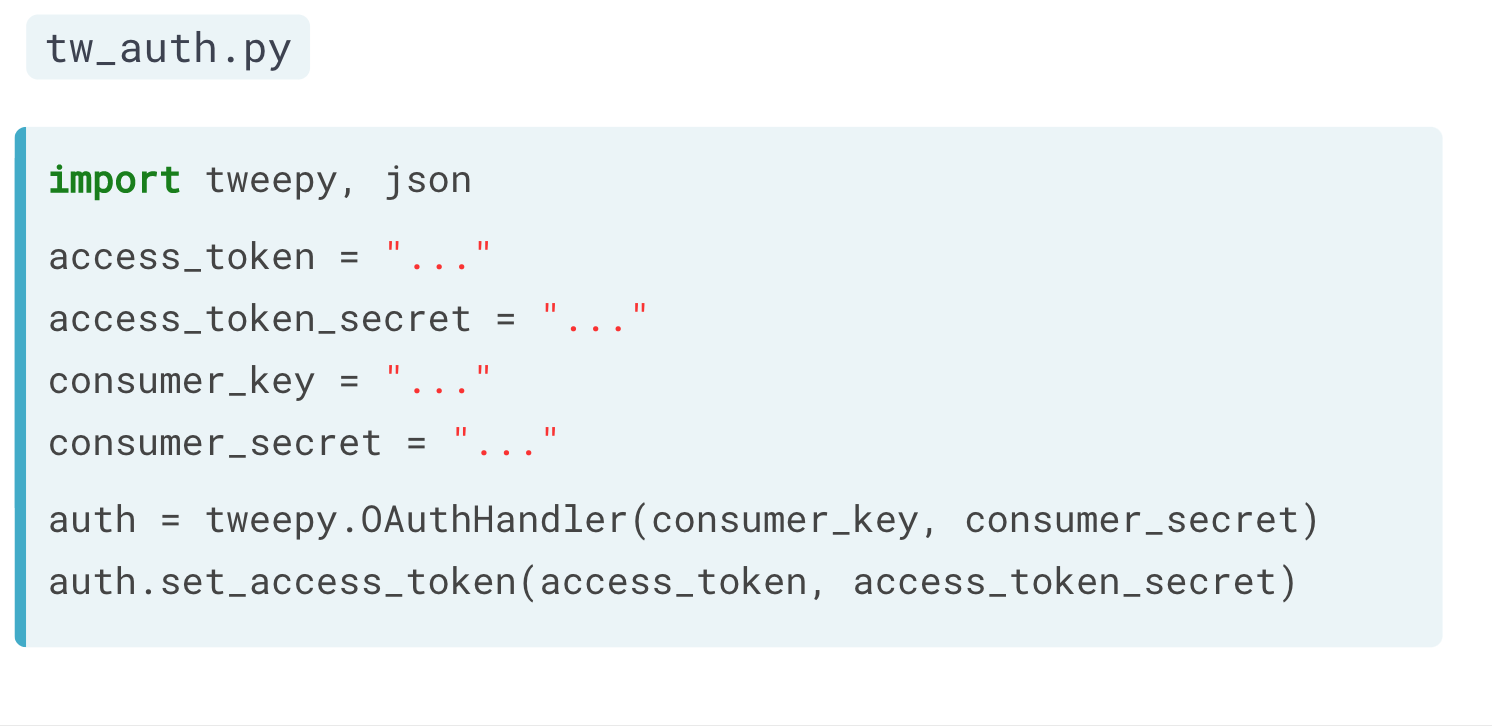
2)设置一个类,用于监听数据流。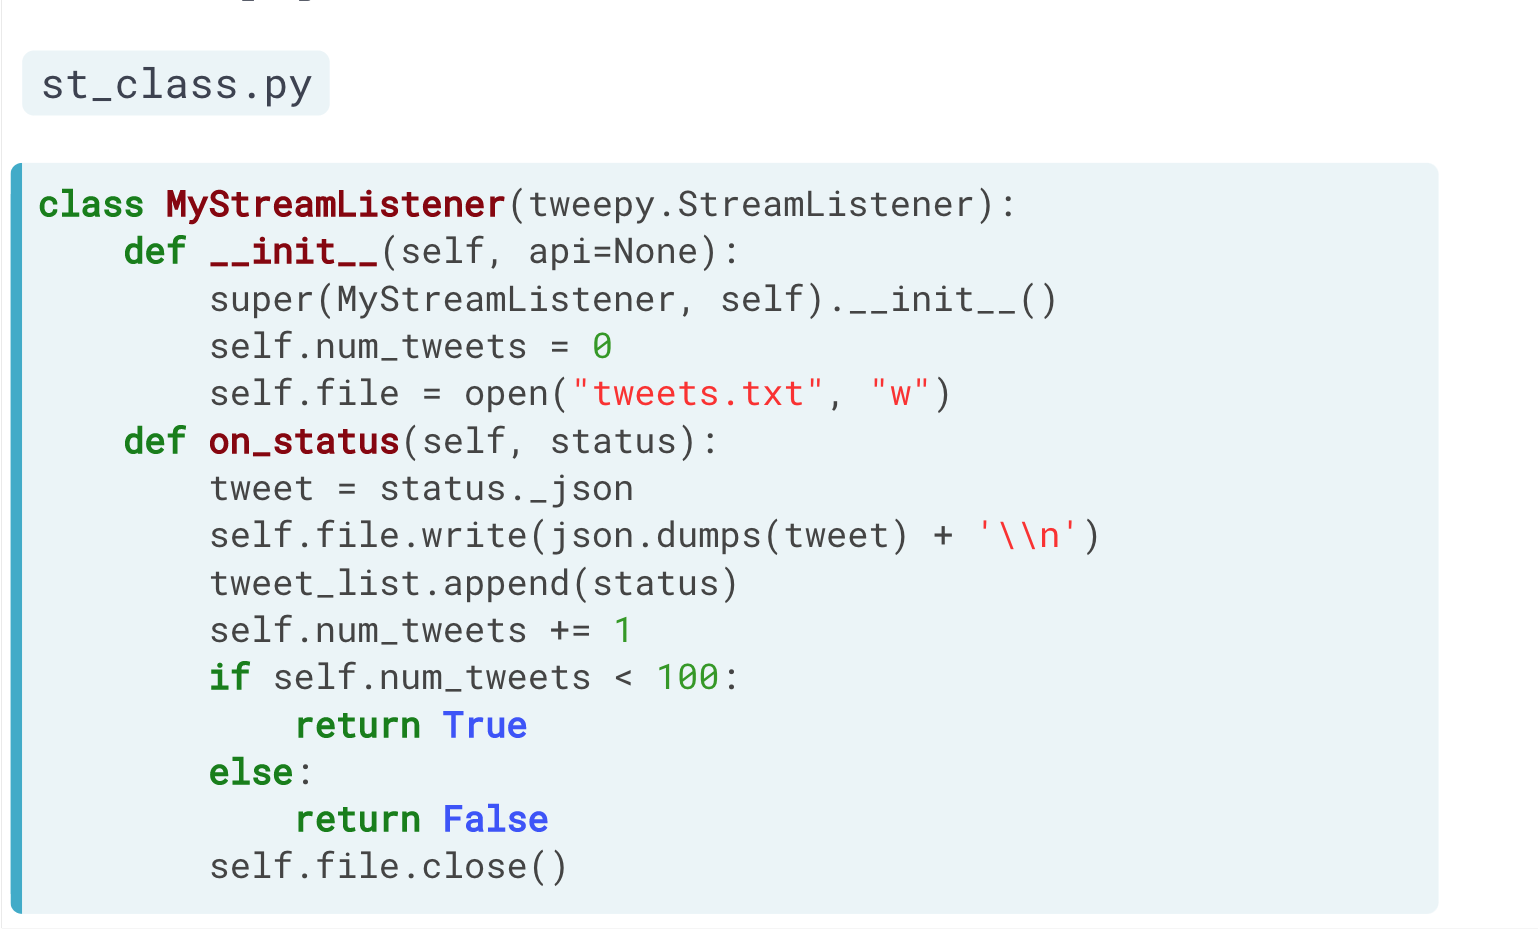
3)抓取指定数据流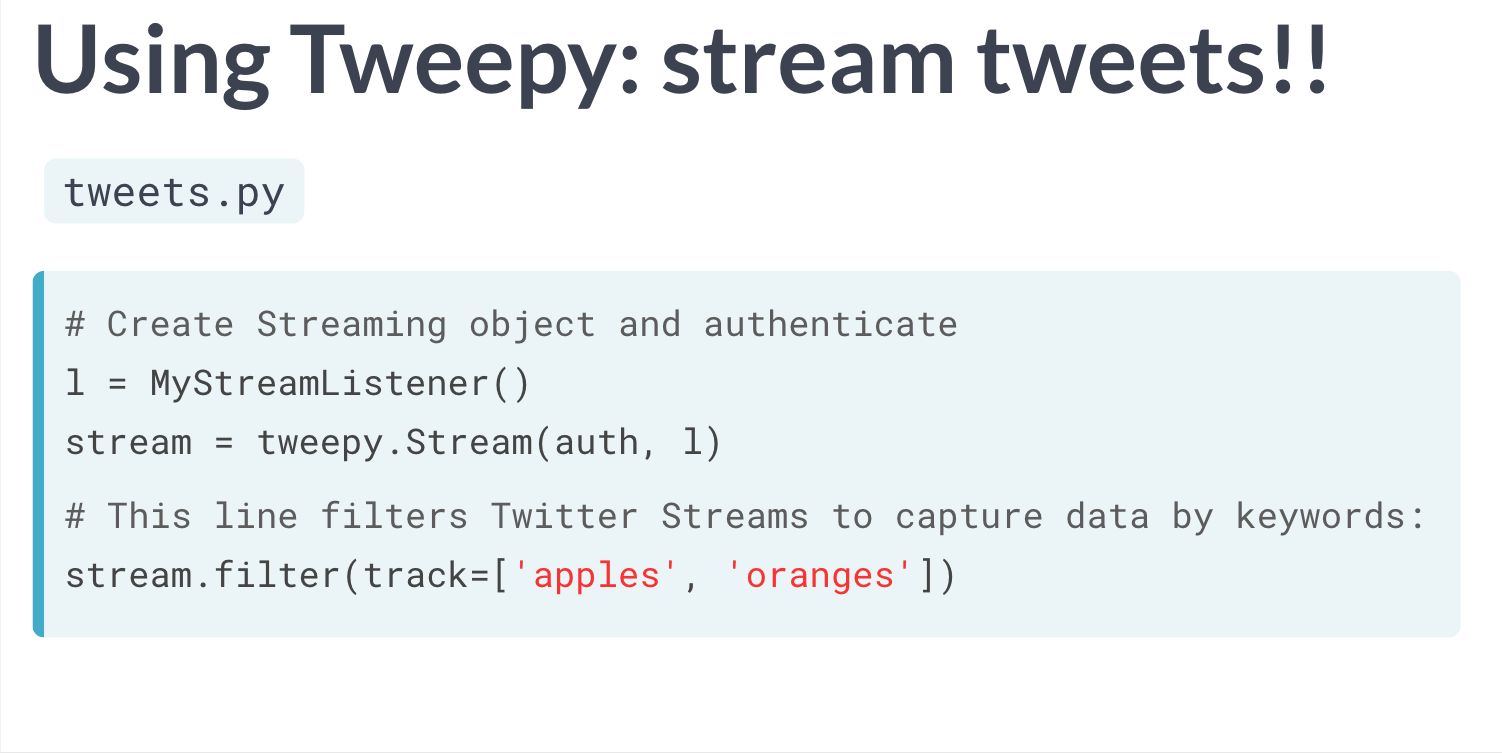
实战:获取推特random_statuses 并进行分析
获取推特API
# Import packageimport json# String of path to file: tweets_data_pathtweets_data_path = 'tweets.txt'# Initialize empty list to store tweets: tweets_datatweets_data = []# Open connection to filetweets_file = open(tweets_data_path, "r")# Read in tweets and store in list: tweets_datafor line in tweets_file:tweet = json.loads(line)tweets_data.append(tweet)# Close connection to filetweets_file.close()
导入为pandas 表格
# Import packageimport pandas as pd# Build DataFrame of tweet texts and languagesdf = pd.DataFrame(tweets_data, columns=['text', 'lang'])# Print head of DataFrameprint(df.head())
分析内容:找出单词出现次数
# Initialize list to store tweet counts[clinton, trump, sanders, cruz] = [0, 0, 0, 0]# Iterate through df, counting the number of tweets in which# each candidate is mentionedfor index, row in df.iterrows():clinton += word_in_text('clinton', row['text'])trump += word_in_text('trump', row['text'])sanders += word_in_text('sanders', row['text'])cruz += word_in_text('cruz', row['text'])
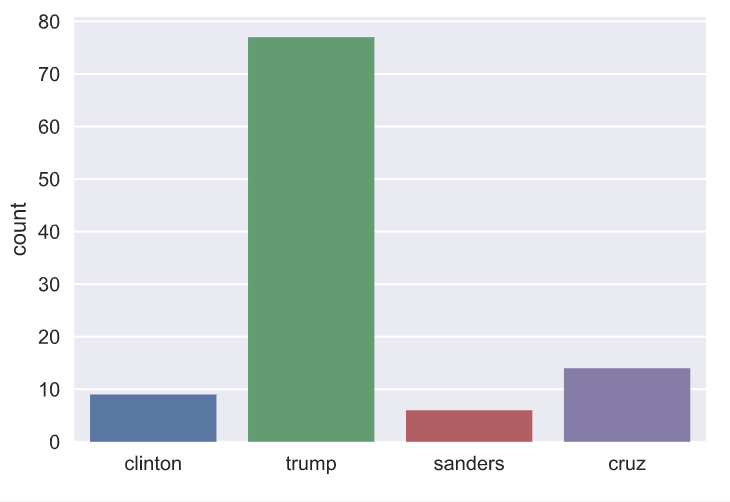
使用matplotlib 与seaborn 进行作图
# Import packagesimport matplotlib.pyplot as pltimport seaborn as sns# Set seaborn stylesns.set(color_codes=True)# Create a list of labels:cdcd = ['clinton', 'trump', 'sanders', 'cruz']# Plot the bar chartax = sns.barplot(cd, [clinton, trump, sanders, cruz])ax.set(ylabel="count")plt.show()

若有收获,就点个赞吧
0 人点赞
