服务介绍
特征
Prometheus 相比于其他传统监控工具主要有以下几个特点:
- 具有由 metric 名称和键/值对标识的时间序列数据的多维数据模型
- 有灵活的查询语言
- 不依赖分布式存储,只和本地磁盘有关
- 通过 HTTP 的服务拉取时间序列数据
- 支持推送的方式来添加时间序列数据
- 支持通过服务发现或静态配置发现目标
- 多种图形和仪表板支持
组件
Prometheus 由多个组件组成,但是其中许多组件是可选的:
- Prometheus Server:用于抓取指标、存储时间序列数据
- exporter:暴露指标让任务来抓
- pushgateway:push 的方式将指标数据推送到该网关
- alertmanager:处理报警的报警组件
- adhoc:用于数据查询
架构
Prometheus架构及其相关系统生态组件
服务安装
说明:下文操作基于已实现以 nfs 为存储资源的 storage-class 数据存储环境。
$ docker run --name prometheus -d -p 127.0.0.1:9090:9090 prom/prometheus:v2.28.0
要制作 Prometheus 的 yaml 文件,先启动容器进去查看默认的启动命令:
$ docker run -d --name tmp -p 9090:9090 prom/prometheus:v2.28.0
$ docker exec -ti tmp sh
#/ ps aux
#/ cat /etc/prometheus/prometheus.yml
# my global config
global:
  scrape_interval:     15s # Set the scrape interval to every 15 seconds. Default is every 1 minute.
  evaluation_interval: 15s # Evaluate rules every 15 seconds. The default is every 1 minute.
  # scrape_timeout is set to the global default (10s).

# Alertmanager configuration
alerting:
  alertmanagers:
  - static_configs:
    - targets:
      # - alertmanager:9093

# Load rules once and periodically evaluate them according to the global 'evaluation_interval'.
rule_files:
  # - "first_rules.yml"
  # - "second_rules.yml"

# A scrape configuration containing exactly one endpoint to scrape:
# Here it's Prometheus itself.
scrape_configs:
  # The job name is added as a label `job=<job_name>` to any timeseries scraped from this config.
  - job_name: 'prometheus'

    # metrics_path defaults to '/metrics'
    # scheme defaults to 'http'.

    static_configs:
    - targets: ['localhost:9090']
$ cat prometheus.yml
# my global config
global:
  scrape_interval: 30s
  evaluation_interval: 30s
  # scrape_timeout is set to the global default (10s).

# Alertmanager configuration
alerting:
  alertmanagers:
  - static_configs:
    - targets:
      # - alertmanager:9093

# Load rules once and periodically evaluate them according to the global 'evaluation_interval'.
rule_files:
  # - "first_rules.yml"
  # - "second_rules.yml"

# A scrape configuration containing exactly one endpoint to scrape:
# Here it's Prometheus itself.
scrape_configs:
  - job_name: 'prometheus'
    static_configs:
    - targets: ['localhost:9090']

# pvc
$ cat pvc.yaml
kind: PersistentVolumeClaim
apiVersion: v1
metadata:
  name: prometheus
  namespace: monitor
spec:
  accessModes:
    - ReadWriteOnce
  storageClassName: course-nfs-storage
  resources:
    requests:
      storage: 200Gi


# prometheus的资源文件
# 出现Prometheus数据存储权限问题,因为Prometheus内部使用nobody启动进程,挂载数据目录后权限为root,因此使用initContainer进行目录权限修复:
$ cat prometheus-deployment.yaml
apiVersion: apps/v1
kind: Deployment
metadata:
  name: prometheus
  namespace: monitor
  labels:
    app: prometheus
spec:
  selector:
    matchLabels:
      app: prometheus
  template:
    metadata:
      labels:
        app: prometheus
    spec:
      serviceAccountName: prometheus
      initContainers:
      - name: "change-permission-of-directory"
        image: busybox
        command: ["/bin/sh"]
 #       args: ["-c", "chown -R 65534:65534 /prometheus"]  # 报错 chown: /prometheus: Operation not permitted ,故笔者注释了此行,手动将nfs的挂载目录 chmod 777 -R /nfsdata/promdata/
        args: ["-c", "date"]
        securityContext:
          privileged: true
        volumeMounts:
        - mountPath: "/etc/prometheus"
          name: config-volume
        - mountPath: "/prometheus"
          name: data
      containers:
      - image: prom/prometheus:v2.19.2
        name: prometheus
        args:
        - "--config.file=/etc/prometheus/prometheus.yml"
        - "--storage.tsdb.path=/prometheus"  # 指定tsdb数据路径
        - "--web.enable-lifecycle"  # 支持热更新,直接执行localhost:9090/-/reload立即生效
        - "--web.console.libraries=/usr/share/prometheus/console_libraries"
        - "--web.console.templates=/usr/share/prometheus/consoles"
        ports:
        - containerPort: 9090
          name: http
        volumeMounts:
        - mountPath: "/etc/prometheus"
          name: config-volume
        - mountPath: "/prometheus"
          name: data
        resources:
          requests:
            cpu: 100m
            memory: 512Mi
          limits:
            cpu: 100m
            memory: 512Mi
      volumes:
      - name: data
        persistentVolumeClaim:
          claimName: prometheus
      - configMap:
          name: prometheus-config
        name: config-volume

# rbac,prometheus会调用k8s api做服务发现进行抓取指标
$ cat prometheus-rbac.yaml
apiVersion: v1
kind: ServiceAccount
metadata:
  name: prometheus
  namespace: monitor
---
apiVersion: rbac.authorization.k8s.io/v1
kind: ClusterRole
metadata:
  name: prometheus
rules:
- apiGroups:
  - ""
  resources:
  - nodes
  - services
  - endpoints
  - pods
  - nodes/proxy
  verbs:
  - get
  - list
  - watch
- apiGroups:
  - "extensions"
  resources:
    - ingresses
  verbs:
  - get
  - list
  - watch
- apiGroups:
  - ""
  resources:
  - configmaps
  - nodes/metrics
  verbs:
  - get
- nonResourceURLs:
  - /metrics
  verbs:
  - get
---
apiVersion: rbac.authorization.k8s.io/v1beta1
kind: ClusterRoleBinding
metadata:
  name: prometheus
roleRef:
  apiGroup: rbac.authorization.k8s.io
  kind: ClusterRole
  name: prometheus
subjects:
- kind: ServiceAccount
  name: prometheus
  namespace: monitor


# 提供Service,为Ingress使用
$ cat prometheus-svc.yaml
apiVersion: v1
kind: Service
metadata:
  name: prometheus
  namespace: monitor
  labels:
    app: prometheus
spec:
  selector:
    app: prometheus
  type: ClusterIP
  ports:
    - name: web
      port: 9090
      targetPort: http

$ cat prometheus-ingress.yaml
apiVersion: networking.k8s.io/v1
kind: Ingress
metadata:
  name: prometheus
  namespace: monitor
spec:
  rules:
  - host: prometheus.crab.com
    http:
      paths:
      - path: /
        pathType: Prefix
        backend:
          service:
            name: prometheus
            port:
              number: 9090
应用资源:
# 命名空间
$ kubectl create namespace monitor

# 配置文件
$ kubectl -n monitor create configmap prometheus-config --from-file=prometheus.yml

#部署configmap
$ kubectl apply -f .
在本地添加hosts解析(ip为任何node节点ip信息)后访问域名 prometheus.crab.com 
添加监控示例
无论是业务应用还是 Kubernetes 系统组件,只要提供了 metrics api,并且该 api 返回的数据格式满足标准的 Prometheus 数据格式要求,即可被 Prometheus 采集数据。
很多组件为了适配 Prometheus 采集指标,有对应的/metrics api,如 CoreDNS:
$ kubectl -n kube-system get po -owide|grep coredns
coredns-58cc8c89f4-nshx2             1/1     Running   6          22d   10.244.0.20
coredns-58cc8c89f4-t9h2r             1/1     Running   7          22d   10.244.0.21

$ curl 10.244.0.20:9153/metrics
修改配置:
$ kubectl -n monitor edit configmap prometheus-config
...
    scrape_configs:
      - job_name: 'prometheus'
        static_configs:
        - targets: ['localhost:9090']
      - job_name: 'coredns'
        static_configs:
        - targets: ['10.96.0.10:9153']

$ kubectl apply -f prometheus-configmap.yaml

# 等待30s左右,重启Prometheus进程
$ kubectl -n monitor get po -owide
prometheus-5cd4d47557-758r5   1/1     Running   0          12m   10.244.2.104

$ curl -XPOST 10.244.2.104:9090/-/reload
页面查看: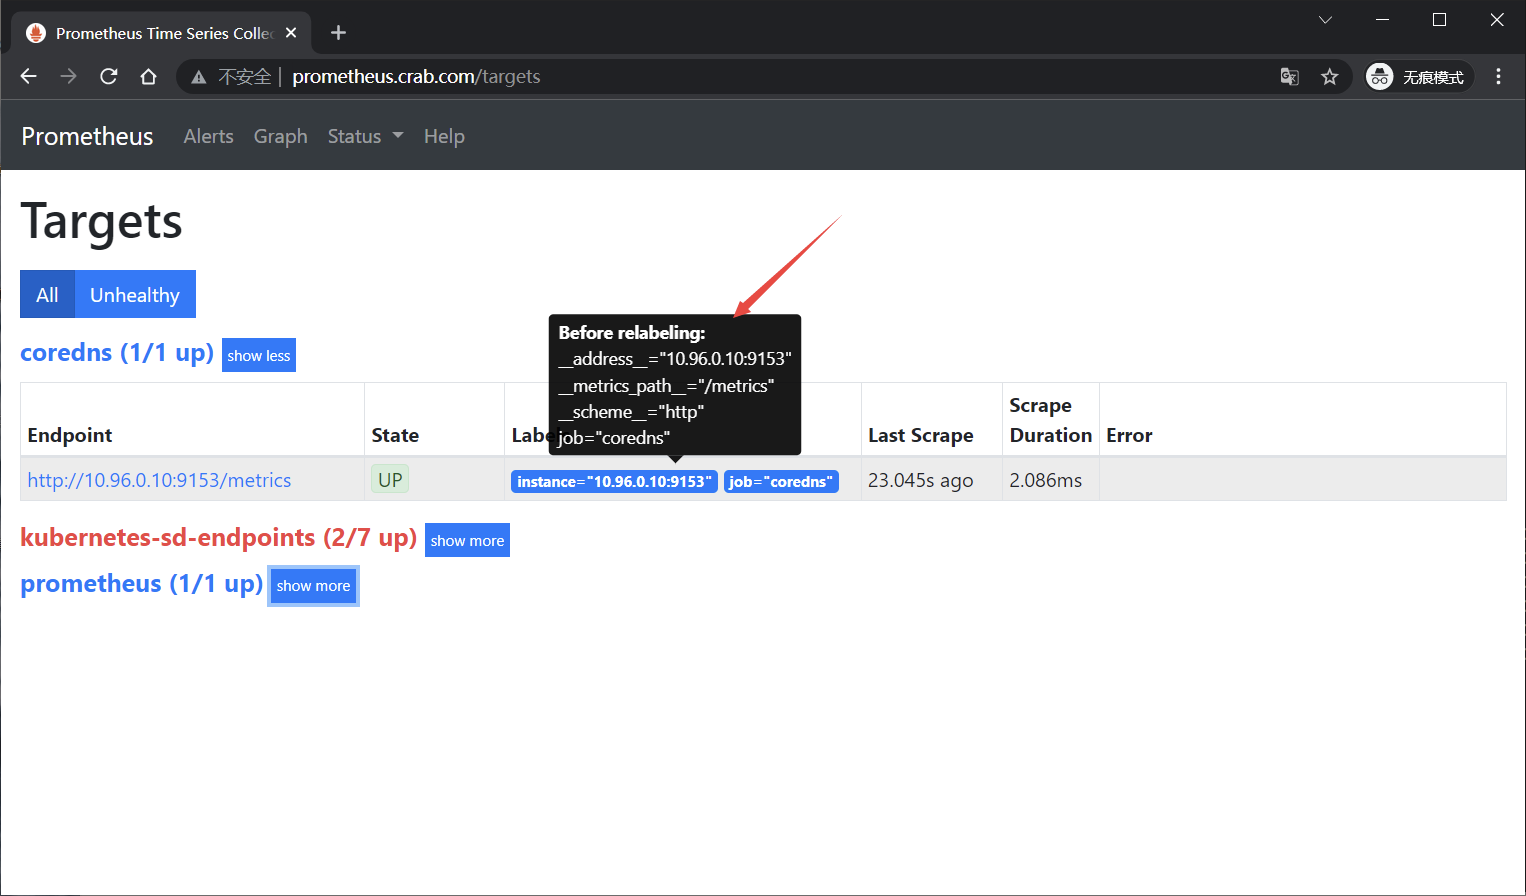
基础数据监控指标采集
对于集群的监控一般要考虑以下几个方面:
- 内部系统组件状态:kube-apiserver、kube-scheduler、kube-controller-manager、coredns 等组件
- 集群节点的监控:比如节点的 cpu、load、disk、memory 等指标
- 业务容器指标的监控(容器CPU、内存、磁盘等)
- 编排级的 metrics:比如 Deployment 的状态、资源请求、调度和 API 延迟等数据指标
节点指标采集
分析:
- 使用DaemonSet类型来管理node_exporter
- 添加节点的容忍配置
- 挂载宿主机中的系统文件信息
apiVersion: apps/v1
kind: DaemonSet
metadata:
  name: node-exporter
  namespace: monitor
  labels:
    app: node-exporter
spec:
  selector:
    matchLabels:
      app: node-exporter
  template:
    metadata:
      labels:
        app: node-exporter
    spec:
      hostPID: true
      hostIPC: true
      hostNetwork: true
      nodeSelector:
        kubernetes.io/os: linux
      containers:
      - name: node-exporter
        image: prom/node-exporter:v1.0.1
        args:
        - --web.listen-address=$(HOSTIP):9100
        - --path.procfs=/host/proc
        - --path.sysfs=/host/sys
        - --path.rootfs=/host/root
        - --collector.filesystem.ignored-mount-points=^/(dev|proc|sys|var/lib/docker/.+)($|/)
        - --collector.filesystem.ignored-fs-types=^(autofs|binfmt_misc|cgroup|configfs|debugfs|devpts|devtmpfs|fusectl|hugetlbfs|mqueue|overlay|proc|procfs|pstore|rpc_pipefs|securityfs|sysfs|tracefs)$
        ports:
        - containerPort: 9100
        env:
        - name: HOSTIP
          valueFrom:
            fieldRef:
              fieldPath: status.hostIP
        resources:
          requests:
            cpu: 150m
            memory: 180Mi
          limits:
            cpu: 150m
            memory: 180Mi
        securityContext:
          runAsNonRoot: true
          runAsUser: 65534
        volumeMounts:
        - name: proc
          mountPath: /host/proc
        - name: sys
          mountPath: /host/sys
        - name: root
          mountPath: /host/root
          mountPropagation: HostToContainer
          readOnly: true
      tolerations:
      - operator: "Exists"
      volumes:
      - name: proc
        hostPath:
          path: /proc
      - name: dev
        hostPath:
          path: /dev
      - name: sys
        hostPath:
          path: /sys
      - name: root
        hostPath:
          path: /
$ kubectl apply -f node-exporter.yaml

$ kubectl -n monitor get po -owide
node-exporter-djcqx           1/1     Running   0          110s   172.21.51.68

$ curl 172.21.51.68:9100/metrics
Prometheus 通过与 Kubernetes API 集成,提供了内置的服务发现,分别是:Node、Service、Pod、Endpoints、Ingress 。
默认访问的地址是http://node-ip:10250/metrics,10250是kubelet API的服务端口,说明Prometheus的node类型的服务发现模式默认和kubelet的10250绑定,而我们期望使用node-exporter作为采集的指标来源,故要把访问的endpoint替换成http://node-ip:9100/metrics。
查看数据可以发现,每个数据都有两个默认的label,即:
prometheus_notifications_dropped_total{instance="localhost:9090",job="prometheus"}
instance的值取自于 address,发生在采集样本数据之前,对Target实例的标签进行重写的机制被称为Relabeling。
利用relabeling的能力,将address替换成node_exporter服务地址
      - job_name: 'kubernetes-sd-node-exporter'
        kubernetes_sd_configs:
          - role: node
        relabel_configs:
        - source_labels: [__address__]
          regex: '(.*):10250'
          replacement: '${1}:9100'
          target_label: __address__
          action: replace
容器指标采集
略

若有收获,就点个赞吧
0 人点赞
