Alertmanager是一个独立的告警模块。
- 接收Prometheus等客户端发来的警报
- 通过分组、删除重复等处理,并将它们通过路由发送给正确的接收器;
- 告警方式可以按照不同的规则发送给不同的模块负责人。Alertmanager支持Email, Slack,等告警方式, 也可以通过webhook接入钉钉等国内IM工具。
服务安装
参考链接:https://github.com/prometheus/alertmanager#install
alertmanager.yml 配置文件
$ cat config.ymlapiVersion: v1data:config.yml: |global:# 当alertmanager持续多长时间未接收到告警后标记告警状态为 resolvedresolve_timeout: 5m# 配置邮件发送信息smtp_smarthost: 'smtp.163.com:25'smtp_from: 'luomurui8@163.com'smtp_auth_username: 'luomurui8@163.com'smtp_auth_password: 'GExxxxxxxxxx' #此处按需填写smtp_require_tls: false# 所有报警信息进入后的根路由,用来设置报警的分发策略route:# 接收到的报警信息包含 alertname=NodeLoadHigh,此类标签的报警信息将会批量被聚合到一个分组里面group_by: ['alertname']# 当一个新的报警分组被创建后,需要等待至少 group_wait 时间来初始化通知,如果在等待时间内当前group接收到了新的告警,这些告警将会合并为一个通知向receiver发送group_wait: 30s# 相同的group发送告警通知的时间间隔group_interval: 30s# 如果一个报警信息已经发送成功了,等待 repeat_interval 时间来重新发送repeat_interval: 1m# 默认的receiver:如果一个报警没有被一个route匹配,则发送给默认的接收器receiver: default# 上面所有的属性都由所有子路由继承,并且可以在每个子路由上进行覆盖。routes:- {}# 配置告警接收者的信息receivers:- name: 'default'email_configs:- to: 'kazihuo8@qq.com'send_resolved: true # 接受告警恢复的通知kind: ConfigMapmetadata:name: alertmanagernamespace: monitor
主要配置的作用:
- global: 全局配置,包括报警解决后的超时时间、SMTP 相关配置、各种渠道通知的 API 地址等等。
- route: 用来设置报警的分发策略,它是一个树状结构,按照深度优先从左向右的顺序进行匹配。
- receivers: 配置告警消息接受者信息,例如常用的 email、wechat、slack、webhook 等消息通知方式。
资源清单文件:
$ cat alertmanager-all.yamlapiVersion: apps/v1kind: Deploymentmetadata:name: alertmanagernamespace: monitorlabels:app: alertmanagerspec:selector:matchLabels:app: alertmanagertemplate:metadata:labels:app: alertmanagerspec:volumes:- name: configconfigMap:name: alertmanagercontainers:- name: alertmanagerimage: prom/alertmanager:v0.21.0imagePullPolicy: IfNotPresentargs:- "--config.file=/etc/alertmanager/config.yml"- "--log.level=debug"ports:- containerPort: 9093name: httpvolumeMounts:- mountPath: "/etc/alertmanager"name: configresources:requests:cpu: 100mmemory: 256Milimits:cpu: 100mmemory: 256Mi---apiVersion: v1kind: Servicemetadata:name: alertmanagernamespace: monitorspec:type: ClusterIPports:- port: 9093selector:app: alertmanager---apiVersion: networking.k8s.io/v1kind: Ingressmetadata:name: alertmanagernamespace: monitorspec:rules:- host: alertmanager.crab.comhttp:paths:- path: /pathType: Prefixbackend:service:name: alertmanagerport:number: 9093
$ kubectl apply -f config.yml$ kubectl apply -f alertmanager-all.yaml
配置Prometheus与Alertmanager对话
是否告警是由 Prometheus 进行判断的,若有告警产生,Prometheus 会将告警 push 到 Alertmanager,所以需要在 Prometheus 端配置 alertmanager 的地址:
    alerting:
      alertmanagers:
      - static_configs:
        - targets:
          - alertmanager:9093
修改 Prometheus 的配置文件,然后重新加载 pod
# 编辑prometheus-configmap.yaml配置,添加alertmanager内容
$ kubectl -n monitor edit configmap prometheus-config
apiVersion: v1
kind: ConfigMap
metadata:
  name: prometheus-config
  namespace: monitor
data:
  prometheus.yml: |
    global:
      scrape_interval: 30s
      evaluation_interval: 30s
    alerting:
      alertmanagers:
      - static_configs:
        - targets:
          - alertmanager:9093
...

# 查看配置文件是否已经自动加载到pod中
$ kubectl -n monitor get po -o wide
prometheus-dcb499cbf-pljfn  1/1  Running  0  47h  10.244.1.167

$ kubectl -n monitor exec -ti prometheus-dcb499cbf-pljfn cat /etc/prometheus/prometheus.yml |grep alertmanager

# 使用软加载的方式使的更改的配置生效,也可以 delete pod 让其自动重建
$ curl -X POST 10.244.1.167:9090/-/reload
配置报警规则
Prometheus 与 Alertmanager 连通后,可以针对收集到的各类指标配置报警规则。当满足报警规则设置,Prometheus 将报警信息推送给 Alertmanager,进而转发到配置的邮件。
编辑 prometheus-configmap
$ kubectl -n monitor edit configmap prometheus-config
apiVersion: v1
kind: ConfigMap
metadata:
  name: prometheus-config
  namespace: monitor
data:
  prometheus.yml: |
    global:
      scrape_interval: 30s
      evaluation_interval: 30s
    alerting:
      alertmanagers:
      - static_configs:
        - targets:
          - alertmanager:9093
    # Load rules once and periodically evaluate them according to the global  'evaluation_interval'.
    rule_files:
      - /etc/prometheus/alert_rules.yml
      # - "first_rules.yml"
      # - "second_rules.yml"
    scrape_configs:
    - job_name: 'prometheus'
      static_configs:
      - targets: ['localhost:9090']
...
$ vim prometheus-configmap.yaml
apiVersion: v1
kind: ConfigMap
metadata:
  name: prometheus-config
  namespace: monitor
data:
  prometheus.yml: |
    global:
      scrape_interval: 15s
      evaluation_interval: 15s
    alerting:
      alertmanagers:
      - static_configs:
        - targets:
          - alertmanager:9093
    # Load rules once and periodically evaluate them according to the global  'evaluation_interval'.
    rule_files:
      - /etc/prometheus/alert_rules.yml
      # - "first_rules.yml"
      # - "second_rules.yml"
    scrape_configs:
    - job_name: 'prometheus'
      static_configs:
      - targets: ['localhost:9090']
... # 省略中间部分
  alert_rules.yml: |
    groups:
    - name: node_metrics
      rules:
      - alert: NodeLoad
        expr: node_load15 < 1
        for: 2m
        annotations:
          summary: "{{$labels.instance}}: Low node load detected"
          description: "{{$labels.instance}}: node load is below 1 (current value is: {{ $value }}"
prometheus-configmap.yaml包含两个文件prometheus.yml和alert_rules.yml

也可通过文件创建configmap
$ kubectl -n monitor create cm prometheus-config --from-file=prometheus.yml --from-file=alert_rules.yml
告警规则要素:
group.name:告警分组的名称,一个组下可以配置一类告警规则alert:告警规则的名称expr:是用于进行报警规则 PromQL 查询语句,expr 通常是布尔表达式,可以让Prometheus根据计算的指标值做 true or false 的判断for:评估等待时间,用于表示只有当触发条件持续一段时间后才发送告警,在等待期间新产生的告警状态为pending,屏蔽掉瞬时的问题,把焦点放在真正有持续影响的问题上labels:自定义标签,允许用户指定额外的标签列表,附加在告警上,可以用于后面做路由判断,通知到不同的终端,通常被用于添加告警级别的标签annotations:指定了另一组标签,它们不被当做告警实例的身份标识,用于存储额外的信息,报警信息展示之类等
规则配置中支持模板的方式:
- {{$labels.instance}}或者{{$labels.job}}这种形式
- {{$value}}可以获取当前计算出的指标值
更新配置并重启,并查看Prometheus报警规则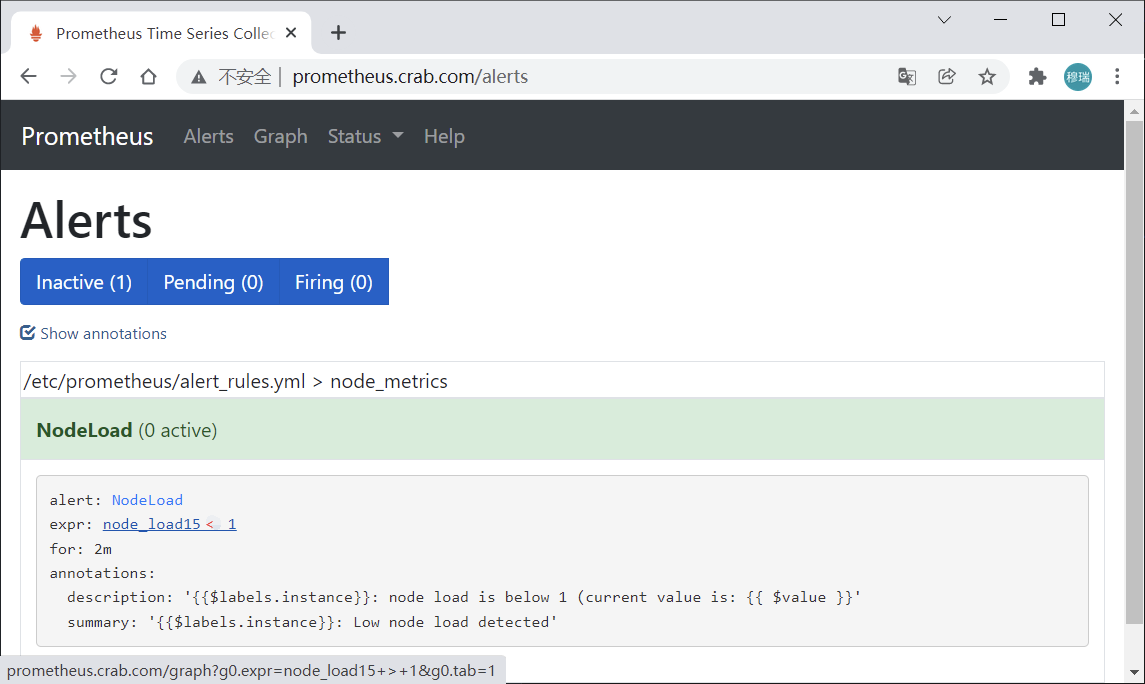
一个报警信息在生命周期内有下面3种状态:
inactive: 表示当前报警信息处于非活动状态,即不满足报警条件pending: 表示在设置的阈值时间范围内被激活了,即满足报警条件,但是还在观察期内firing: 表示超过设置的阈值时间被激活了,即满足报警条件,且报警触发时间超过了观察期,会发送到Alertmanager端
对于已经 pending 或者 firing 的告警,Prometheus 会将它们存储到时间序列ALERTS{}中。可以通过表达式去查询告警实例: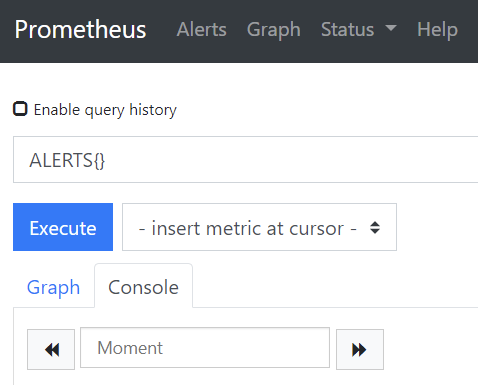
查看Alertmanager日志:
level=warn ts=2021-12-20T07:45:19.655Z caller=notify.go:674 component=dispatcher receiver=default integration=email[0] msg="Notify attempt failed, will retry later" attempts=1 err="*email.loginAuth auth: 550 User has no permission"
...
level=warn ts=2021-12-20T07:50:28.250Z caller=notify.go:674 component=dispatcher receiver=default integration=email[0] msg="Notify attempt failed, will retry later" attempts=1 err="*email.loginAuth auth: 535 Error: authentication failed"
...
说明告警已经推送到Alertmanager端,但邮箱登录报错,因为邮箱默认没有开启第三方客户端登录。因此要登录163邮箱设置SMTP服务允许客户端登录。
登陆邮箱后点击设置,将如下内容开启即可
因现有集群的 node_load15 默认都小于 1 ,几分钟后邮箱 kazihuo8@qq.com 接收到告警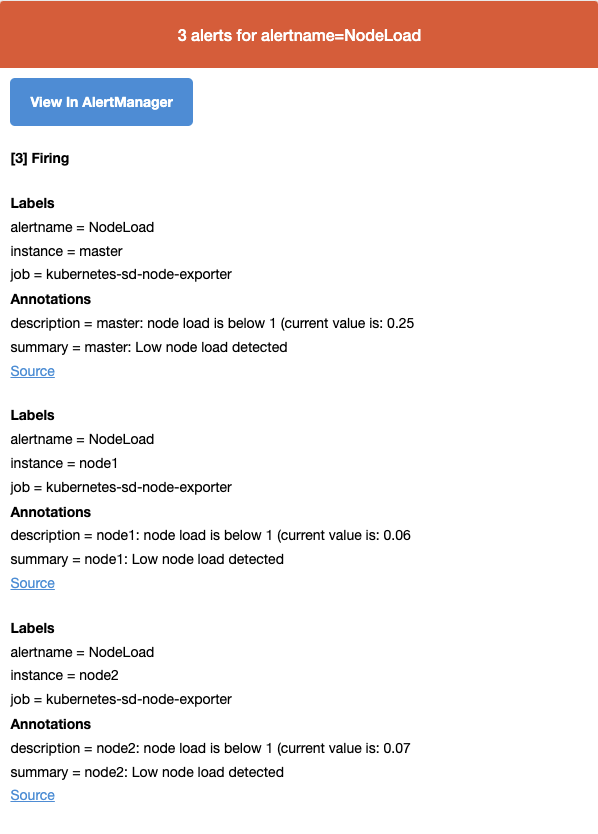
自定义webhook实现告警
每一个 receiver 具有一个全局唯一的名称,并且对应一个或者多个通知方式:
name: <string>
email_configs:
  [ - <email_config>, ... ]
hipchat_configs:
  [ - <hipchat_config>, ... ]
slack_configs:
  [ - <slack_config>, ... ]
opsgenie_configs:
  [ - <opsgenie_config>, ... ]
webhook_configs:
  [ - <webhook_config>, ... ]
Alertmanager 通知方式可以支持 Webhook
# 警报接收者
receivers:
#ops
- name: 'demo-webhook'
  webhook_configs:
  - send_resolved: true
    url: http://demo-webhook/alert/send
当告警路由到demo-webhook时,alertmanager 端会向 webhook 地址推送POST请求
$ curl -X POST -d"$demoAlerts"  http://demo-webhook/alert/send
$ echo $demoAlerts
{
  "version": "4",
  "groupKey": <string>, alerts (e.g. to deduplicate) ,
  "status": "<resolved|firing>",
  "receiver": <string>,
  "groupLabels": <object>,
  "commonLabels": <object>,
  "commonAnnotations": <object>,
  "externalURL": <string>, // backlink to the Alertmanager.
  "alerts":
   [{
     "labels": <object>,
      "annotations": <object>,
      "startsAt": "<rfc3339>",
      "endsAt": "<rfc3339>"
   }]
}
webhook-dingtalk 功能:
1、暴露 url ,配置到 alertmanager,接收 alertmanager 告警推送;
2、解析 alertmanager 推送的告警流程,封装成 dingtalk 的 api 数据格式,调用 dingtalk 的 api ,推送消息。
报警消息自动推送到钉钉群聊,步骤:
- 实现一个webhook,部署到k8s集群,接收POST请求,将Alertmanager传过来的数据做解析,调用dingtalk的API,实现消息推送
- 配置alertmanager的receiver为webhook地址
钉钉群聊机器人设置
创建钉钉群
依次点击 右上角“+” > 发起群聊 > 值班群 > 设置群名称 > 创建 即可。
群里添加机器人
依次点击 群设置 > 智能群助手 > 添加机器人 > 自定义(通过webhook接入自定义服务)
点击完成后,出现Webhook 地址
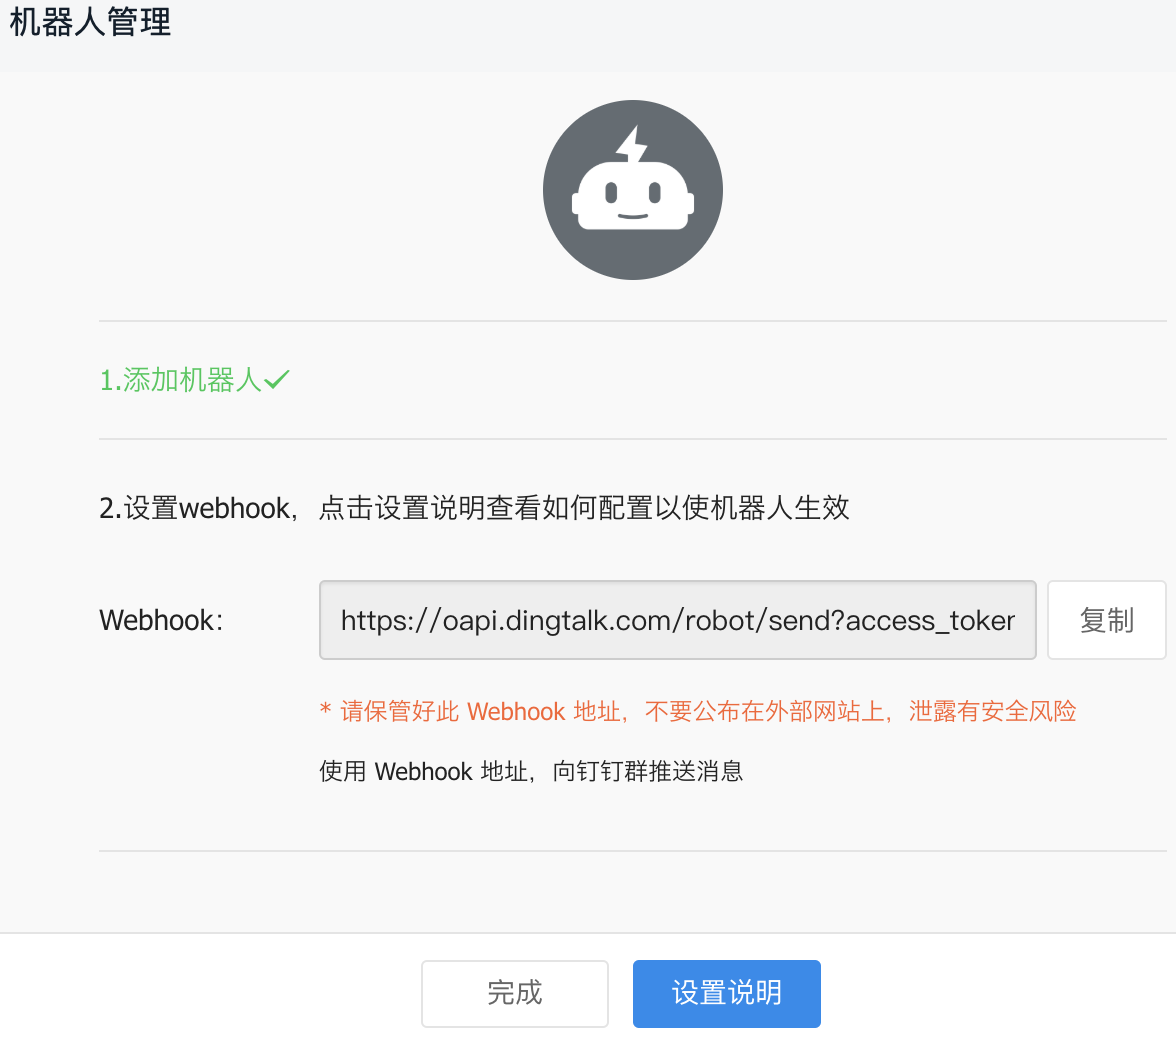
每个群聊机器人在生成时会产生唯一的 token
https://oapi.dingtalk.com/robot/send?access_token=f628f749a7ad70e86ca7bcb68658d0ce5af7c201ce8ce32acaece4c592364ca9
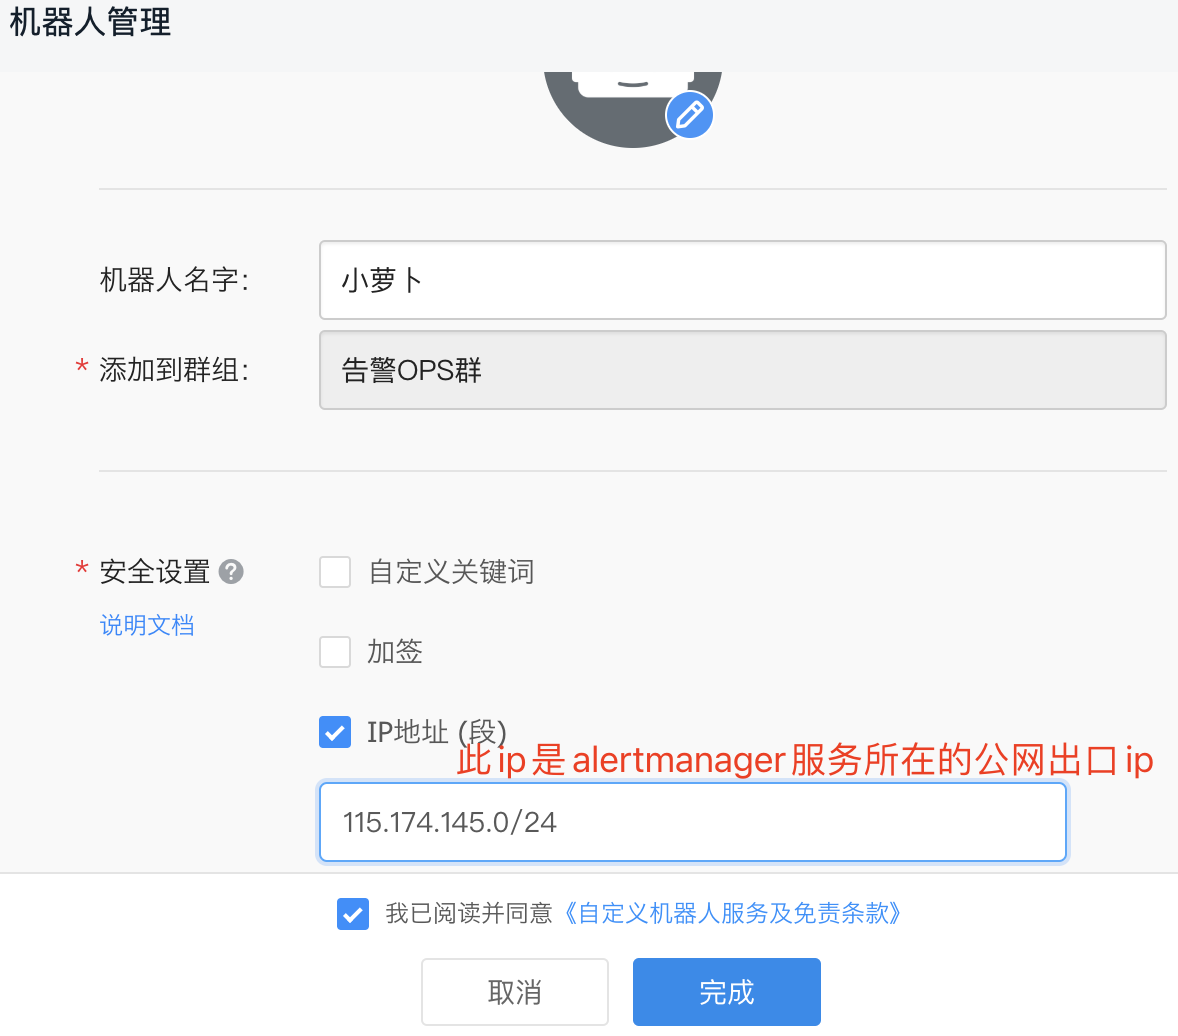
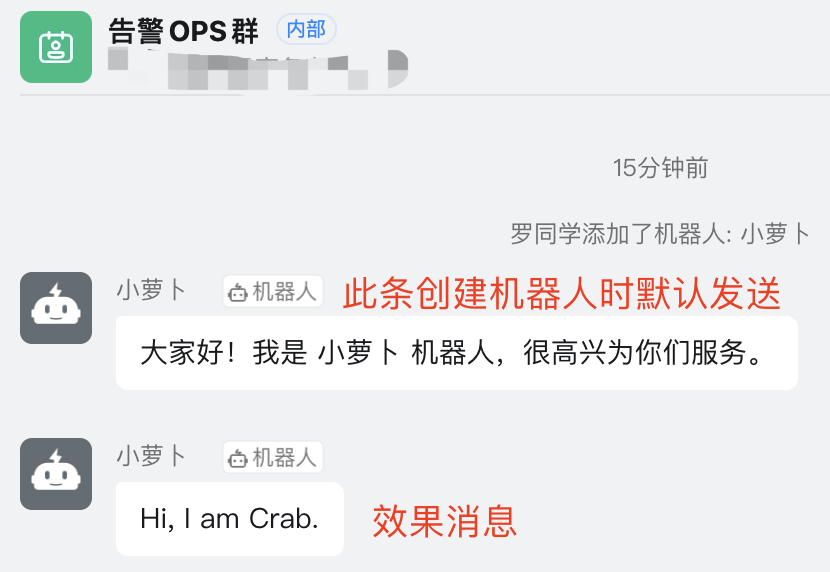
命令方式模拟给群聊机器人发送请求实现消息的推送(只能在加了 ip 白名单的外网出口网络内的机器上执行)
[root@master ~]# curl 'https://oapi.dingtalk.com/robot/send?access_token=f628f749a7ad70e86ca7bcb68658d0ce5af7c201ce8ce32acaece4c592364ca9' \
   -H 'Content-Type: application/json' \
   -d '{"msgtype": "text","text": {"content": "Hi, I am Crab."}}'
群消息
钉钉群接入告警实现
Git地址:https://gitee.com/agagin/prometheus-webhook-dingtalk
镜像地址:timonwong/prometheus-webhook-dingtalk:master
一个webhook实现多个群消息发送
二进制运行:
$ ./prometheus-webhook-dingtalk --config.file=config.yml
假如使用如下配置:
targets:
  webhook_dev:
    url: https://oapi.dingtalk.com/robot/send?access_token=f628f749a7ad70e86ca7bcb68658d0ce5af7c201ce8ce32acaece4c592364ca9
  webhook_ops:
    url: https://oapi.dingtalk.com/robot/send?access_token=d4e7b72eab6d1b2245bc0869d674f627dc187577a3ad485d9c1d131b7d67b15b
则 prometheus-webhook-dingtalk 启动后会自动支持如下API的POST访问:
http://locahost:8060/dingtalk/webhook_dev/send
http://localhost:8060/dingtalk/webhook_ops/send
这样可以使用一个 prometheus-webhook-dingtalk 来实现多个钉钉群的 webhook 地址。
部署prometheus-webhook-dingtalk
$ cat webhook-dingtalk-configmap.yaml
apiVersion: v1
data:
  config.yml: |
    targets:
      webhook_dev:
        url: https://oapi.dingtalk.com/robot/send?access_token=f628f749a7ad70e86ca7bcb68658d0ce5af7c201ce8ce32acaece4c592364ca9
kind: ConfigMap
metadata:
  name: webhook-dingtalk-config
  namespace: monitor
$ cat webhook-dingtalk-deploy.yaml
apiVersion: apps/v1
kind: Deployment
metadata:
  name: webhook-dingtalk
  namespace: monitor
spec:
  selector:
    matchLabels:
      app: webhook-dingtalk
  template:
    metadata:
      labels:
        app: webhook-dingtalk
    spec:
      containers:
      - name: webhook-dingtalk
        image: timonwong/prometheus-webhook-dingtalk:master
        args:
        - "--config.file=/etc/prometheus-webhook-dingtalk/config.yml"
        imagePullPolicy: IfNotPresent
        volumeMounts:
        - mountPath: "/etc/prometheus-webhook-dingtalk/config.yml"
          name: config
          subPath: config.yml
        ports:
        - containerPort: 8060
          name: http
        resources:
          requests:
            cpu: 50m
            memory: 100Mi
          limits:
            cpu: 50m
            memory: 100Mi
      volumes:
      - name: config
        configMap:
          name: webhook-dingtalk-config
          items:
          - key: config.yml
            path: config.yml
---
apiVersion: v1
kind: Service
metadata:
  name: webhook-dingtalk
  namespace: monitor
spec:
  selector:
    app: webhook-dingtalk
  ports:
  - name: hook
    port: 8060
    targetPort: http
创建:
$ kubectl apply -f webhook-dingtalk-configmap.yaml
$ kubectl apply -f webhook-dingtalk-deploy.yaml

# 查看日志,可以得知当前的可用webhook日志
$ kubectl -n monitor logs -f webhook-dingtalk-f7f5589c9-qglkd
...
level=info ts=2021-12-22T07:49:49.338Z caller=main.go:98 component=configuration msg="Loading templates" templates=
ts=2021-12-22T07:49:49.338Z caller=main.go:114 component=configuration msg="Webhook urls for prometheus alertmanager" urls=http://localhost:8060/dingtalk/webhook_dev/send
level=info ts=2021-12-22T07:49:49.338Z caller=web.go:210 component=web msg="Start listening for connections" address=:8060
修改 Alertmanager 路由及 webhook 配置(修改完cm后要删除alertmanager pod,让其自动新建加载更新的 cm 内容):
$ kubectl -n monitor edit configmap alertmanager
apiVersion: v1
kind: ConfigMap
metadata:
  name: alertmanager
  namespace: monitor
data:
  config.yml: |-
    global:
      # 当alertmanager持续多长时间未接收到告警后标记告警状态为 resolved
      resolve_timeout: 5m
      # 配置邮件发送信息
      smtp_smarthost: 'smtp.163.com:25'
      smtp_from: 'luomurui8@163.com'
      smtp_auth_username: 'luomurui8@163.com'
      # 注意这里不是邮箱密码,是邮箱开启第三方客户端登录后的授权码
      smtp_auth_password: 'GXxxxxxxxxxxxxAJ'
      smtp_require_tls: false
    # 所有报警信息进入后的根路由,用来设置报警的分发策略
    route:
      # 按照告警名称分组
      group_by: ['alertname']
      # 当一个新的报警分组被创建后,需要等待至少 group_wait 时间来初始化通知,这种方式可以确保您能有足够的时间为同一分组来获取多个警报,然后一起触发这个报警信息。
      group_wait: 30s

      # 相同的group之间发送告警通知的时间间隔
      group_interval: 30s

      # 如果一个报警信息已经发送成功了,等待 repeat_interval 时间来重新发送他们,不同类型告警发送频率需要具体配置
      repeat_interval: 1m

      # 默认的receiver:如果一个报警没有被一个route匹配,则发送给默认的接收器
      receiver: default

      # 路由树,默认继承global中的配置,并且可以在每个子路由上进行覆盖。
      routes:
      - {}
    receivers:
    - name: 'default'
      email_configs:
      - to: 'kazihuo8@qq.com'
        send_resolved: true  # 接受告警恢复的通知
      webhook_configs:
      - send_resolved: true
        url: http://webhook-dingtalk:8060/dingtalk/webhook_dev/send
验证钉钉消息是否正常收到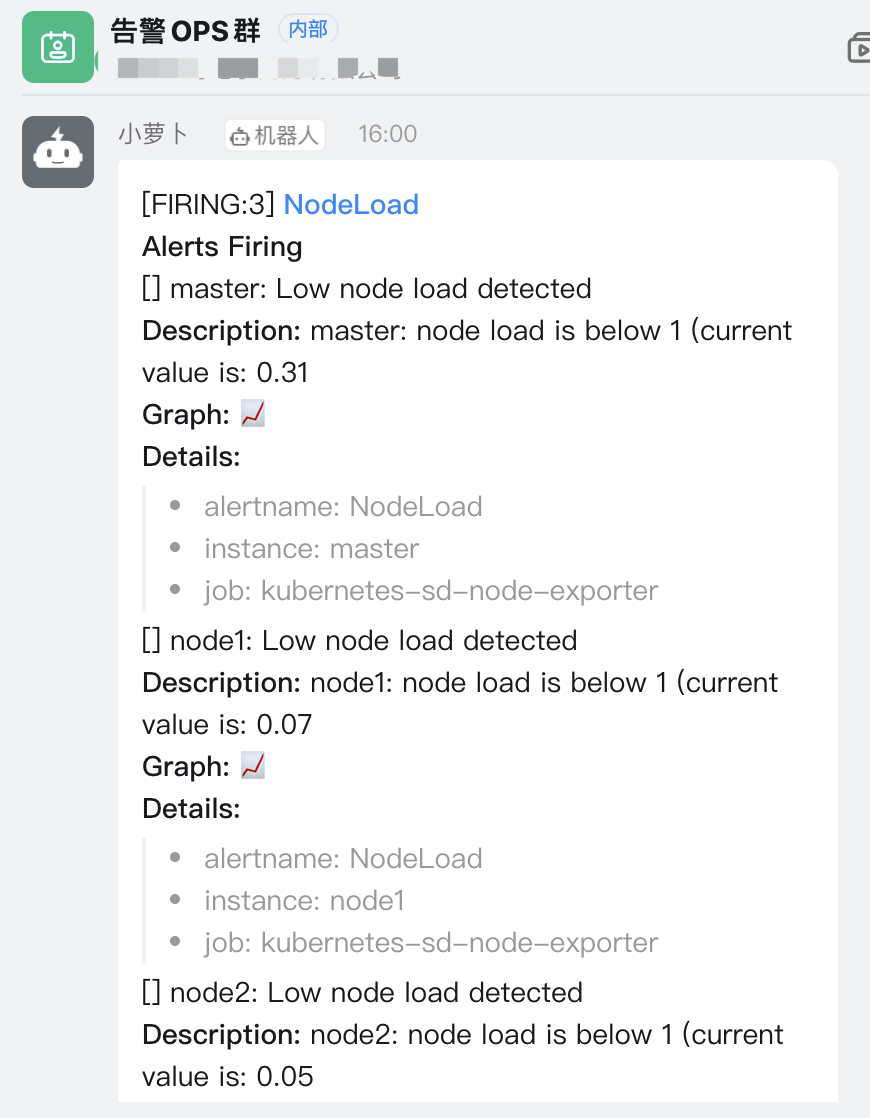
基于Label的动态告警处理
真实场景中往往期望可以给告警设置级别,实现不同的报警级别可以由不同的 receiver 接收告警消息。
Alertmanager 中路由负责对告警信息进行分组匹配,并向告警接收器发送通知。告警接收器可以通过以下形式进行配置:
routes:
- receiver: ops
  group_wait: 10s
  match:
    severity: critical
- receiver: dev
  group_wait: 10s
  match_re:
    severity: normal|middle
receivers:
  - ops
    ...
  - dev
    ...
  - <receiver> ...
为了更全面的感受报警的逻辑,再添加两个报警规则:
  alert_rules.yml: |
    groups:
    - name: node_metrics
      rules:
      - alert: NodeLoad
        expr: node_load15 < 1
        for: 2m
        labels:
          severity: normal
        annotations:
          summary: "{{$labels.instance}}: Low node load detected"
          description: "{{$labels.instance}}: node load is below 1 (current value is: {{ $value }}"
      - alert: NodeMemoryUsage
        expr: (node_memory_MemTotal_bytes - (node_memory_MemFree_bytes + node_memory_Buffers_bytes + node_memory_Cached_bytes)) / node_memory_MemTotal_bytes * 100 > 30
        for: 2m
        labels:
          severity: critical
        annotations:
          summary: "{{$labels.instance}}: High Memory usage detected"
          description: "{{$labels.instance}}: Memory usage is above 40% (current value is: {{ $value }}"
    - name: targets_status
      rules:
      - alert: TargetStatus
        expr: up == 0
        for: 1m
        labels:
          severity: critical
        annotations:
          summary: "{{$labels.instance}}: prometheus target down"
          description: "{{$labels.instance}}: prometheus target down,job is {{$labels.job}}"
不同的报警规则设置了不同的标签,如 severity: critical,针对规则中的label,来配置alertmanager路由规则,实现转发给不同的接收者。
$ cat alertmanager-configmap.yaml
apiVersion: v1
kind: ConfigMap
metadata:
  name: alertmanager
  namespace: monitor
data:
  config.yml: |-
    global:
      # 当alertmanager持续多长时间未接收到告警后标记告警状态为 resolved
      resolve_timeout: 5m
      # 配置邮件发送信息
      smtp_smarthost: 'smtp.163.com:25'
      smtp_from: 'luomurui8@163.com'
      smtp_auth_username: 'luomurui8@163.com'
      # 注意这里不是邮箱密码,是邮箱开启第三方客户端登录后的授权码
      smtp_auth_password: 'RxxxxxxxxxxxZ'
      smtp_require_tls: false
    # 所有报警信息进入后的根路由,用来设置报警的分发策略
    route:
      # 按照告警名称分组
      group_by: ['alertname']
      # 当一个新的报警分组被创建后,需要等待至少 group_wait 时间来初始化通知,这种方式可以确保您能有足够的时间为同一分组来获取多个警报,然后一起触发这个报警信息。
      group_wait: 30s

      # 相同的group之间发送告警通知的时间间隔
      group_interval: 30s

      # 如果一个报警信息已经发送成功了,等待 repeat_interval 时间来重新发送他们,不同类型告警发送频率需要具体配置
      repeat_interval: 1m

      # 默认的receiver:如果一个报警没有被一个route匹配,则发送给默认的接收器
      receiver: default

      # 路由树,默认继承global中的配置,并且可以在每个子路由上进行覆盖。
      routes:
      - receiver: critical_alerts
        group_wait: 10s
        match:
          severity: critical
      - receiver: normal_alerts
        group_wait: 10s
        match_re:
          severity: normal|middle
    receivers:
    - name: 'default'
      email_configs:
      - to: 'kazihuo8@qq.com'
        send_resolved: true  # 接受告警恢复的通知
    - name: 'critical_alerts'
      webhook_configs:
      - send_resolved: true
        url: http://webhook-dingtalk:8060/dingtalk/webhook_ops/send
    - name: 'normal_alerts'
      webhook_configs:
      - send_resolved: true
        url: http://webhook-dingtalk:8060/dingtalk/webhook_dev/send
再配置一个钉钉机器人,修改 webhook-dingtalk 的配置,添加 webhook_ops 的配置:
$ cat webhook-dingtalk-configmap.yaml
apiVersion: v1
data:
  config.yml: |
    targets:
      webhook_dev:
        url: https://oapi.dingtalk.com/robot/send?access_token=f628f749a7ad70e86ca7bcb68658d0ce5af7c201ce8ce32acaece4c592364ca9
      webhook_ops:
        url: https://oapi.dingtalk.com/robot/send?access_token=5a68888fbecde75b1832ff024d7374e51f2babd33f1078e5311cdbb8e2c00c3a
kind: ConfigMap
metadata:
  name: webhook-dingtalk-config
  namespace: monitor
分别更新Prometheus和Alertmanager配置,查看报警的发送。
抑制和静默
告警的group(分组)功能通过把多条告警数据聚合,有效的减少告警的频繁发送。Alertmanager支持Inhibition(抑制) 和 Silences(静默),抑制或者屏蔽报警。
Inhibition 抑制
抑制是当出现其它告警的时候压制当前告警的通知,可以有效的防止告警风暴。
比如当机房出现网络故障时,所有服务都将不可用而产生大量服务不可用告警,但这些警告并不能反映真实问题在哪,真正需要发出的应该是网络故障告警。当出现网络故障告警的时候,应当抑制服务不可用告警的通知。
在 Alertmanager 配置文件中,使用 inhibit_rules 定义一组告警的抑制规则:
inhibit_rules:
  [ - <inhibit_rule> ... ]
每一条抑制规则的具体配置如下:
target_match:
  [ <labelname>: <labelvalue>, ... ]
target_match_re:
  [ <labelname>: <regex>, ... ]

source_match:
  [ <labelname>: <labelvalue>, ... ]
source_match_re:
  [ <labelname>: <regex>, ... ]

[ equal: '[' <labelname>, ... ']' ]
当已经发送的告警通知匹配到target_match或者target_match_re规则,当有新的告警规则如果满足source_match或者定义的匹配规则,并且已发送的告警与新产生的告警中equal定义的标签完全相同,则启动抑制机制,新的告警不会发送。
例如,定义如下抑制规则:
- source_match:
    alertname: NodeDown
    severity: critical
  target_match:
    severity: critical
  equal:
    - node
如当集群中的某一个主机节点异常宕机导致告警NodeDown被触发,同时在告警规则中定义了告警级别severity=critical。由于主机异常宕机,该主机上部署的所有服务,中间件会不可用并触发报警。根据抑制规则的定义,如果有新的告警级别为severity=critical,并且告警中标签node的值与NodeDown告警的相同,则说明新的告警是由NodeDown导致的,则启动抑制机制停止向接收器发送通知。
演示:实现如果 NodeMemoryUsage 报警触发,则抑制NodeLoad指标规则引起的报警。
    inhibit_rules:
    - source_match:
        alertname: NodeMemoryUsage
        severity: critical
      target_match:
        severity: normal
      equal:
        - instance
Silences 静默
简单直接的在指定时段关闭告警。静默通过匹配器(Matcher)来配置,类似于路由树。警告进入系统的时候会检查它是否匹配某条静默规则,如果是则该警告的通知将忽略。 静默规则在 Alertmanager 的 Web 界面里配置。
一条告警产生后,还要经过 Alertmanager 的分组、抑制处理、静默处理、去重处理和降噪处理最后再发送给接收者。这个过程中可能会因为各种原因会导致告警产生了却最终没有进行通知,可以通过下图了解整个告警的生命周期: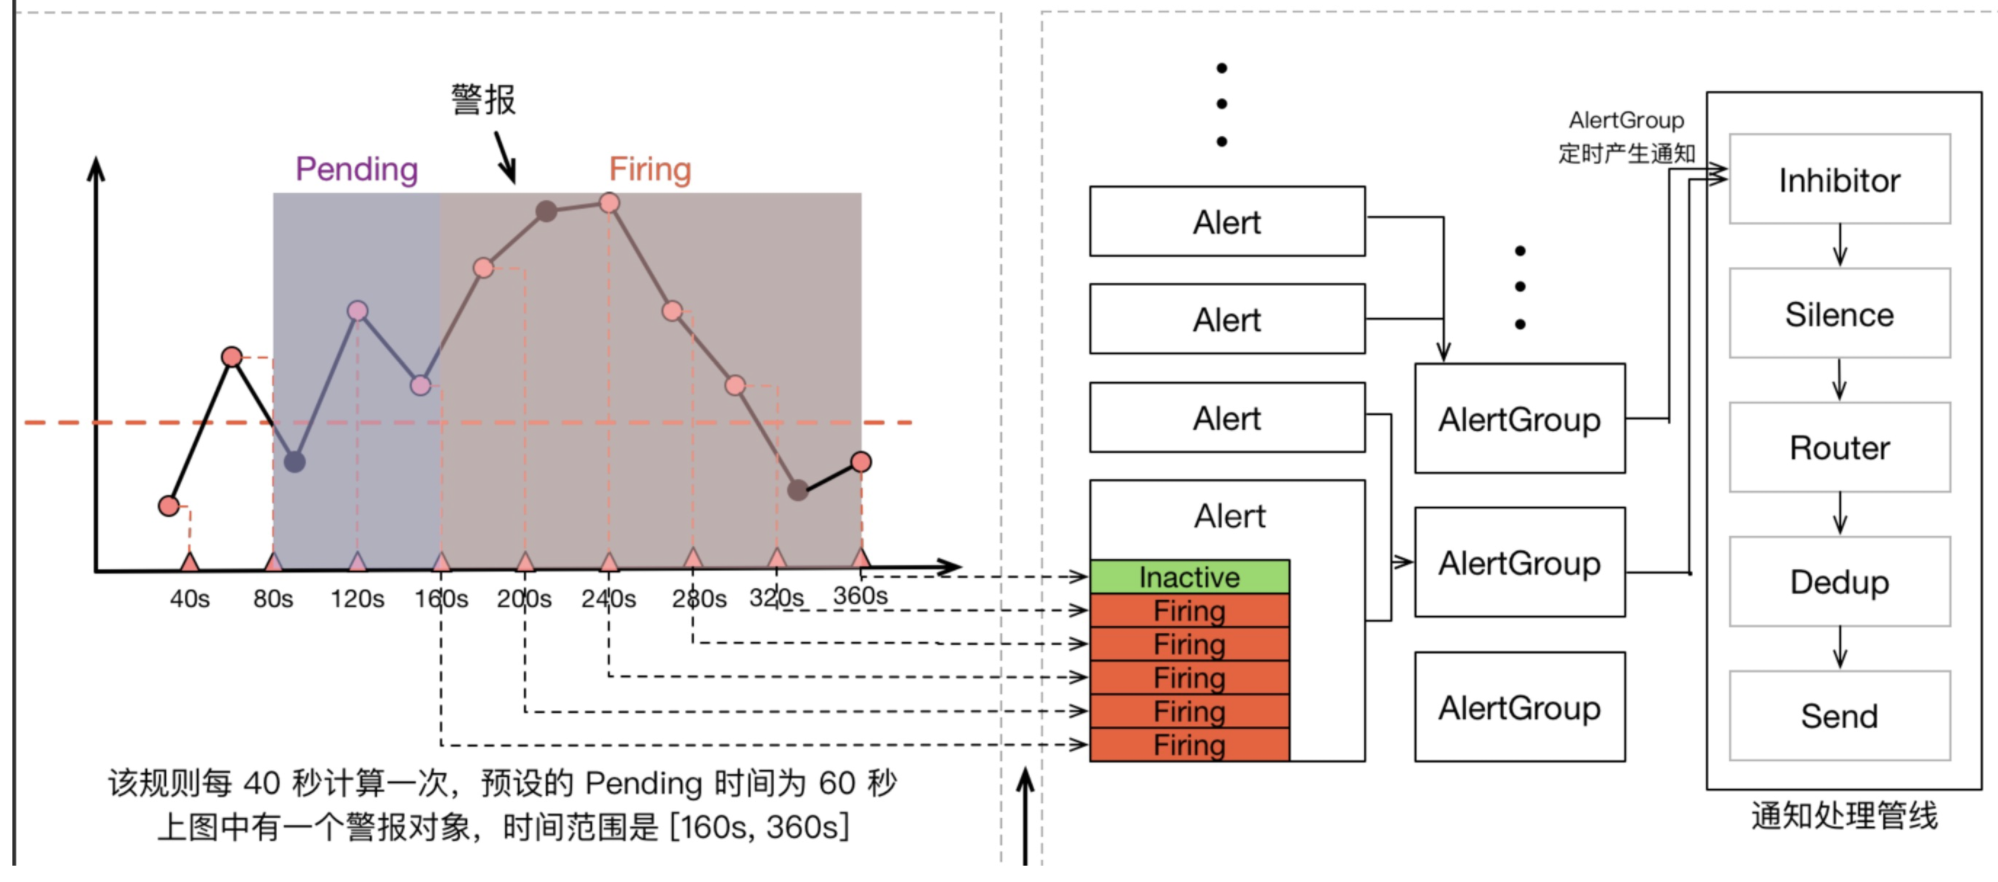

若有收获,就点个赞吧
0 人点赞
