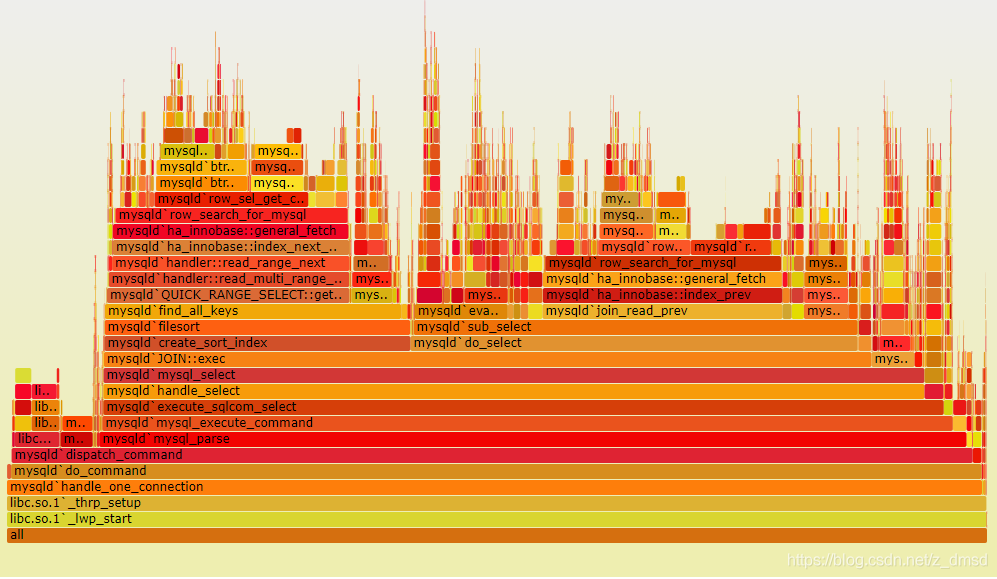
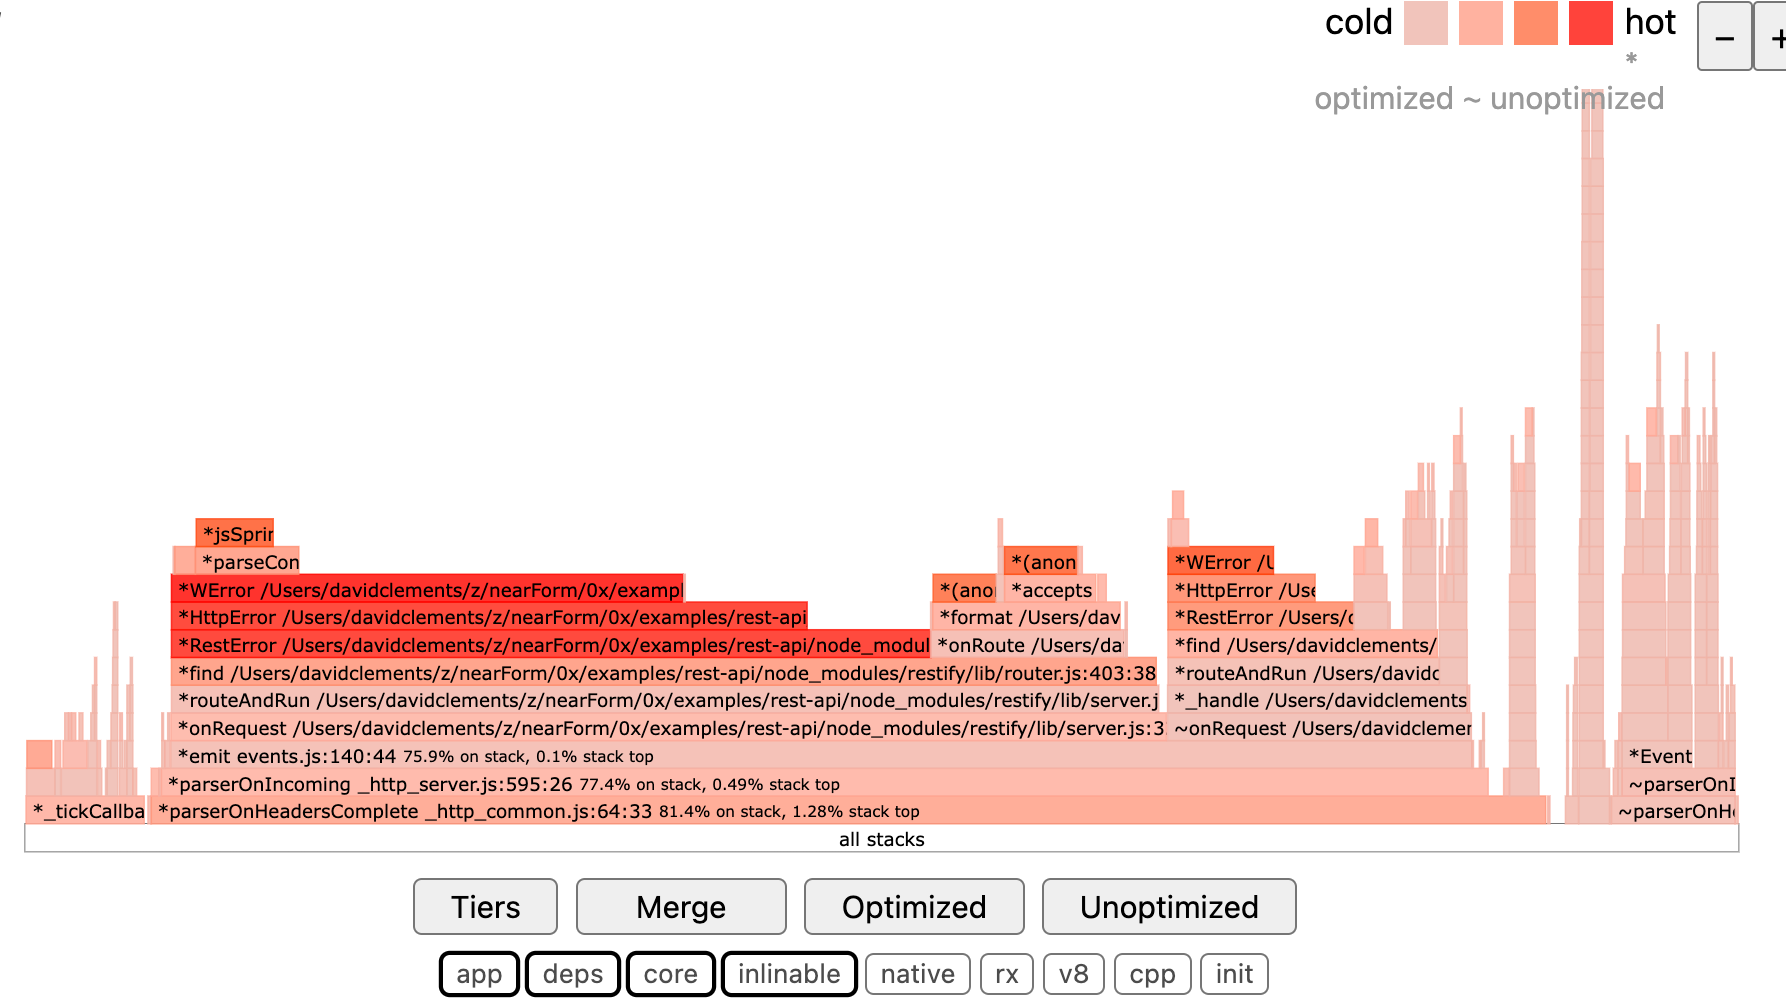
火焰图,排查计算密集型 CPU
https://github.com/brendangregg/FlameGraph
https://www.brendangregg.com/flamegraphs.html
- X轴,表示时间长度
- 就是占用的CPU时间
- Y轴,从上到下
- 越接近底部,表示越接近系统的底层
- 对于 nodejs来说,上层是 js代码,下层是 C代码
- 每一层,每个条幅越宽;表示在整个运行周期中,占用的CPU越多
带你入门火焰图
https://zhuanlan.zhihu.com/p/486792358
https://blog.51cto.com/u_15291238/2969048
https://blog.csdn.net/qq_25518029/article/details/120363264
火焰图(Flame graphs)可视化分析
https://segmentfault.com/a/1190000038695591
0x火焰图
https://github.com/davidmarkclements/0x
http://davidmarkclements.github.io/0x-demo
0x my-app.js

charts火焰图
https://blog.csdn.net/z_dmsd/article/details/107214354
grafana-flamegraph-panel
https://github.com/samber/grafana-flamegraph-panel
npm install -g promfiler
d3火焰图
https://www.npmjs.com/package/d3-flame-graph
从分层数据生成火焰图
npm install d3-flame-graph --save

