Kdump 原理
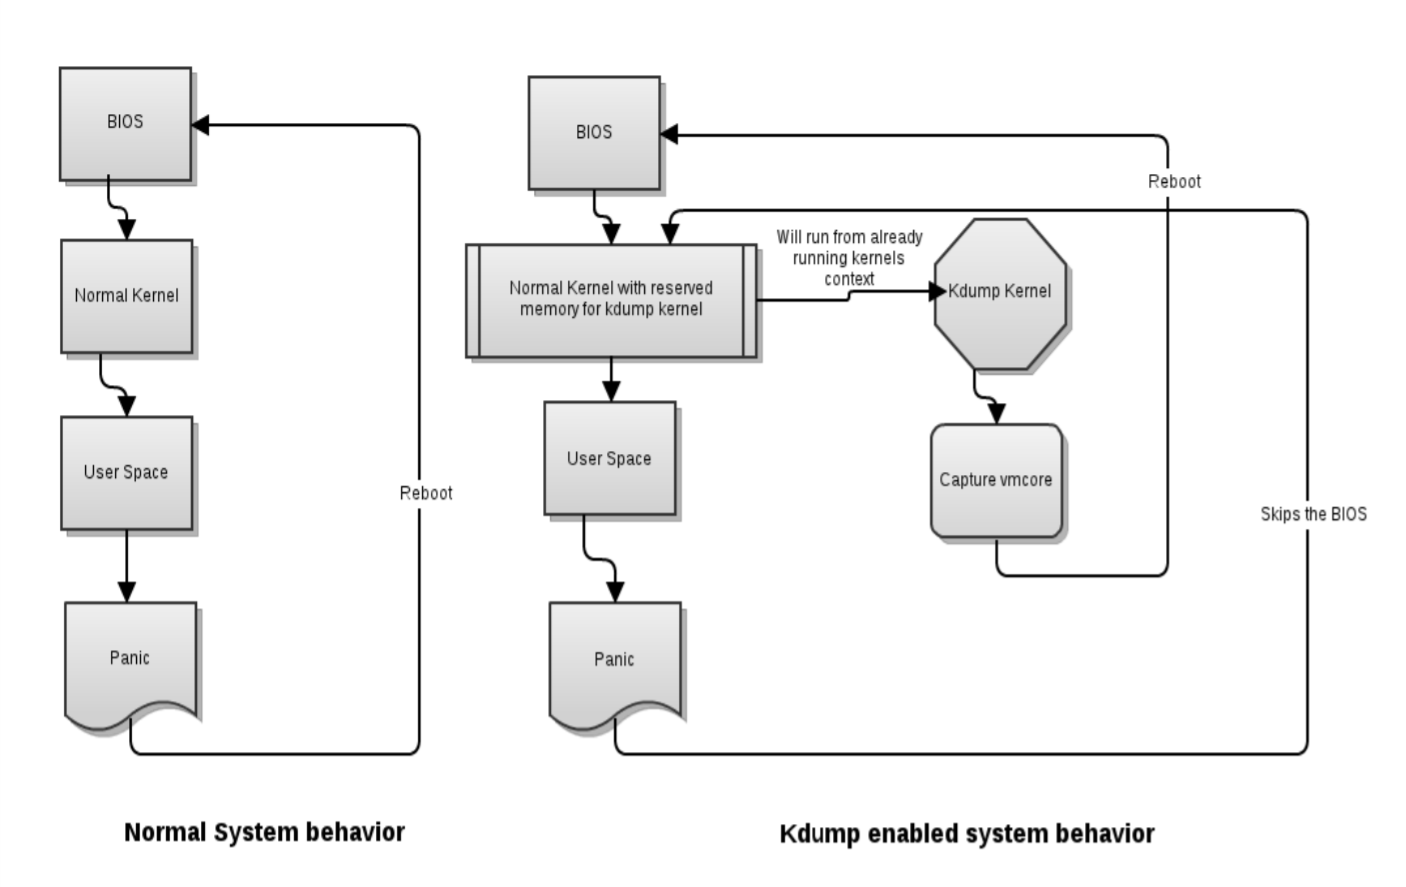
通过Kdump 服务和 Kexec 命令能够让系统在快速的创建一个可靠的内核(vmcores)进行诊断(绕过BIOS ,减少启动第二内核的时间)。
组件
kexec command
kexec 能够快速并且自动从已经运行的内核上下文中启动一个Linux内核,并且不需要BIOS的参与。如果经过BIOS的话会消耗大量的时间。
kdump
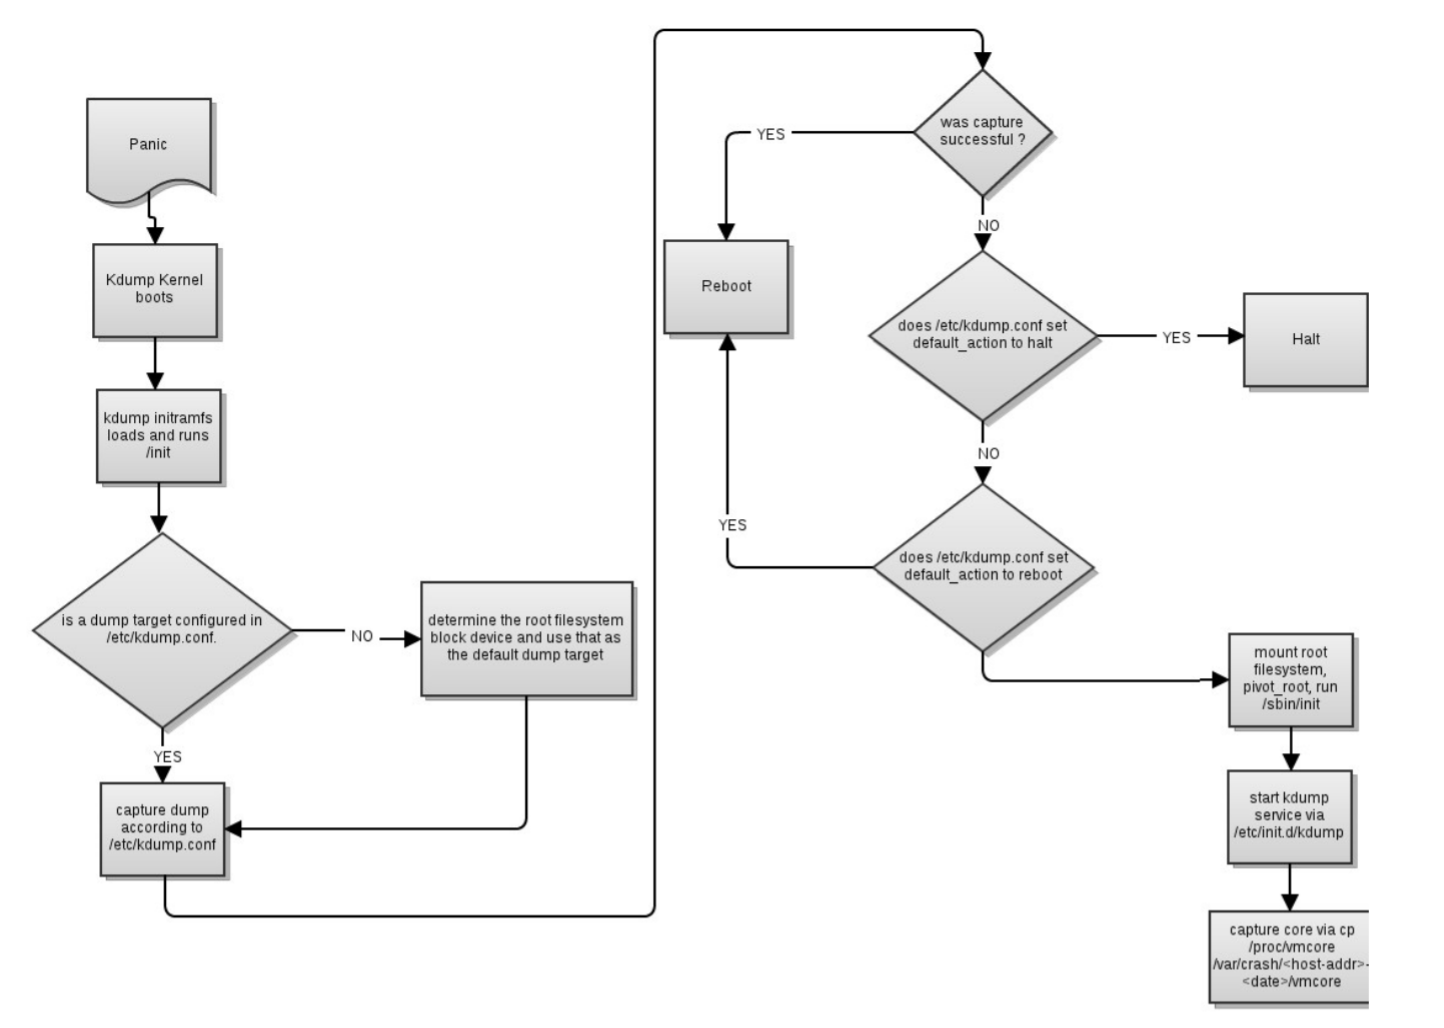
kdump 会收集Linux 在Crash 期间的数据。Kdump会运行在由 kexec组件启动的新内核上。第一个启动的内核会预留一部分内存给到第二内核。第二内核也叫 capture kernel。
[root@ip-172-16-1-245 ~]# cat /proc/iomem00000000-00000fff : Reserved00001000-0009fbff : System RAM0009fc00-0009ffff : Reserved000a0000-000bffff : PCI Bus 0000:00000c0000-000c8bff : Video ROM000f0000-000fffff : Reserved000f0000-000fffff : System ROM00100000-7d9e9fff : System RAM0ca00000-0d601620 : Kernel code0d601621-0e23563f : Kernel data0e862000-0f5fffff : Kernel bss73000000-7cffffff : Crash kernel7d9ea000-7fffffff : Reserved80000000-febfffff : PCI Bus 0000:00e0000000-e03fffff : Reservedfe400000-fe7fffff : 0000:00:03.0febf0000-febf3fff : 0000:00:04.0febf0000-febf3fff : nvmefebf4000-febf7fff : 0000:00:05.0febf4000-febf7fff : enafebf8000-febfbfff : 0000:00:1f.0febf8000-febfbfff : nvmefec00000-fec003ff : IOAPIC 0fed00000-fed003ff : HPET 0fed00000-fed003ff : PNP0103:00fee00000-fee00fff : Local APICfffc0000-ffffffff : Reserved
Kdump 安装与使用
用来收集Linux crash的信息。
https://access.redhat.com/sites/default/files/attachments/kdump20130402_1.pdf
https://access.redhat.com/articles/373633
安装
yum install kexec-tools
看你装没装
rpm -q kexec-tools
收集crash信息需要一定的保留内存,我们在启动内核的时候需要设置这个保留内存。
[root@ip-172-16-1-245 ~]# cat /proc/cmdline BOOT_IMAGE=(hd0,gpt2)/boot/vmlinuz-4.18.0-240.1.1.el8_3.x86_64 root=UUID=949779ce-46aa-434e-8eb0-852514a5d69e ro console=ttyS0,115200n8 console=tty0 net.ifnames=0 rd.blacklist=nouveau nvme_core.io_timeout=4294967295 crashkernel=auto
auto 是根据内存总量自动配置的。
配置文件:
/etc/kdump.conf
systemctlenablekdump.service
systemctlstartkdump.service
触发crash
echo 1 > /proc/sys/kernel/sysrq echo c > /proc/sysrq-trigger
分析 crash 的工具
yum install crash
debuginfo-install kernel crash /usr/lib/debug/lib/modules//vmlinux \ /var/crash/ /vmcore
打开以后可以用如下命令检查:
To display the kernel message buffer, type the log command at the interactive prompt.
To display the kernel stack trace, type thebtcommand at the interactive prompt. You can usebt
To display status of processes in the system, type thepsps
To display basic virtual memory information, type thevmcommand at the interactive prompt. You can usevm
To display information about open files, type the files command at the interactive prompt. You can usefiles
irq 命令用于显示内核内部管理的中断信息
kmem -s == /proc/slabinfo
kmem -i == free
sys 系统信息,以及触发crash原因
crash> sys
      KERNEL: /usr/lib/debug/lib/modules/4.18.0-240.1.1.el8_3.x86_64/vmlinux
    DUMPFILE: /var/crash/127.0.0.1-2021-08-11-09:22:18/vmcore  [PARTIAL DUMP]
        CPUS: 2
        DATE: Wed Aug 11 09:22:03 UTC 2021
      UPTIME: 02:20:04
LOAD AVERAGE: 0.00, 0.00, 0.02
       TASKS: 165
    NODENAME: ip-172-16-1-245.cn-north-1.compute.internal
     RELEASE: 4.18.0-240.1.1.el8_3.x86_64
     VERSION: #1 SMP Fri Oct 16 13:36:46 EDT 2020
     MACHINE: x86_64  (2499 Mhz)
      MEMORY: 2 GB
       PANIC: "sysrq: SysRq : Trigger a crash"
sig 显示进程的信号处理程序
timer 用于显示定时器队列中的项目
mod 模块信息,符号信息和调试信息
task 命令可以显示 task_struct 结构
https://access.redhat.com/documentation/en-us/red_hat_enterprise_linux/7/html/kernel_administration_guide/kernel_crash_dump_guide
https://ngelinux.com/what-is-proc-sysrq-trigger-in-linux-and-how-to-use-sysrq-kernel-feature/
EC2 触发不可屏蔽中断 (NMI)
配置内存与物理机Linux 类似
官方建议160M,在grub.conf 修改即可
修改/etc/sysctl.conf 添加如下一行:
kernel.unknown_nmi_panic=1
然后发送API请求
$ aws ec2 send-diagnostic-interrupt —region us-east-1 —instance-id
https://docs.aws.amazon.com/zh_cn/AWSEC2/latest/UserGuide/diagnostic-interrupt.html
CPU 软锁
占用一个CPU,别的进程不能用这个CPU。如果其他CPU进程也需要这个锁,也会被锁。
硬锁
中断都不响应了
进程D状态是睡眠锁, spinlock 是信号量锁
runq -g
net
dev
mem
kmem -i

若有收获,就点个赞吧
0 人点赞
