使用ggmaplot函数绘制火山图
加载所需R包
library(ggpubr)
基本用法:
Usage
ggmaplot(data, fdr = 0.05, fc = 1.5, genenames = NULL, detection_call = NULL, size = NULL,font.label = c(12, "plain", "black"), label.rectangle = FALSE, palette = c("#B31B21", "#1465AC", "darkgray"), top = 15, select.top.method = c("padj", "fc"), main = NULL, xlab = "Log2 mean expression",ylab = "Log2 fold change", ggtheme = theme_classic(), ...)
常用参数:
Arguments
data #差异基因分析结果 an object of class DESeqResults, get_diff, DE_Results, matrix or data frame containing the columns baseMean, log2FoldChange, and padj. Rows are genes.#baseMean: the mean expression of genes in the two groups.#log2FoldChange: the log2 fold changes of group 2 compared to group 1#padj: the adjusted p-value of the used statiscal test.fdr #设定fdr阈值 Accepted false discovery rate for considering genes as differentially expressed.fc #设定fc阈值 the fold change threshold. Only genes with a fold change >= fc and padj <= fdr are considered as significantly differentially expressed.genenames #基因名 a character vector of length nrow(data) specifying gene names corresponding to each row. Used for point labels.detection_call #选出特定表达模式的基因进行展示 a numeric vector with length = nrow(data), specifying if the genes is expressed (value = 1) or not (value = 0). For example detection_call = c(1, 1, 0, 1, 0, 1). Default is NULL. If detection_call column is available in data, it will be used.size #points size.font.label #a vector of length 3 indicating respectively the size (e.g.: 14), the style (e.g.: "plain", "bold", "italic", "bold.italic") and the color (e.g.: "red") of point labels. For example font.label = c(14, "bold", "red").label.rectangle #logical value. If TRUE, add rectangle underneath the text, making it easier to read.palette #the color palette to be used for coloring or filling by groups. Allowed values include "grey" for grey color palettes; brewer palettes e.g. "RdBu", "Blues", ...; or custom color palette e.g. c("blue", "red"); and scientific journal palettes from ggsci R package, e.g.: "npg", "aaas", "lancet", "jco", "ucscgb", "uchicago", "simpsons" and "rickandmorty".top #选定top基因进行展示 the number of top genes to be shown on the plot. Use top = 0 to hide to gene labels.select.top.method #methods to be used for selecting top genes. Allowed values include "padj" and "fc" for selecting by adjusted p values or fold changes, respectively.main #plot main title.xlab #character vector specifying x axis labels. Use xlab = FALSE to hide xlab.ylab #character vector specifying y axis labels. Use ylab = FALSE to hide ylab.ggtheme #function, ggplot2 theme name. Default value is theme_pubr(). Allowed values include ggplot2 official themes: theme_gray(), theme_bw(), theme_minimal(), theme_classic(), theme_void()... #other arguments to be passed to ggpar.
使用示例
# 加载数据集data(diff_express)head(diff_express)
## name baseMean log2FoldChange padj detection_call## ENSG00000000003 TSPAN6 0.1184475 0.0000000 NA 0## ENSG00000000419 DPM1 1654.4618144 0.6789538 5.280802e-02 1## ENSG00000000457 SCYL3 681.0463277 1.5263838 3.915112e-07 1## ENSG00000000460 C1orf112 389.7226640 3.8933573 1.180333e-14 1## ENSG00000000938 FGR 364.7810090 -2.3554014 1.559228e-04 1## ENSG00000000971 CFH 1.1346239 1.2932740 4.491812e-01 0
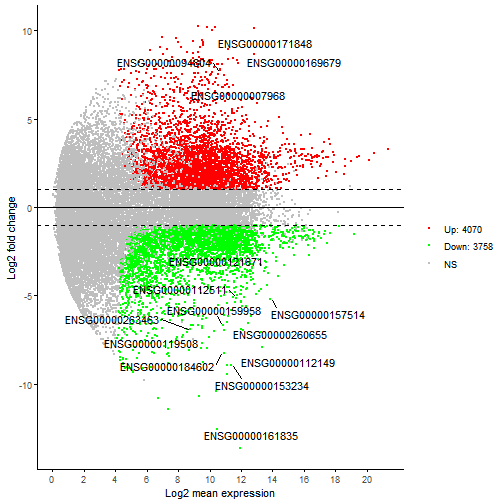
p1 <- ggmaplot(diff_express, fdr = 0.05, fc = 2, size = 0.4,palette = c("red", "green", "gray"))p1
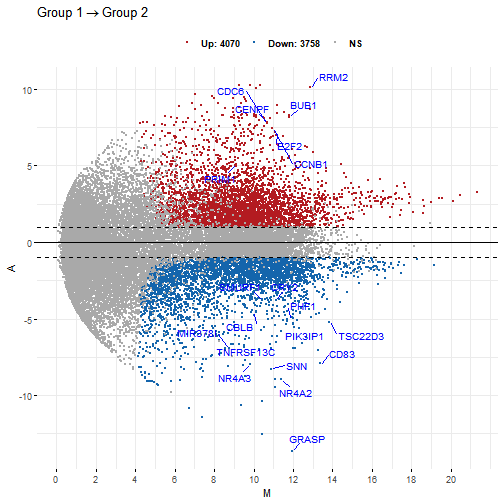
p2 <- ggmaplot(diff_express, main = expression("Group 1" %->% "Group 2"),fdr = 0.05, fc = 2, size = 0.4,palette = c("#B31B21", "#1465AC", "darkgray"),genenames = as.vector(diff_express$name),xlab = "M", ylab = "A",legend = "top", top = 20,font.label = c(11, "blue", "red"),font.legend = "bold", font.main = "bold",ggtheme = ggplot2::theme_minimal())p2
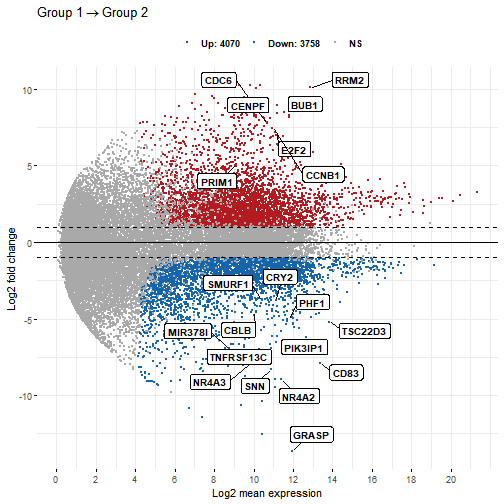
# Add rectangle around labelsp3 <- ggmaplot(diff_express, main = expression("Group 1" %->% "Group 2"),fdr = 0.05, fc = 2, size = 0.4,palette = c("#B31B21", "#1465AC", "darkgray"),genenames = as.vector(diff_express$name),legend = "top", top = 20, font.label = c("bold", 11),label.rectangle = TRUE, font.legend = "bold",select.top.method = "padj", font.main = "bold",ggtheme = ggplot2::theme_minimal())p3
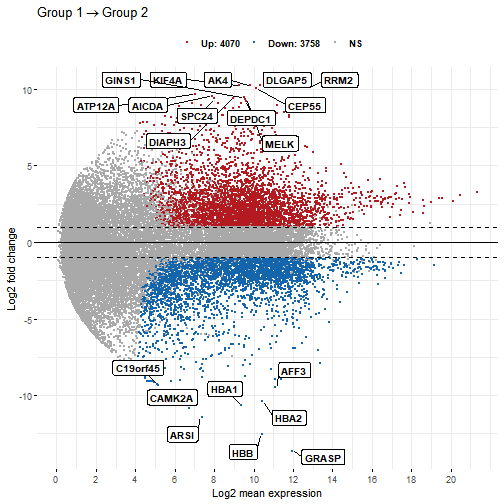
p4 <- ggmaplot(diff_express, main = expression("Group 1" %->% "Group 2"),fdr = 0.05, fc = 2, size = 0.5,palette = c("#B31B21", "#1465AC", "darkgray"),genenames = as.vector(diff_express$name),legend = "top", top = 20, font.label = c("bold", 11),label.rectangle = TRUE, font.legend = "bold",select.top.method = "fc", font.main = "bold",ggtheme = ggplot2::theme_minimal())p4
sessionInfo()
## R version 4.0.2 (2020-06-22)## Platform: x86_64-w64-mingw32/x64 (64-bit)## Running under: Windows 10 x64 (build 17763)#### Matrix products: default#### locale:## [1] LC_COLLATE=Chinese (Simplified)_China.936 LC_CTYPE=Chinese (Simplified)_China.936## [3] LC_MONETARY=Chinese (Simplified)_China.936 LC_NUMERIC=C## [5] LC_TIME=Chinese (Simplified)_China.936## system code page: 65001#### attached base packages:## [1] stats graphics grDevices utils datasets methods base#### other attached packages:## [1] ggpubr_0.4.0 nycflights13_1.0.1 forcats_0.5.0 stringr_1.4.0## [5] dplyr_1.0.2 purrr_0.3.4 readr_1.3.1 tidyr_1.1.2## [9] tibble_3.0.3 ggplot2_3.3.2 tidyverse_1.3.0#### loaded via a namespace (and not attached):## [1] ggrepel_0.8.2 Rcpp_1.0.5 lubridate_1.7.9 assertthat_0.2.1 digest_0.6.25## [6] utf8_1.1.4 R6_2.4.1 cellranger_1.1.0 backports_1.1.9 reprex_0.3.0## [11] evaluate_0.14 httr_1.4.2 highr_0.8 pillar_1.4.6 rlang_0.4.7## [16] curl_4.3 readxl_1.3.1 rstudioapi_0.11 data.table_1.13.0 car_3.0-9## [21] blob_1.2.1 labeling_0.3 foreign_0.8-80 munsell_0.5.0 broom_0.7.0## [26] compiler_4.0.2 modelr_0.1.8 xfun_0.17 pkgconfig_2.0.3 tidyselect_1.1.0## [31] rio_0.5.16 fansi_0.4.1 crayon_1.3.4 dbplyr_1.4.4 withr_2.2.0## [36] grid_4.0.2 jsonlite_1.7.1 gtable_0.3.0 lifecycle_0.2.0 DBI_1.1.0## [41] magrittr_1.5 scales_1.1.1 zip_2.1.1 cli_2.0.2 stringi_1.5.3## [46] carData_3.0-4 farver_2.0.3 ggsignif_0.6.0 fs_1.5.0 xml2_1.3.2## [51] ellipsis_0.3.1 generics_0.0.2 vctrs_0.3.4 openxlsx_4.1.5 ggsci_2.9## [56] tools_4.0.2 glue_1.4.2 hms_0.5.3 abind_1.4-5 colorspace_1.4-1## [61] rstatix_0.6.0 rvest_0.3.6 knitr_1.29 haven_2.3.1

若有收获,就点个赞吧
0 人点赞
