pheatmap包
简介
官方介绍:
A function to draw clustered heatmaps where one has better control over some graphical parameters such as cell size, etc
实际上,pheatmap是 Pretty Heatmaps 的缩写,是我认为目前最好用的绘制聚类热图的R包(尽管有很多其他的函数。。。)
使用方法
pheatmap(mat, color = colorRampPalette(rev(brewer.pal(n = 7, name ="RdYlBu")))(100), kmeans_k = NA, breaks = NA, border_color = "grey60",cellwidth = NA, cellheight = NA, scale = "none", cluster_rows = TRUE,cluster_cols = TRUE, clustering_distance_rows = "euclidean",clustering_distance_cols = "euclidean", clustering_method = "complete",clustering_callback = identity2, cutree_rows = NA, cutree_cols = NA,treeheight_row = ifelse((class(cluster_rows) == "hclust") || cluster_rows,50, 0), treeheight_col = ifelse((class(cluster_cols) == "hclust") ||cluster_cols, 50, 0), legend = TRUE, legend_breaks = NA,legend_labels = NA, annotation_row = NA, annotation_col = NA,annotation = NA, annotation_colors = NA, annotation_legend = TRUE,annotation_names_row = TRUE, annotation_names_col = TRUE,drop_levels = TRUE, show_rownames = T, show_colnames = T, main = NA,fontsize = 10, fontsize_row = fontsize, fontsize_col = fontsize,angle_col = c("270", "0", "45", "90", "315"), display_numbers = F,number_format = "%.2f", number_color = "grey30", fontsize_number = 0.8* fontsize, gaps_row = NULL, gaps_col = NULL, labels_row = NULL,labels_col = NULL, filename = NA, width = NA, height = NA,silent = FALSE, na_col = "#DDDDDD", ...)
常用参数介绍
图形参数设置
main: 图的标题
color: 表示颜色,赋值渐变颜色调色板colorRampPalette属性,选择“绿,黑,红”渐变,分为100个等级,,例:color = colorRampPalette(c(“navy”, “white”, “firebrick3”))(100)
sclae: 表示值均一化的方向,或者按照行或列,或者没有,值可以是”row”, “column” 或者”none”
margins: 表示页边空白的大小
fontsize: 表示图中的字体大小
fontsize_row: 行名的字体大小
fontsize_col: 列名的字体大小
breaks: 一个数字序列向量,涵盖数据中值的范围,用来定义图例中color_bar的范围
angle_col: 列标签旋转的角度 (0, 45, 90, 270 and 315)
labels_row: 向量,用来替代原来的行名
labels_col: 向量,用来替代原来的列名
聚类参数设置
kmeans_k: 对行进行kmean聚类的个数,如果不设置,则不对行进行聚类
cluster_cols: 表示进行列的聚类,值可以是FALSE或TRUE
cluster_rows: 是否进行行的聚类,值可以是FALSE或TRUE
treeheight_row: 设置row方向的聚类树高
treeheight_col: 设置col方向的聚类树高
clustering_distance_rows: 表示行距离度量的方法
clustering_distance_cols: 表示列距离度量的方法
clustering_method: 表示聚类方法,值可以是hclust的任何一种,如”ward.D”,“single”, “complete”, “average”, “mcquitty”, “median”, “centroid”, “ward.D2”
cutree_rows: 一致性聚类中行聚类的数量,如果没有进行聚类就忽略
cutree_cols: 一致性聚类中列聚类的数量,如果没有进行聚类就忽略
图例参数设置
legend: TRUE或者FALSE,表示是否显示图例
legend_breaks: 设置图例的断点,格式:vector
legend_labels: legend_breaks对应的标签,例:legend_breaks = -1:4, legend_labels = c(“0”,“1e-4”, “1e-3”, “1e-2”, “1e-1”, “1”)
单元格参数设置
border_color: 单元格边框的颜色,如果不需要则设为NA
cellwidth: 单元格的宽度,默认NA,为适应画布大小
cellheight: 单元格的高度,默认NA,为适应画布大小
na_col: 指定矩阵中NA值的单元格的颜色
单元格内字的设置
display_numbers: 单元格中是否标注数值,如果是matrix,则用matrix中的值代替原始值
number_color: 字的颜色
number_format: 单元格中标注数值的格式
fontsize_number: 单元格中显示的数字的字体大小
热图分割参数设置
cutree_rows: 基于层次聚类(使用cutree)划分行的簇数(如果未聚集行,则忽略参数)
cutree_cols: 基于层次聚类(使用cutree)划分列的簇数
gaps_row: 向量,指出在未进行行聚类时,在哪里对热图进行分割
gaps_col: 向量,指出在未进行列聚类时,在哪里对热图进行分割
行列注释参数设置
annotation_row: 行的分组信息,需要使用相应的行名称来匹配数据和注释中的行,注意之后颜色设置会考虑离散值还是连续值,格式要求为数据框
annotation_col: 同上,列的分组信息
annotation_colors: 用于手动指定annotation_row和annotation_col track颜色的列表。
annotation_names_row: boolean值,显示是否应绘制行注释track的名称。
anotation_names_col: 同上,显示是否应绘制列注释track的名称。
输出图形设置
filename: 要保存图的名字
width: 输出图片的宽度(单位英寸)
height: 输出图片的高度(单位英寸)
silent: 不绘制图形,只输出gtable对象
实例介绍
# Create test matrix> test = matrix(rnorm(200), 20, 10)> test[1:10, seq(1, 10, 2)] = test[1:10, seq(1, 10, 2)] + 3> test[11:20, seq(2, 10, 2)] = test[11:20, seq(2, 10, 2)] + 2> test[15:20, seq(2, 10, 2)] = test[15:20, seq(2, 10, 2)] + 4> colnames(test) = paste("Test", 1:10, sep = "")> rownames(test) = paste("Gene", 1:20, sep = "")
> library(pheatmap)> pheatmap(test)
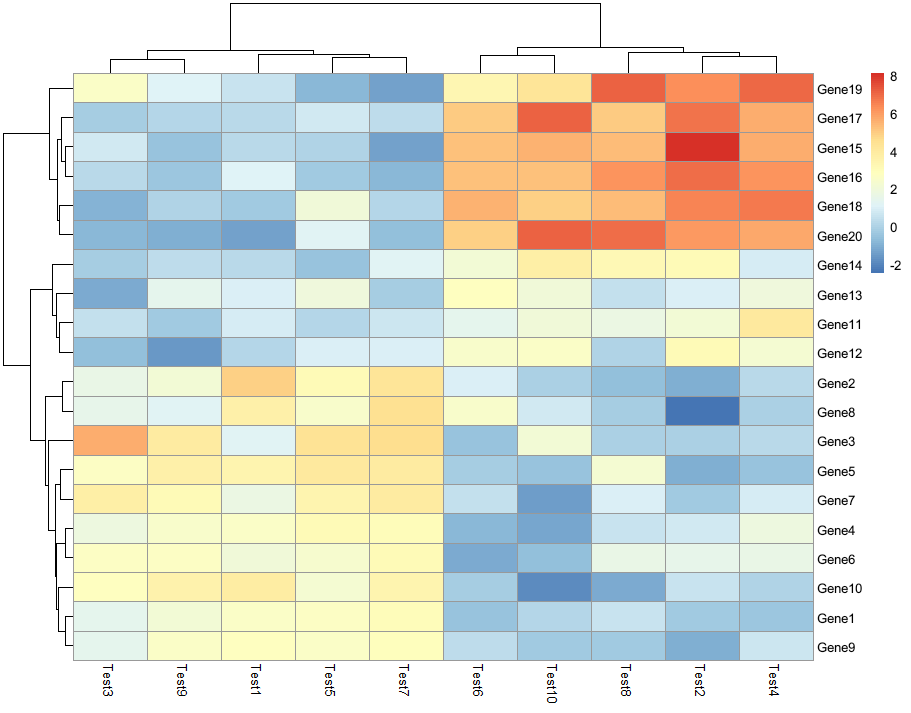
默认参数是对行列均进行聚类(可设置cluster_row = F, cluster_col = F不进行聚类;如果聚类了,还可以通过设置treeheight_row=0, treeheight_col=0不显示聚类树),矩阵没有进行标准化(标准化参数为scale),热图的每个小块之间以灰色隔开(参数border_color),legend显示在右上方;热图的颜色可利用参数color调整
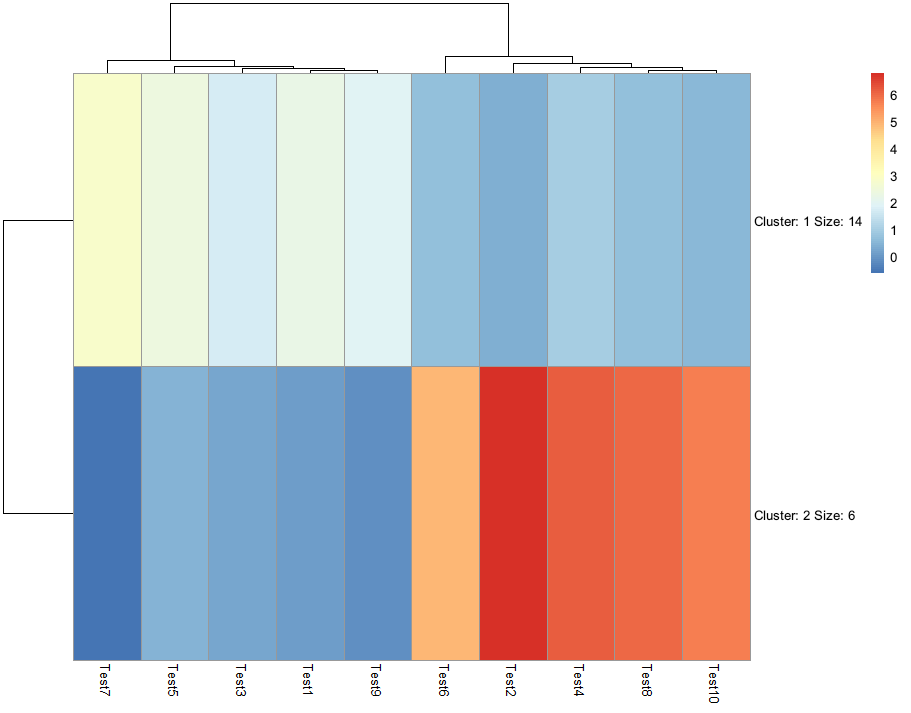
> pheatmap(test,kmeans_k = 2) # 对行进行kmeans聚类
> pheatmap(test, display_numbers = TRUE)> pheatmap(test, display_numbers = TRUE, number_format = "\%.1e")> pheatmap(test, display_numbers = matrix(ifelse(test > 5, "*", ""), nrow(test))) # 可以设置显示的内容

display_numbers将数值显示在热图的格子中,可通过number_format设置数值的格式,较常用的有”%.2f”(保留小数点后两位),”%.1e”(科学计数法显示,保留小数点后一位),number_color设置显示内容的颜色,fontsize_number设置字体的大小。
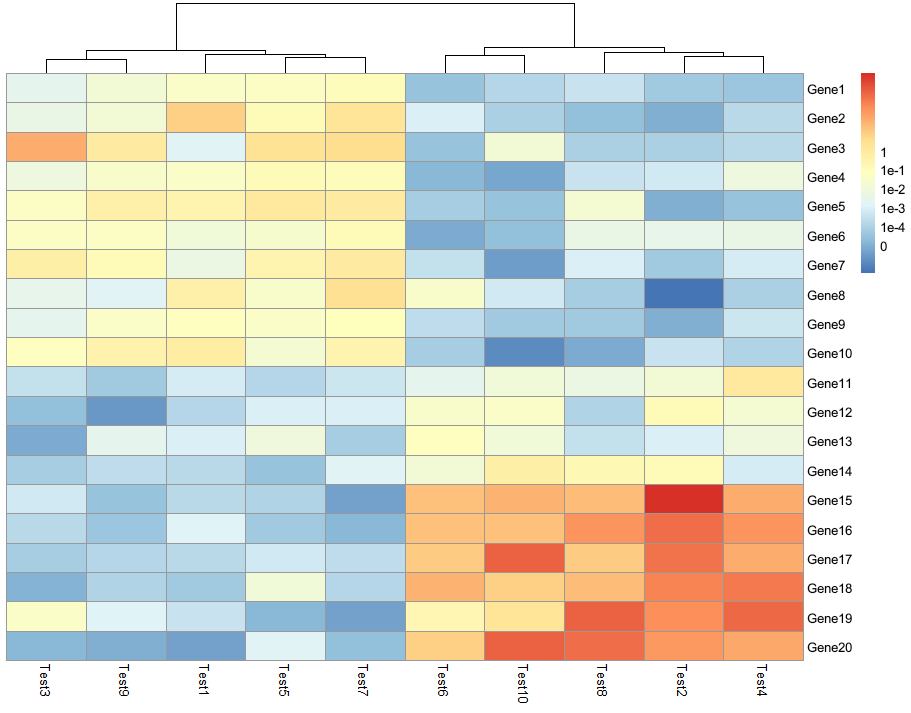
> pheatmap(test, cluster_row = FALSE, legend_breaks = -1:4, legend_labels = c("0", "1e-4", "1e-3", "1e-2", "1e-1", "1")) # 自己设置图例
> pheatmap(test, cellwidth = 15, cellheight = 12, fontsize = 8, main = "Example heatmap", filename = "test.pdf")
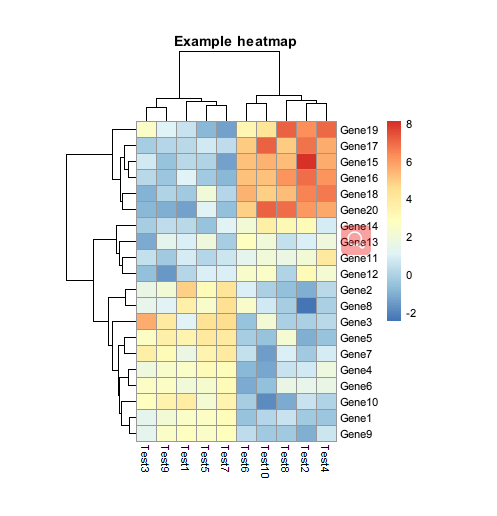
main可设置热图的标题,fontsize设置字体大小,filename可直接将热图存出,支持格式png, pdf, tiff, bmp, jpeg,并且可以通过width, height设置图片的大小
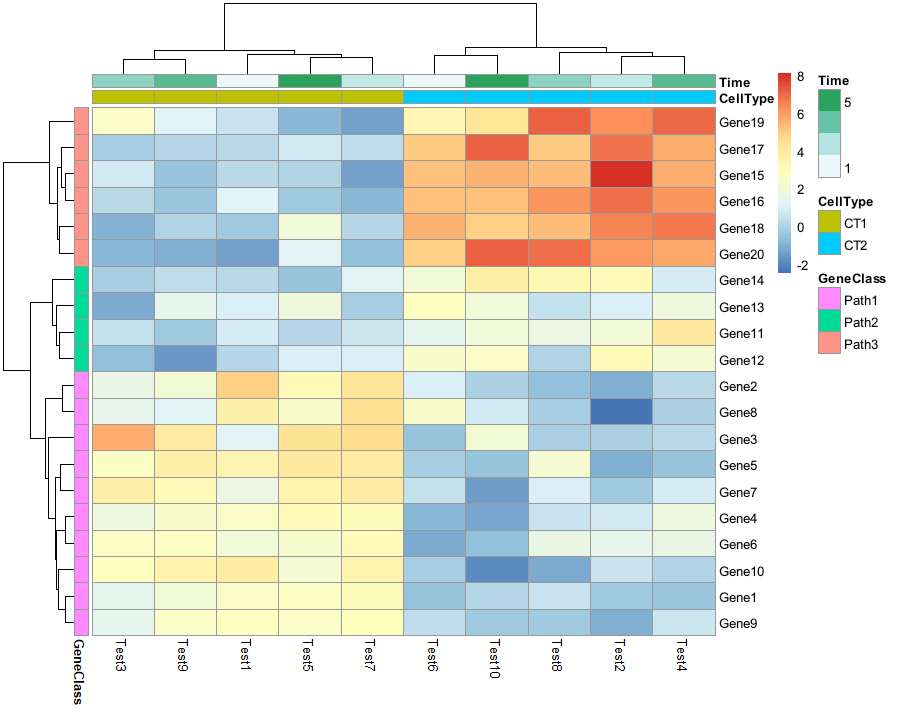
对行、列添加注释分组信息
> annotation_col = data.frame(CellType = factor(rep(c("CT1", "CT2"), 5)), Time = 1:5)> rownames(annotation_col) = paste("Test", 1:10, sep = "")> annotation_row = data.frame(GeneClass = factor(rep(c("Path1", "Path2", "Path3"), c(10, 4, 6))))> rownames(annotation_row) = paste("Gene", 1:20, sep = "")> pheatmap(test, annotation_col = annotation_col, annotation_row = annotation_row)
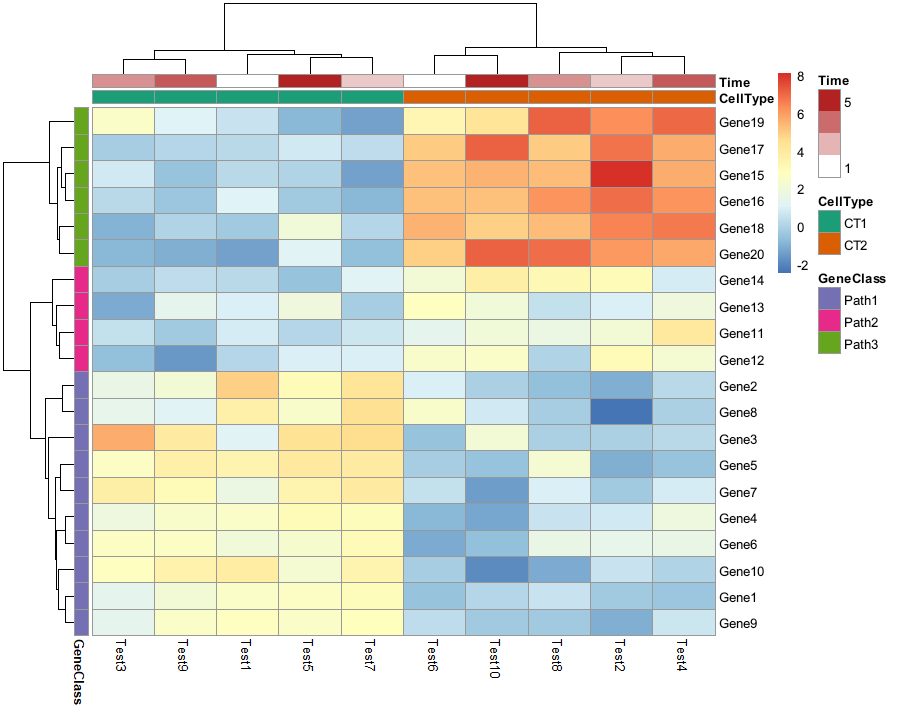
同样可以自己设置各个分组注释信息的颜色
> ann_colors = list(Time = c("white", "firebrick"),CellType = c(CT1 = "#1B9E77", CT2 = "#D95F02"),GeneClass = c(Path1 = "#7570B3", Path2 = "#E7298A", Path3 = "#66A61E")) # 如果是连续型变量会形成渐变色,如:Time> pheatmap(test, annotation_col = annotation_col, annotation_row = annotation_row, annotation_colors = ann_colors)
对于聚类图,可以使用cutree_rows, cutree_cols设置热图分割
> pheatmap(test,cutree_rows=3,cutree_cols=2)

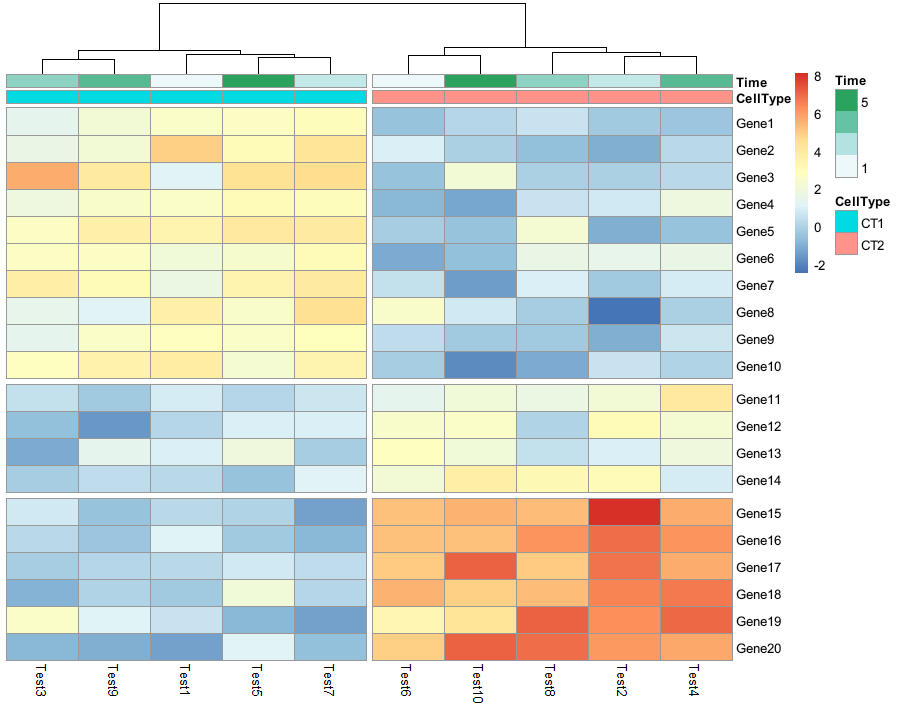
对于未进行聚类的图,可以使用gaps_row, gaps_col自己设定要分隔开的位置
> pheatmap(test, annotation_col = annotation_col, cluster_rows = FALSE, gaps_row = c(10, 14), cutree_col = 2)
pheatmap()函数返回结果
返回一个pheatmap对象,但是该对象中包含以下内容:
tree_row : 行聚类得到的hclust对象
tree_row : 列聚类得到的hclust对象
kmeans : kmeans聚类的k值
gtable : 热图的gtable对象,可以用来与其他ggplot2对象进行组合绘图

若有收获,就点个赞吧
0 人点赞
