部署结构
方案一:
开发环境,由于我们应用和机器都部署在一台EC2实例上。
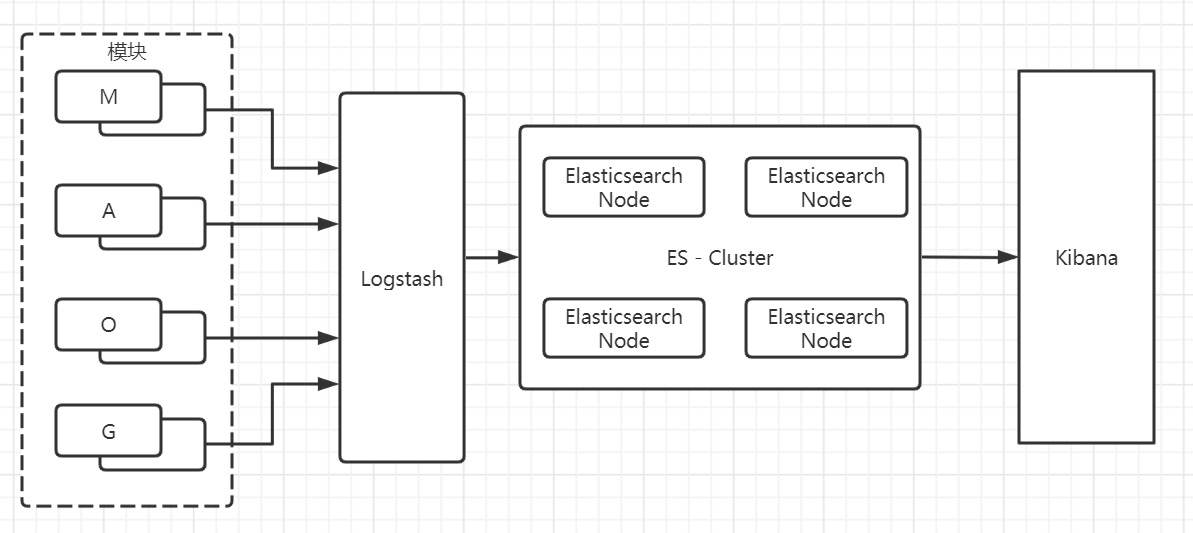
日志平台的架构: Logstash —- > Elasticsearch —- > Kibana
logstash 安装 版本:6.2.3
yum install -y unzipcd /opt/elkwget https://artifacts.elastic.co/downloads/logstash/logstash-6.2.3.zipunzip logstash-6.2.3.ziptouch /opt/elk/logstash-6.2.3/test.confecho "input {" >> /opt/elk/logstash-6.2.3/test.confecho " file {" >> /opt/elk/logstash-6.2.3/test.confecho " path => \"/usr/local/app/dev_module/nohup.out\"" >> /opt/elk/logstash-6.2.3/test.confecho " start_position => beginning" >> /opt/elk/logstash-6.2.3/test.confecho " }" >> /opt/elk/logstash-6.2.3/test.confecho "}" >> /opt/elk/logstash-6.2.3/test.confecho "filter {" >> /opt/elk/logstash-6.2.3/test.confecho "}" >> /opt/elk/logstash-6.2.3/test.confecho "output {" >> /opt/elk/logstash-6.2.3/test.confecho " elasticsearch {" >> /opt/elk/logstash-6.2.3/test.confecho " hosts => \"xxx.xxx.xxx.xxx:9200\"" >> /opt/elk/logstash-6.2.3/test.confecho " }" >> /opt/elk/logstash-6.2.3/test.confecho "}" >> /opt/elk/logstash-6.2.3/test.conf# 启动nohup /opt/elk/logstash-6.2.3/bin/logstash -f /opt/elk/logstash-6.2.3/test.conf --path.data=/opt/elk/logstash-6.2.3/logs > nohup.out 2>&1 &
ElasticSearch 安装 版本:6.4.3
# 修改环境配置sed -i 's/vm.max_map_count=.*/vm.max_map_count=6553600/g' /etc/sysctl.conf/sbin/sysctl -p# 添加elsearch用户groupadd elsearchuseradd elsearch -g elsearch -p elasticsearch# 安装cd /optmkdir elkcd elkwget https://artifacts.elastic.co/downloads/elasticsearch/elasticsearch-6.4.3.tar.gztar -zxvf elasticsearch-6.4.3.tar.gzchown -R elsearch:elsearch elasticsearch-6.4.3cd elasticsearch-6.4.3echo "network.host: 0.0.0.0" >> config/elasticsearch.ymlecho "http.port: 9200" >> config/elasticsearch.ymlecho "http.cors.enabled: true" >> config/elasticsearch.ymlecho "http.cors.allow-origin: \"*\"" >> config/elasticsearch.ymlsu elsearchcd /opt/elk/elasticsearch-6.4.3/nohup /opt/elk/elasticsearch-6.4.3/bin/elasticsearch > nohup.out 2>&1 &tail -200f nohup.out
Kibana 安装 版本:6.4.3
cd /opt/elkwget https://artifacts.elastic.co/downloads/kibana/kibana-6.4.3-linux-x86_64.tar.gztar -zxvf kibana-6.4.3-linux-x86_64.tar.gzcd kibana-6.4.3-linux-x86_64echo "server.port: 5601" >> config/kibana.ymlecho "server.host: \"0.0.0.0\"" >> config/kibana.ymlecho "elasticsearch.url: \"http://localhost:9200\"" >> config/kibana.ymlecho "kibana.index: \".kibana\"" >> config/kibana.ymlnohup /opt/elk/kibana-6.4.3-linux-x86_64/bin/kibana > nohup.out 2>&1 &tail -200f nohup.outhttp://xxx.xxx.xxx.xxx:5601/app/kibana
logstash收集、解析和转换日志
ElasticSearch 对日志建立索引
kibana 针对索引日志数据进行图形化展示,搜索。
架构缺点: logtash作用于日志收集过重,和应用服务器部署一台,过于占用资源。
方案二
日志平台的架构:Filebeat —- > Logstash —- > Elasticsearch —- > Kibana
Filebeat是日志收集的agent应用,采集日志通过异步的方式发送给Logstash,而且filebeat占用系统资源消耗少。验证启动两个软件,filebeat大概占用20M内存,logtash大概在600M+。
Filebeat 安装 版本:7.8.0
cd /opt/elkwget https://artifacts.elastic.co/downloads/beats/filebeat/filebeat-7.8.0-linux-x86_64.tar.gztar -zxvf filebeat-7.8.0-linux-x86_64.tar.gzcd filebeat-7.8.0-linux-x86_64mv filebeat.yml filebeat.yml.baktouch filebeat.ymlecho "filebeat.inputs:" >> filebeat.ymlecho "- type: log" >> filebeat.ymlecho " enabled: true" >> filebeat.ymlecho " paths:" >> filebeat.ymlecho " - /usr/local/app/dev-module/nohup.out" >> filebeat.ymlecho " fields:" >> filebeat.ymlecho " module: acct" >> filebeat.ymlecho " fields_under_root: true" >> filebeat.ymlecho "" >> filebeat.ymlecho "output.logstash:" >> filebeat.ymlecho " hosts: ["xxx.xxx.xxx.xxx:5044"]" >> filebeat.ymlecho "" >> filebeat.ymlecho "filebeat.config.modules:" >> filebeat.ymlecho " path: ${path.config}/modules.d/*.yml" >> filebeat.ymlecho " reload.enabled: true" >> filebeat.yml/opt/elk/filebeat-7.8.0-linux-x86_64nohup ./filebeat -e -c filebeat.yml > nohup.out 2>&1 &tail -200f nohup.out
Logstash 安装 版本:7.8.0
cd /opt/elkwget https://artifacts.elastic.co/downloads/logstash/logstash-7.8.0.tar.gztar -zxvf logstash-7.8.0.tar.gztouch /opt/elk/logstash-7.8.0/test.conf# 接收Filebeat的日志输入input {beats {port => 5044ssl => false}}filter {grok {#match => { "message" => "(\s*%{TIMESTAMP_ISO8601:timestamp}\s*\[.*\]\s*\[.*\]\s*%{LOGLEVEL:loglevel}\s*---\s*%{GREEDYDATA:content}\s)" }match => { "message" => "(\s*%{TIMESTAMP_ISO8601:timestamp}\s*\[%{GREEDYDATA:traceId},%{GREEDYDATA:spanId}\]\s*\[.*\]\s*%{LOGLEVEL:loglevel}\s*---\s*%{GREEDYDATA:content}\s)" }}ruby {code => "event.set('collection_time', event.get('@timestamp'))"}date {match => ["timestamp", "yyyy-MM-dd HH:mm:ss.SSS"]timezone => "Asia/Shanghai"target => "@timestamp"}mutate {remove_field => [ "host","timestamp" ]}}output {elasticsearch {hosts => "xxxxx:9200"index => "Index-%{[module]}-%{+YYYY.MM.dd}" #索引名称,按年月日切分}}cd /opt/elk/logstash-7.8.0nohup /opt/elk/logstash-7.8.0/bin/logstash -f /opt/elk/logstash-7.8.0/test.conf --path.data=/opt/elk/logstash-7.8.0/logs > nohup.out 2>&1 &tail -200f nohup.out
ElasticSearch 安装 版本:7.8.0
# 修改环境配置sed -i 's/vm.max_map_count=.*/vm.max_map_count=6553600/g' /etc/sysctl.conf/sbin/sysctl -p# 添加elsearch用户groupadd elsearchuseradd elsearch -g elsearch -p elasticsearch# 安装cd /optmkdir elkcd elkwget https://artifacts.elastic.co/downloads/elasticsearch/elasticsearch-7.8.0-linux-x86_64.tar.gztar -zxvf elasticsearch-7.8.0-linux-x86_64.tar.gzchown -R elsearch:elsearch elasticsearch-7.8.0cd elasticsearch-7.8.0echo "network.host: 0.0.0.0" >> config/elasticsearch.ymlecho "http.port: 9200" >> config/elasticsearch.ymlecho "http.cors.enabled: true" >> config/elasticsearch.ymlecho "http.cors.allow-origin: \"*\"" >> config/elasticsearch.ymlecho "bootstrap.memory_lock: false" >> config/elasticsearch.ymlecho "bootstrap.system_call_filter: false" >> config/elasticsearch.ymlecho "node.name: node-1" >> config/elasticsearch.ymlecho "cluster.initial_master_nodes: [\"node-1\"]" >> config/elasticsearch.ymlsu elsearchcd /opt/elk/elasticsearch-7.8.0/nohup /opt/elk/elasticsearch-7.8.0/bin/elasticsearch > nohup.out 2>&1 &tail -200f nohup.out
Kibana 安装 版本:7.8.0
cd /opt/elkwget https://artifacts.elastic.co/downloads/kibana/kibana-7.8.0-linux-x86_64.tar.gztar -zxvf kibana-7.8.0-linux-x86_64.tar.gzcd kibana-7.8.0-linux-x86_64echo "server.port: 5601" >> config/kibana.ymlecho "server.host: \"0.0.0.0\"" >> config/kibana.ymlecho "elasticsearch.hosts: [\"http://localhost:9200/\"]" >> config/kibana.ymlecho "kibana.index: \".kibana\"" >> config/kibana.ymlcd /opt/elk/kibana-7.8.0-linux-x86_64nohup /opt/elk/kibana-7.8.0-linux-x86_64/bin/kibana --allow-root > nohup.out 2>&1 &tail -200f nohup.outhttp://xxx.xxx.xxx.xxx:5601/app/kibana
扩展:
# 日志格式${CONSOLE_LOG_PATTERN:-%clr(%d{yyyy-MM-dd HH:mm:ss.SSS}){faint} %clr([%X{X-B3-TraceId:-},%X{X-B3-SpanId:-}] [%thread]){cyan} %clr(%-5level) %clr(---){faint} %clr(%m){faint} %clr([%logger{50}:%line]){cyan} %n${LOG_EXCEPTION_CONVERSION_WORD:-%wEx}}

若有收获,就点个赞吧
0 人点赞
