https://time.geekbang.org/column/intro/140 http://www.brendangregg.com/ https://github.com/iovisor/bcc http 压测工具: https://github.com/wg/wrk 火焰图: http://www.brendangregg.com/flamegraphs.html
实战
CPU 使用率高->函数
# -g开启调用关系分析,-p指定php-fpm的进程号21515$ perf top -g -p 21515
找出高CPU应用
# 记录性能事件,等待大约15秒后按 Ctrl+C 退出$ perf record -g# 查看报告$ perf report
进程树
# -a 表示输出命令行选项# p表PID# s表示指定进程的父进程$ pstree -aps 3084systemd,1└─dockerd,15006 -H fd://└─docker-containe,15024 --config /var/run/docker/containerd/containerd.toml└─docker-containe,3991 -namespace moby -workdir...└─app,4009└─(app,3084)
OOM
# 重新执行 memleak工具检查内存泄漏情况$ /usr/share/bcc/tools/memleak -a -p $(pidof app)Attaching to pid 18808, Ctrl+C to quit.[10:23:18] Top 10 stacks with outstanding allocations:[10:23:23] Top 10 stacks with outstanding allocations:
swap
# 命令可以直接将进程按照swap使用量排序显示smem --sort swap
狂打日志的内鬼
# -d 查看 i/o 使用情况pidstat -d 1# 观察系统调用情况strace -p 12280 2>&1 | grep write # 如果 write 日志过多$ strace -p 18940strace: Process 18940 attached...mmap(NULL, 314576896, PROT_READ|PROT_WRITE, MAP_PRIVATE|MAP_ANONYMOUS, -1, 0) = 0x7f0f7aee9000mmap(NULL, 314576896, PROT_READ|PROT_WRITE, MAP_PRIVATE|MAP_ANONYMOUS, -1, 0) = 0x7f0f682e8000write(3, "2018-12-05 15:23:01,709 - __main"..., 314572844) = 314572844munmap(0x7f0f682e8000, 314576896) = 0write(3, "\n", 1) = 1munmap(0x7f0f7aee9000, 314576896) = 0close(3) = 0stat("/tmp/logtest.txt.1", {st_mode=S_IFREG|0644, st_size=943718535, ...}) = 0
IOwait 高
查看 socket 信息
# head -n 3 表示只显示前面3行# -l 表示只显示监听套接字# -n 表示显示数字地址和端口(而不是名字)# -p 表示显示进程信息$ netstat -nlp | head -n 3Active Internet connections (only servers)Proto Recv-Q Send-Q Local Address Foreign Address State PID/Program nametcp 0 0 127.0.0.53:53 0.0.0.0:* LISTEN 840/systemd-resolve# -l 表示只显示监听套接字# -t 表示只显示 TCP 套接字# -n 表示显示数字地址和端口(而不是名字)# -p 表示显示进程信息$ ss -ltnp | head -n 3State Recv-Q Send-Q Local Address:Port Peer Address:PortLISTEN 0 128 127.0.0.53%lo:53 0.0.0.0:* users:(("systemd-resolve",pid=840,fd=13))LISTEN 0 128 0.0.0.0:22 0.0.0.0:* users:(("sshd",pid=1459,fd=3))
DNS 不稳定
ping -c3 114.114.114.114
网络流量分析: tcpdump + Wireshark
网络延迟增大
# 80端口正常$ curl http://192.168.0.30:80# 测试80端口延迟$ hping3 -c 3 -S -p 80 192.168.0.30# 测试80端口性能$ wrk --latency -c 100 -t 2 --timeout 2 http://192.168.0.30/
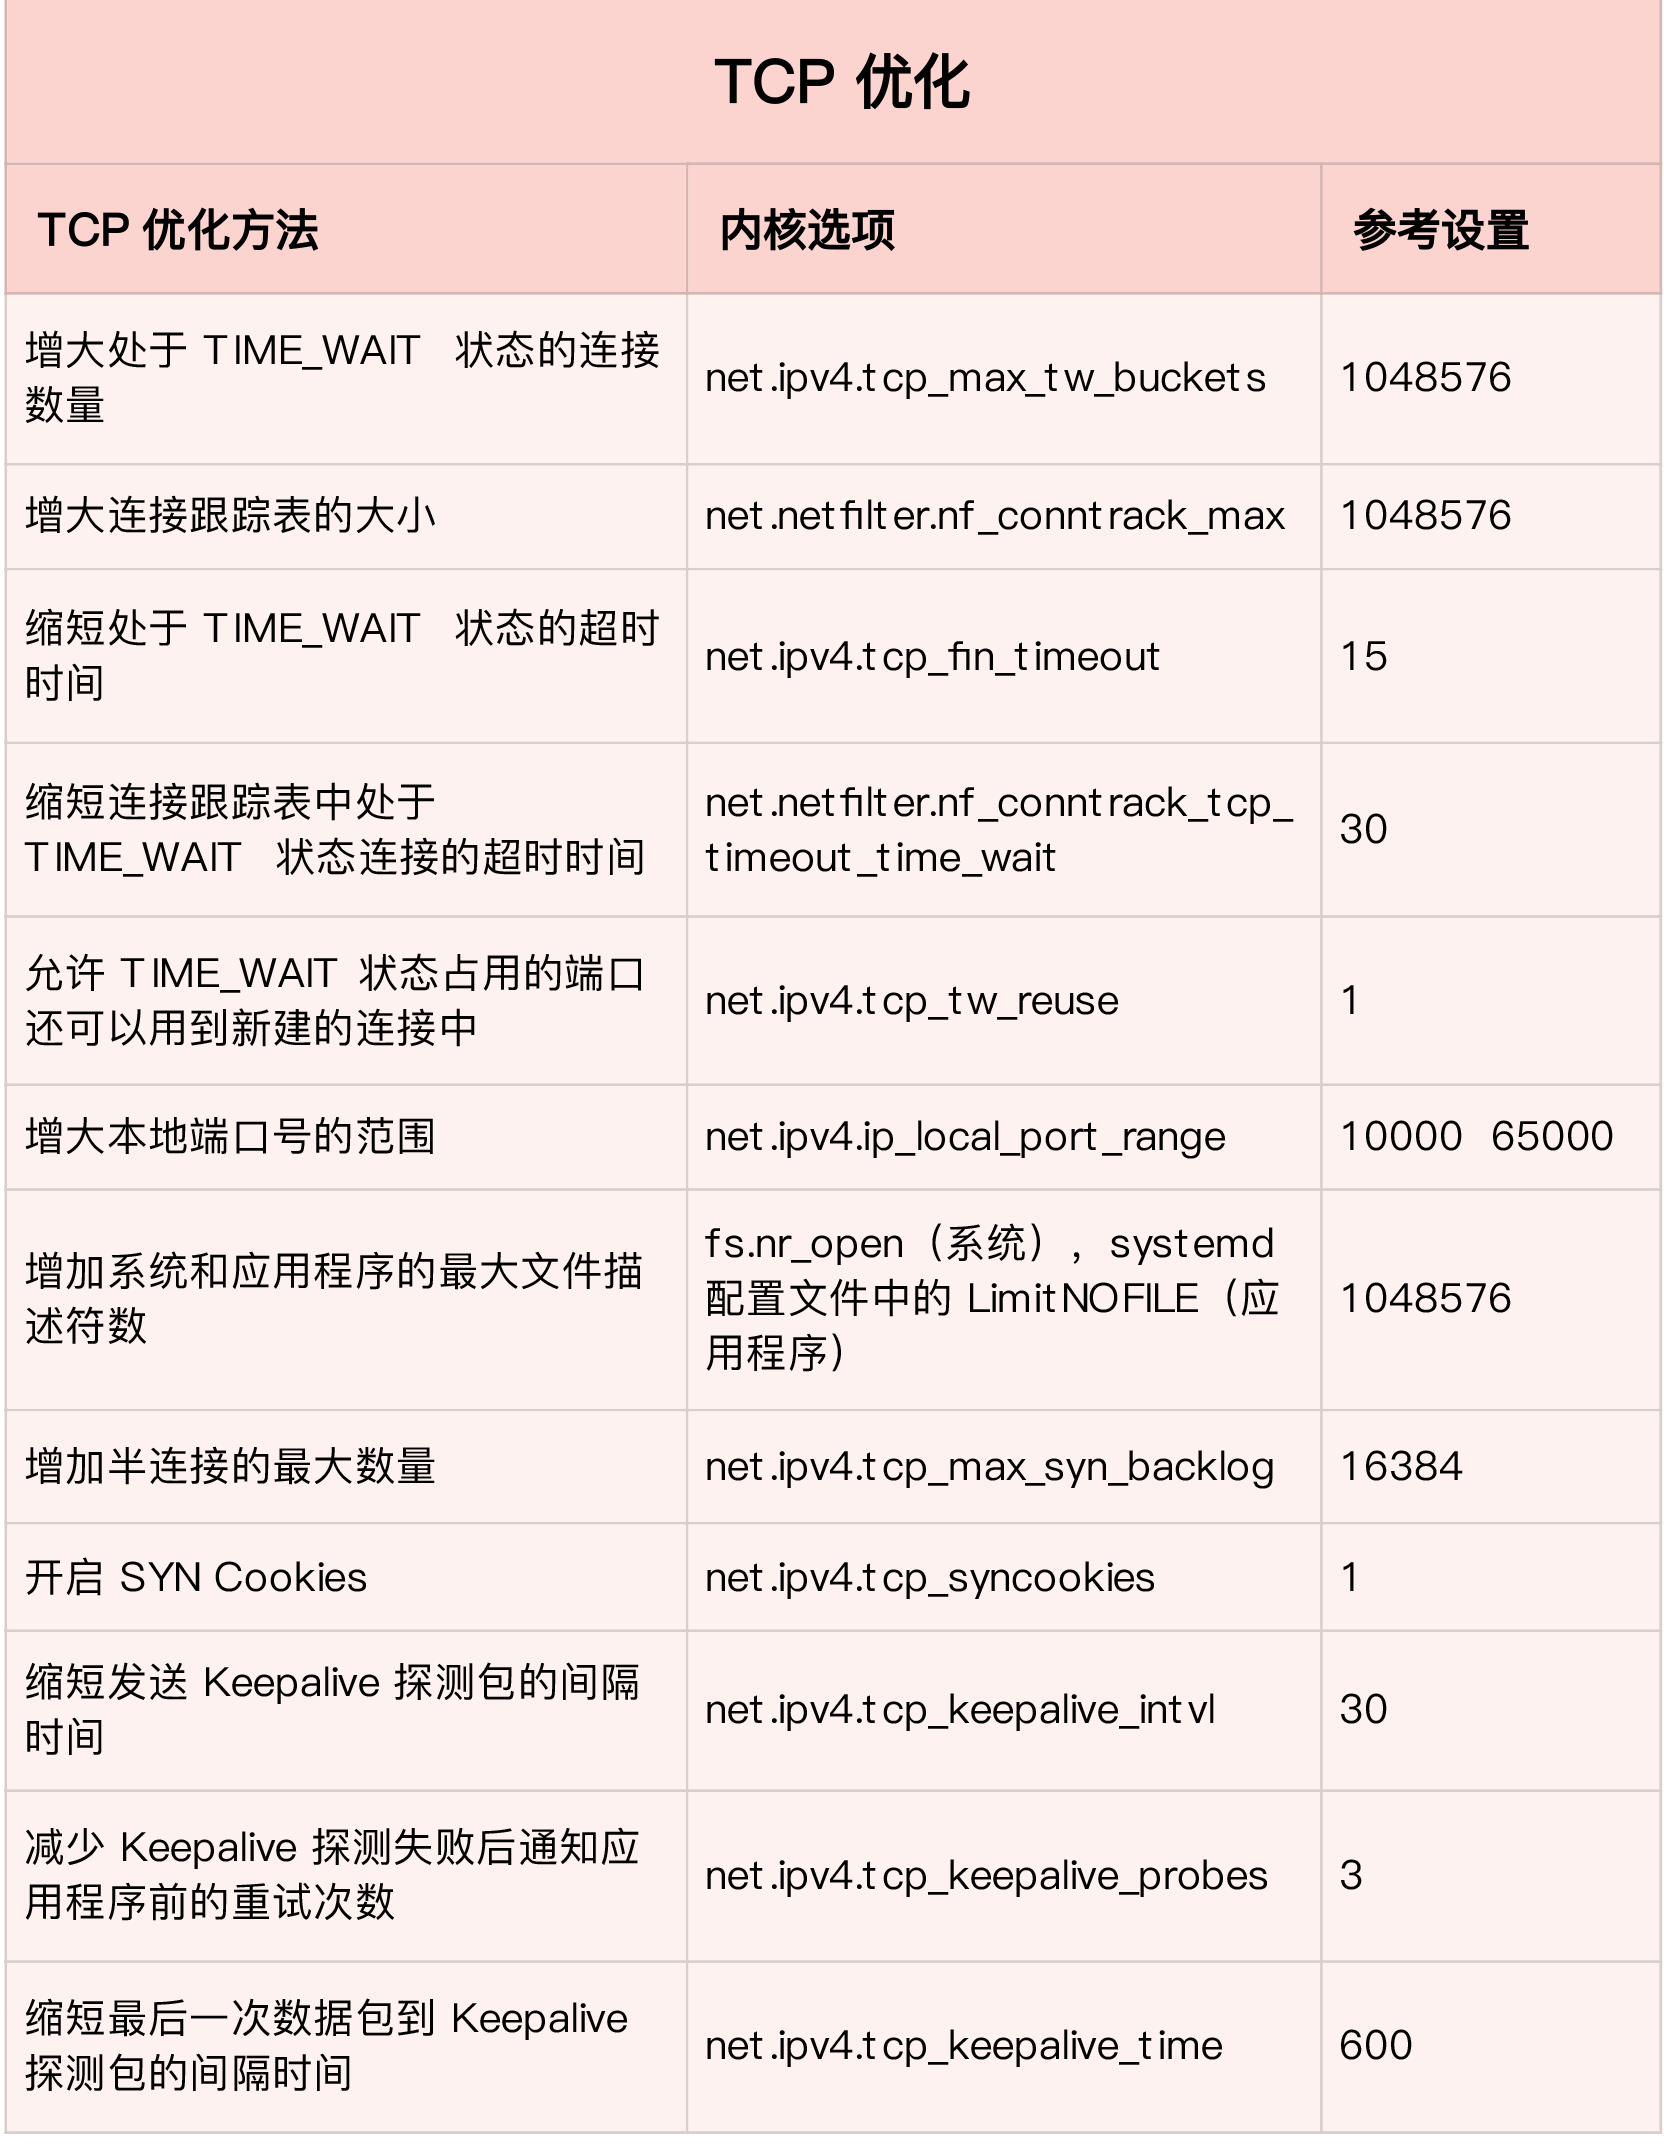
NAT 性能优化
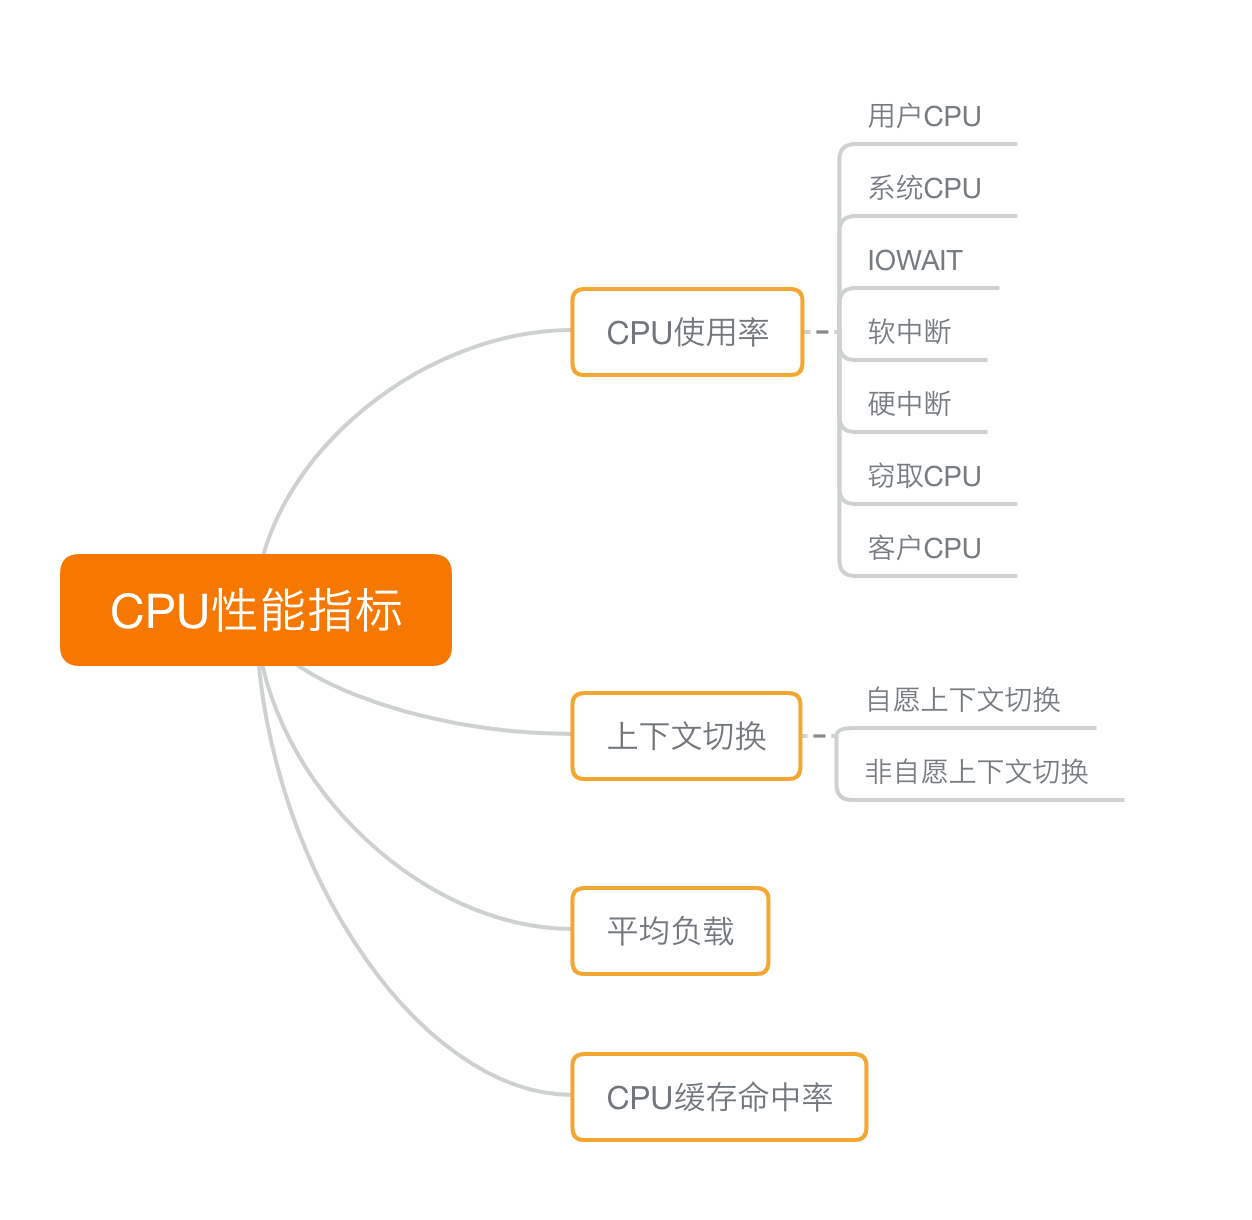
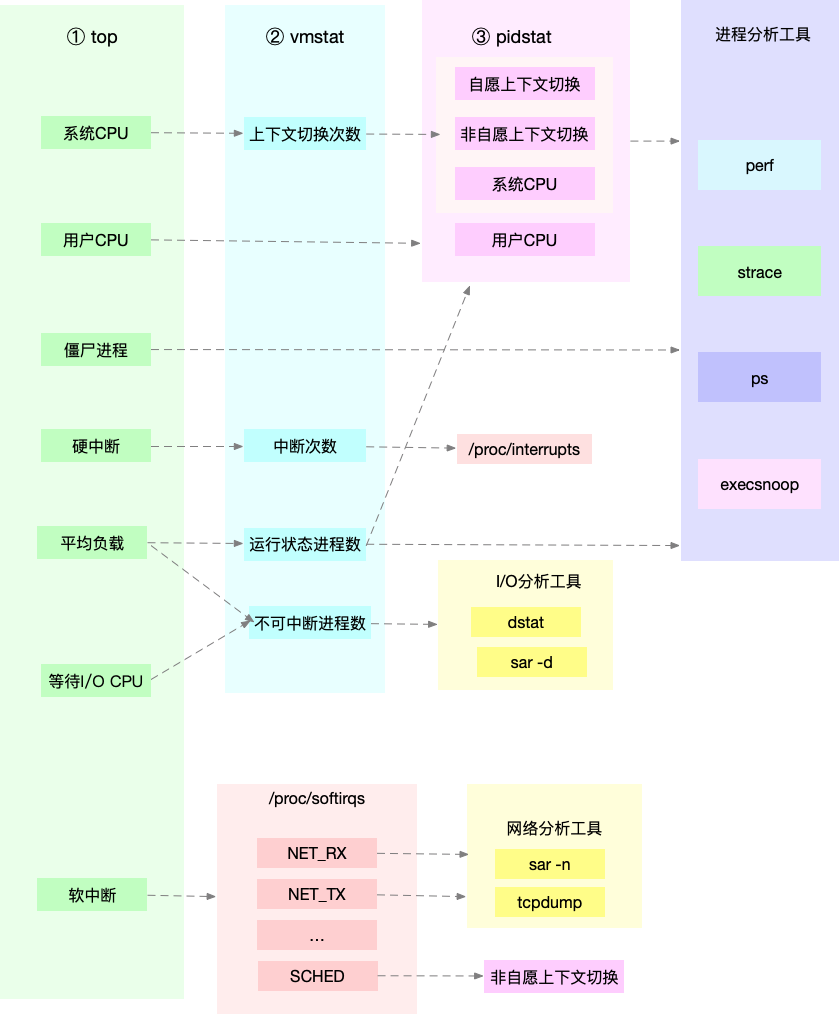
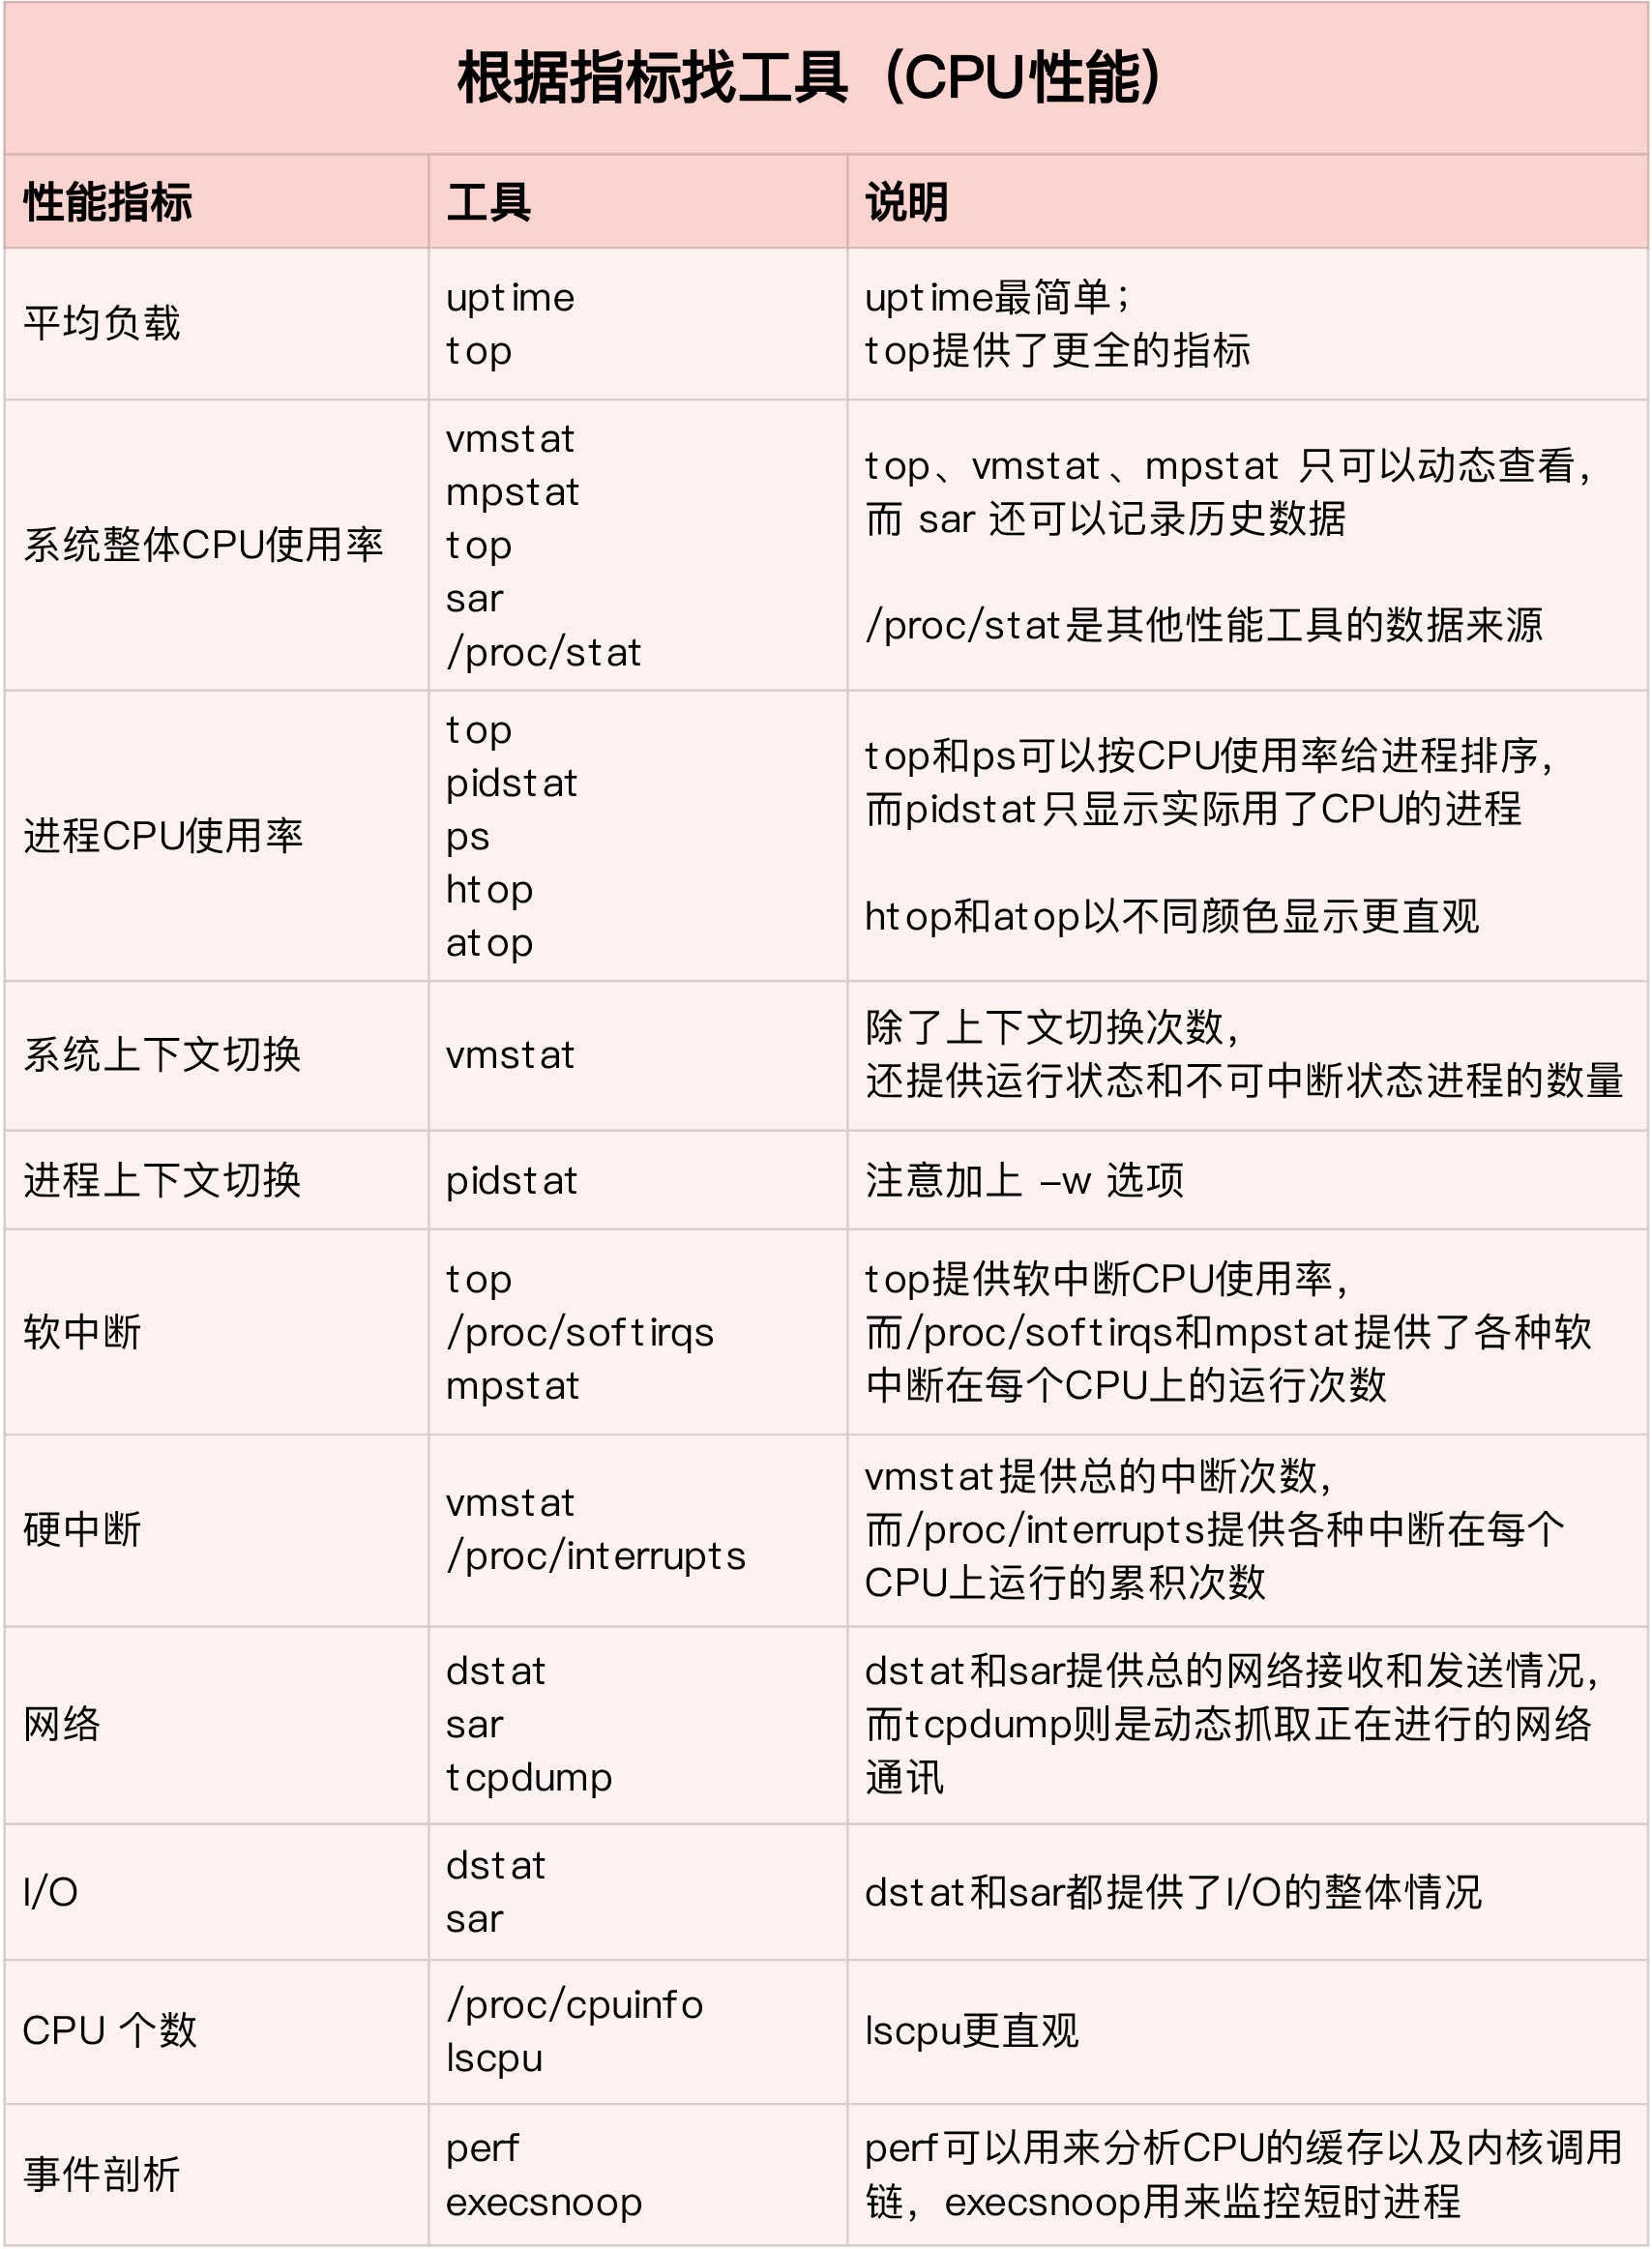
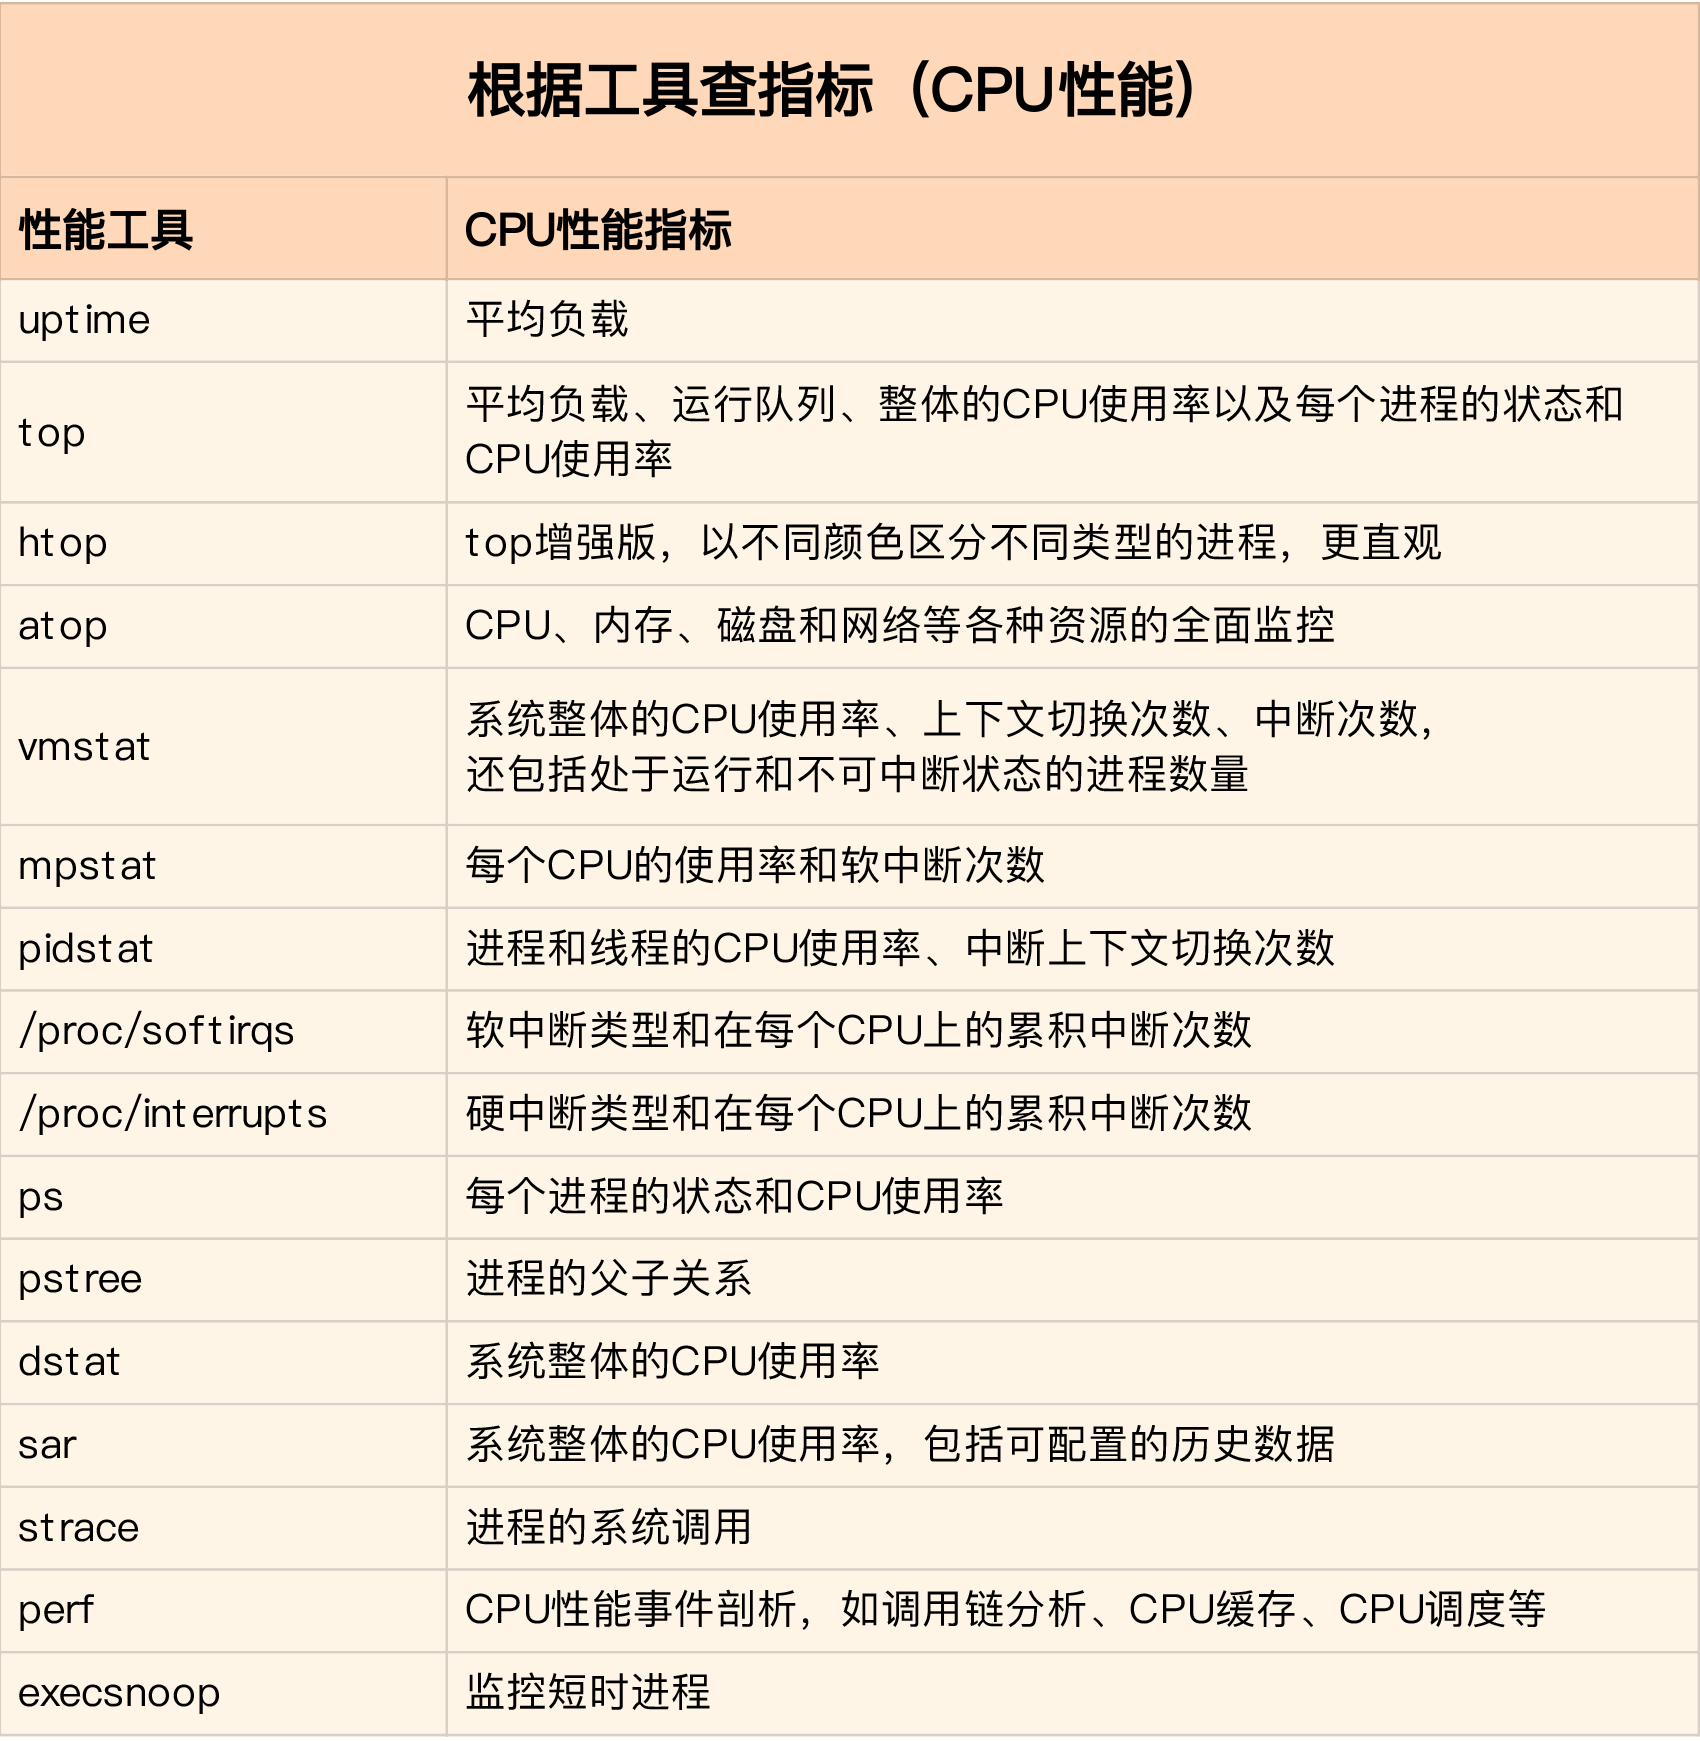
CPU
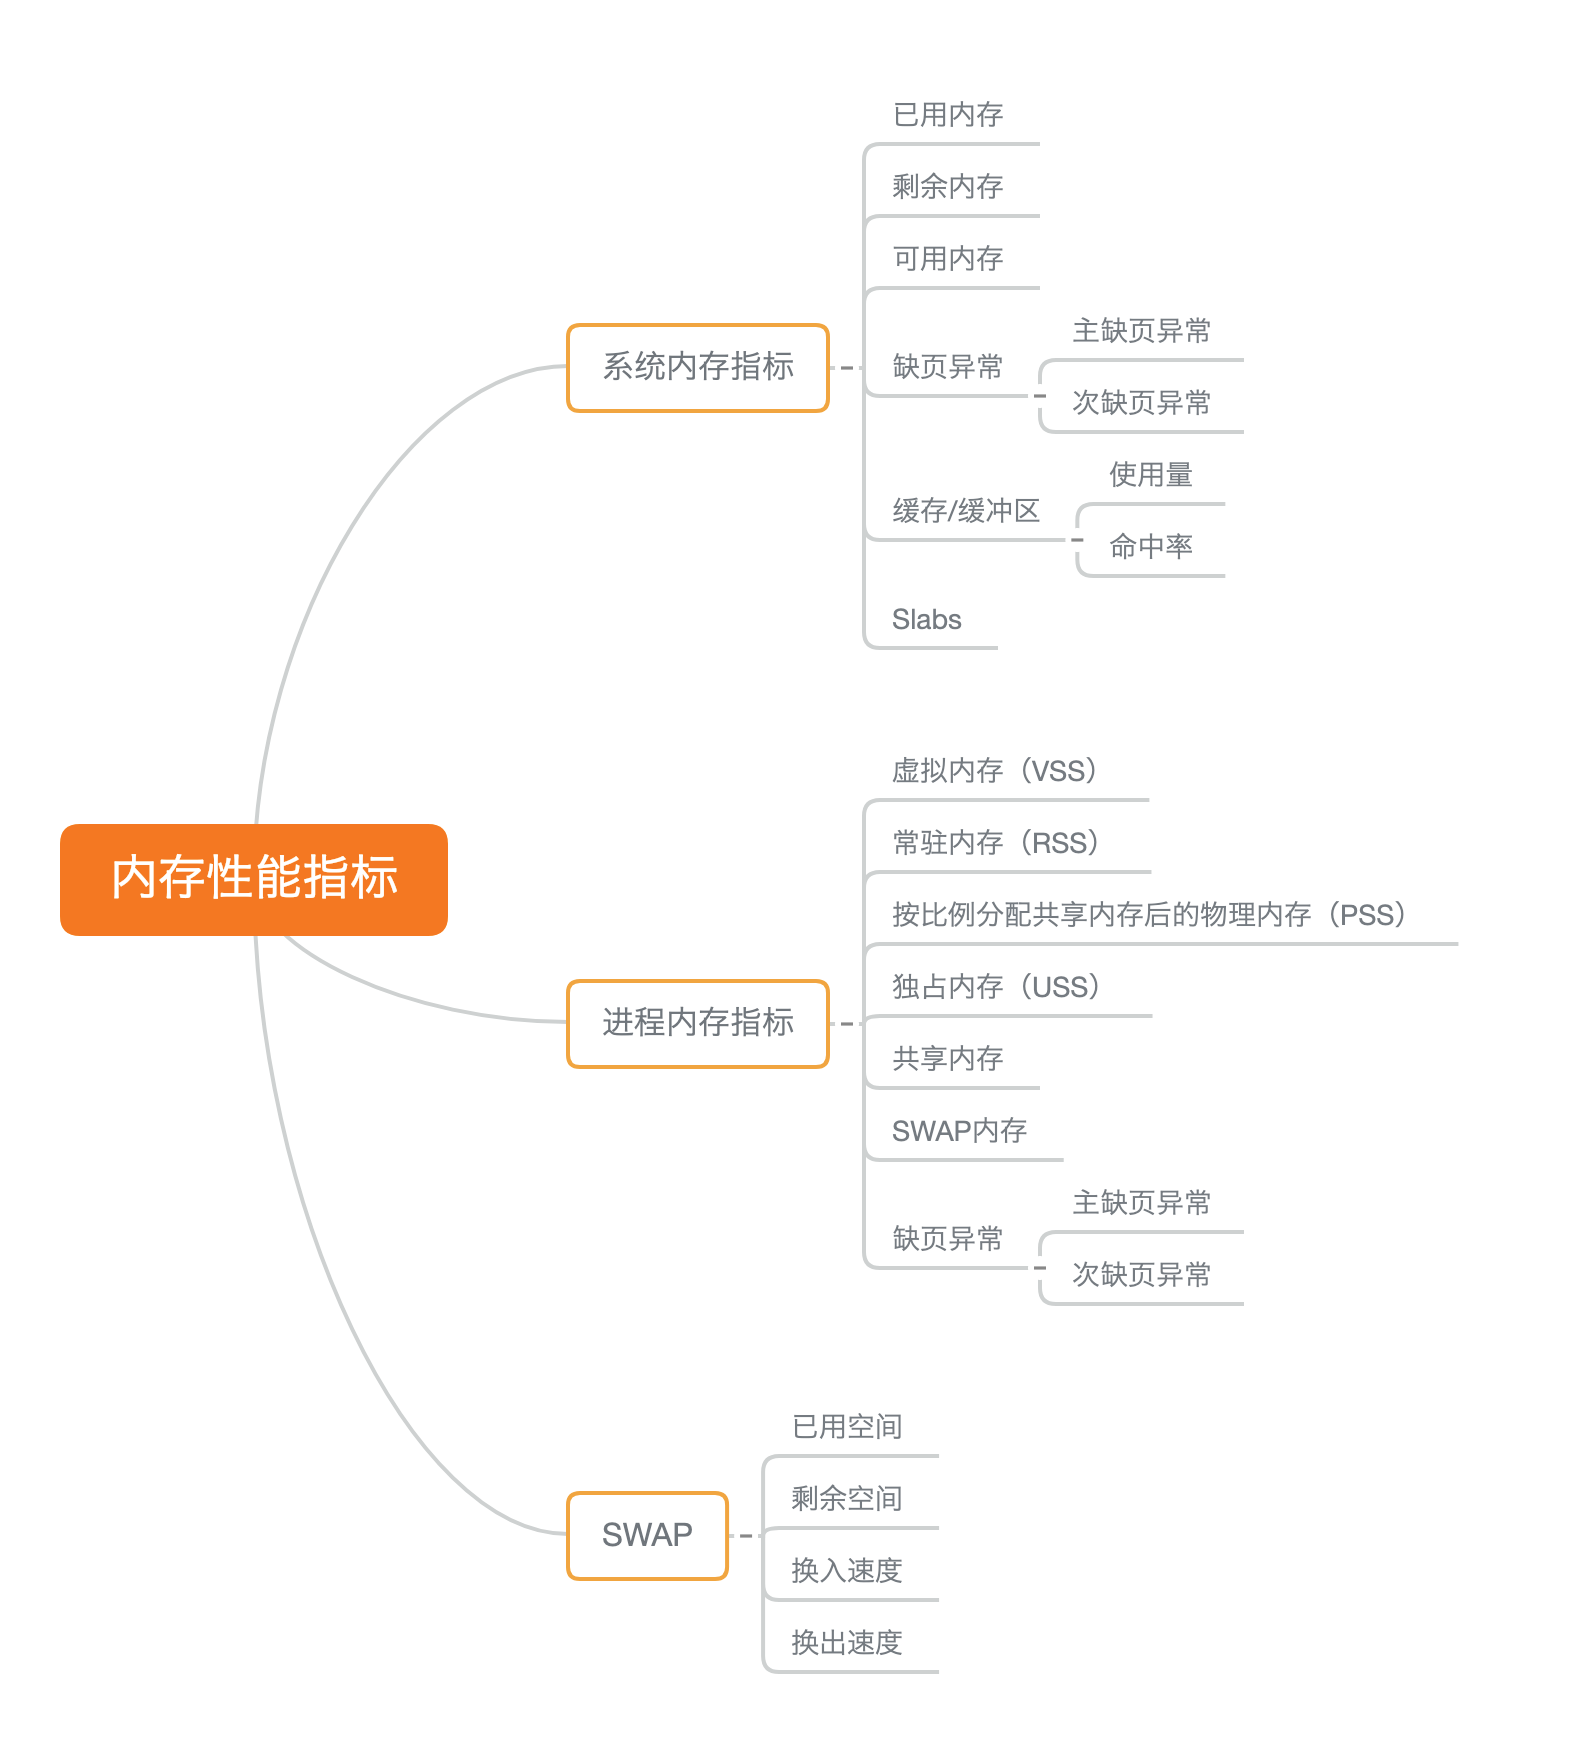
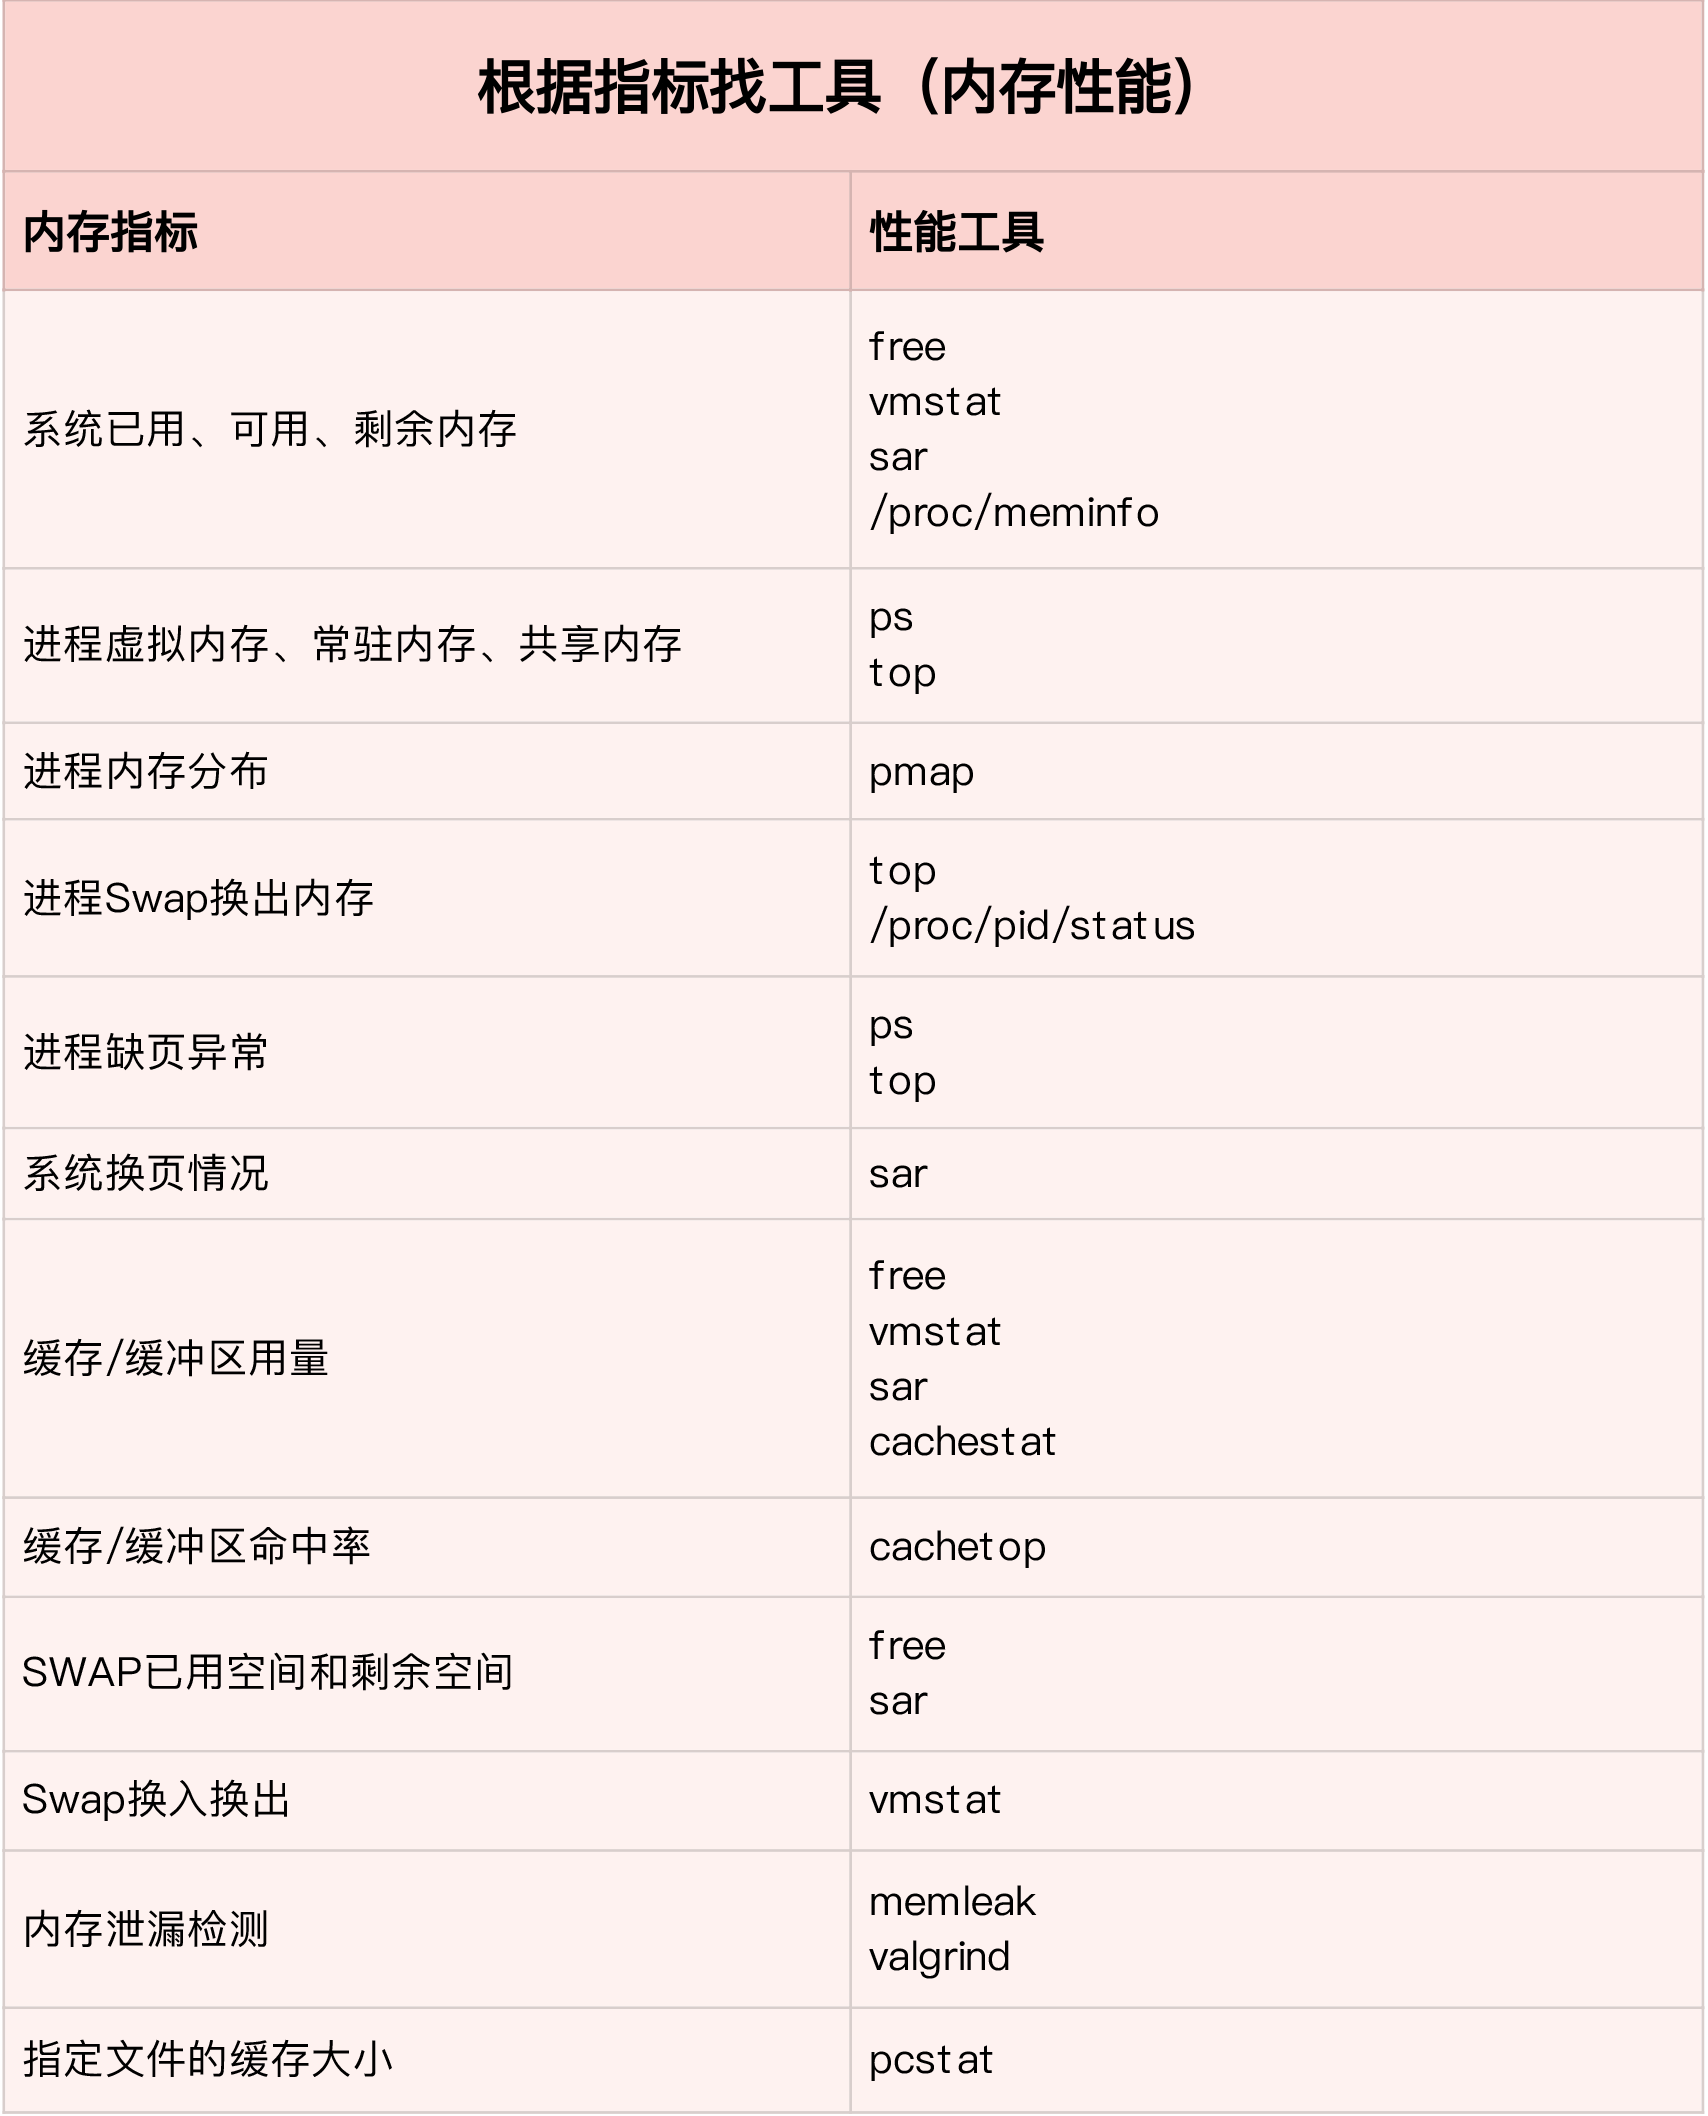
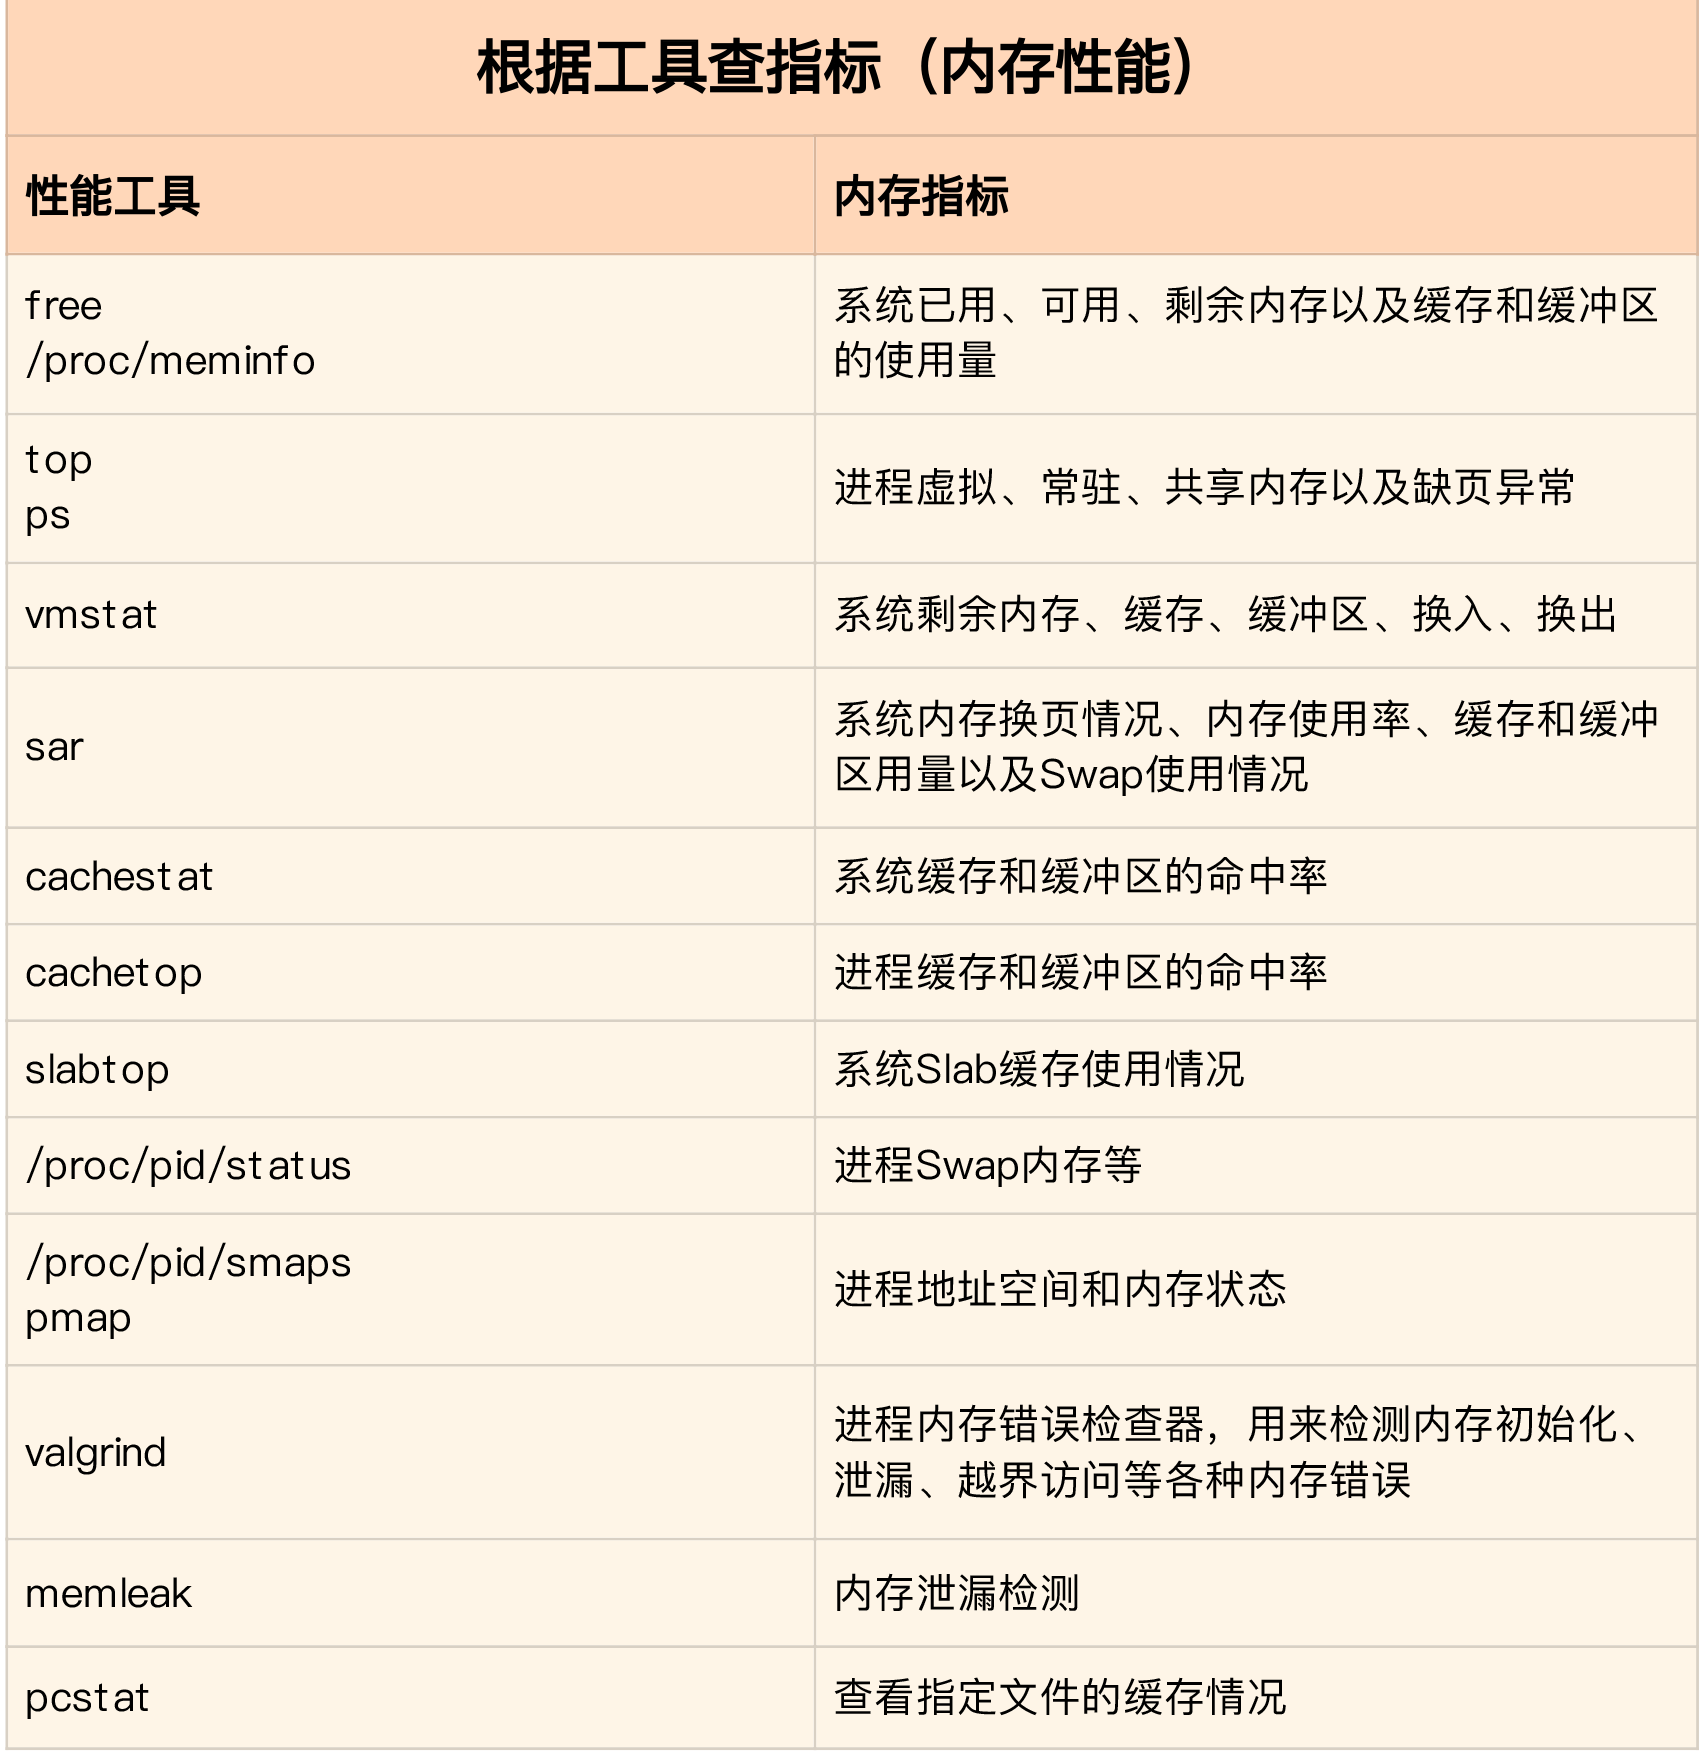
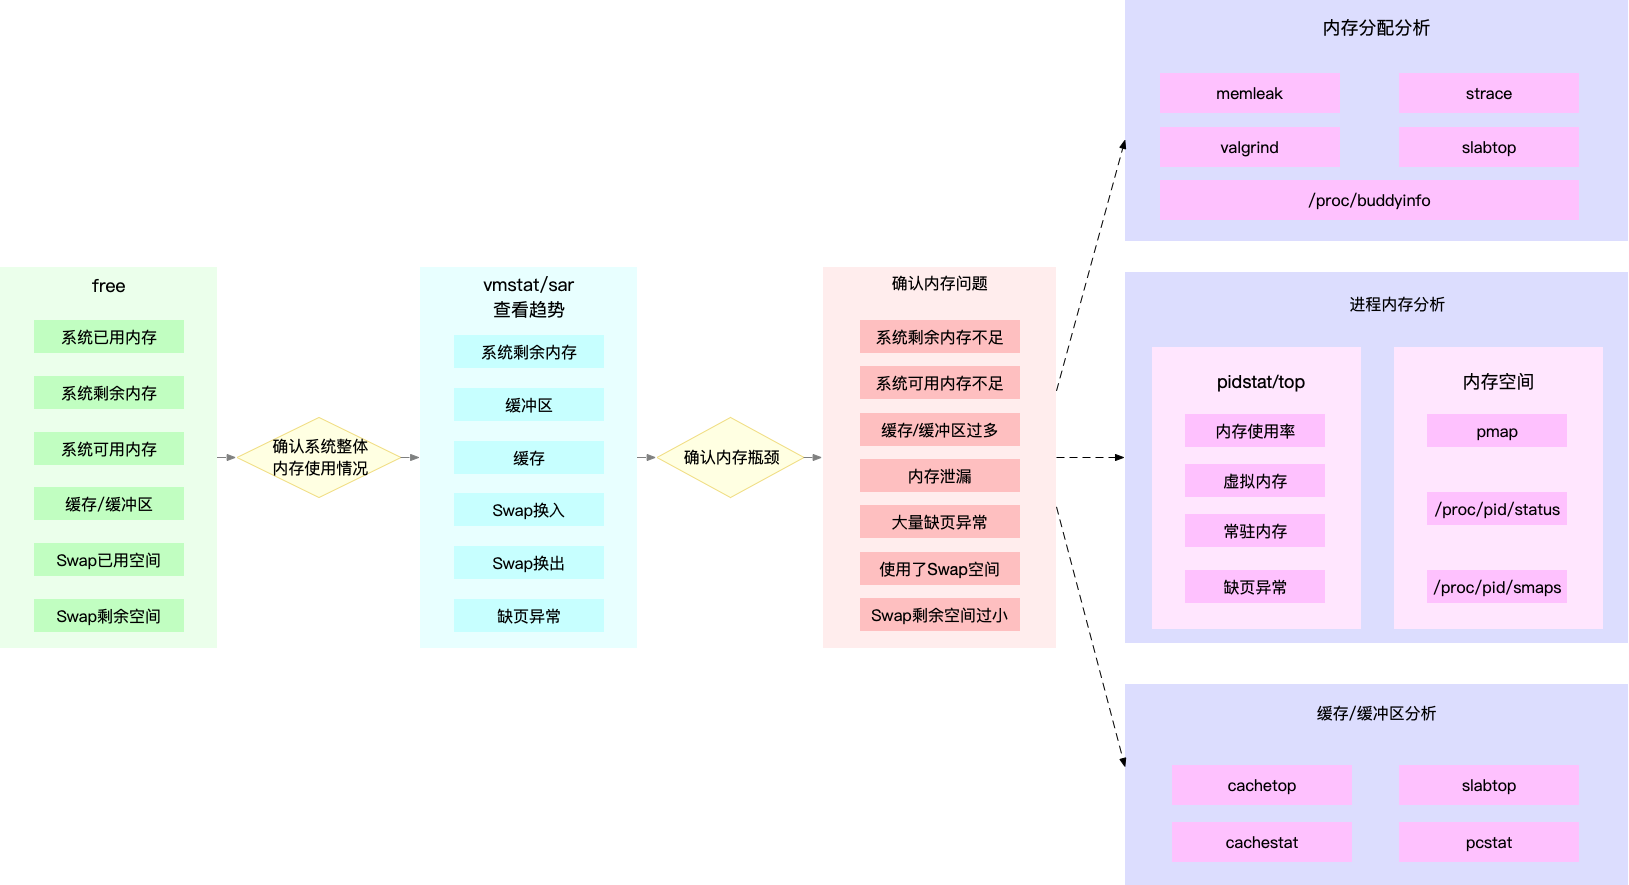
内存
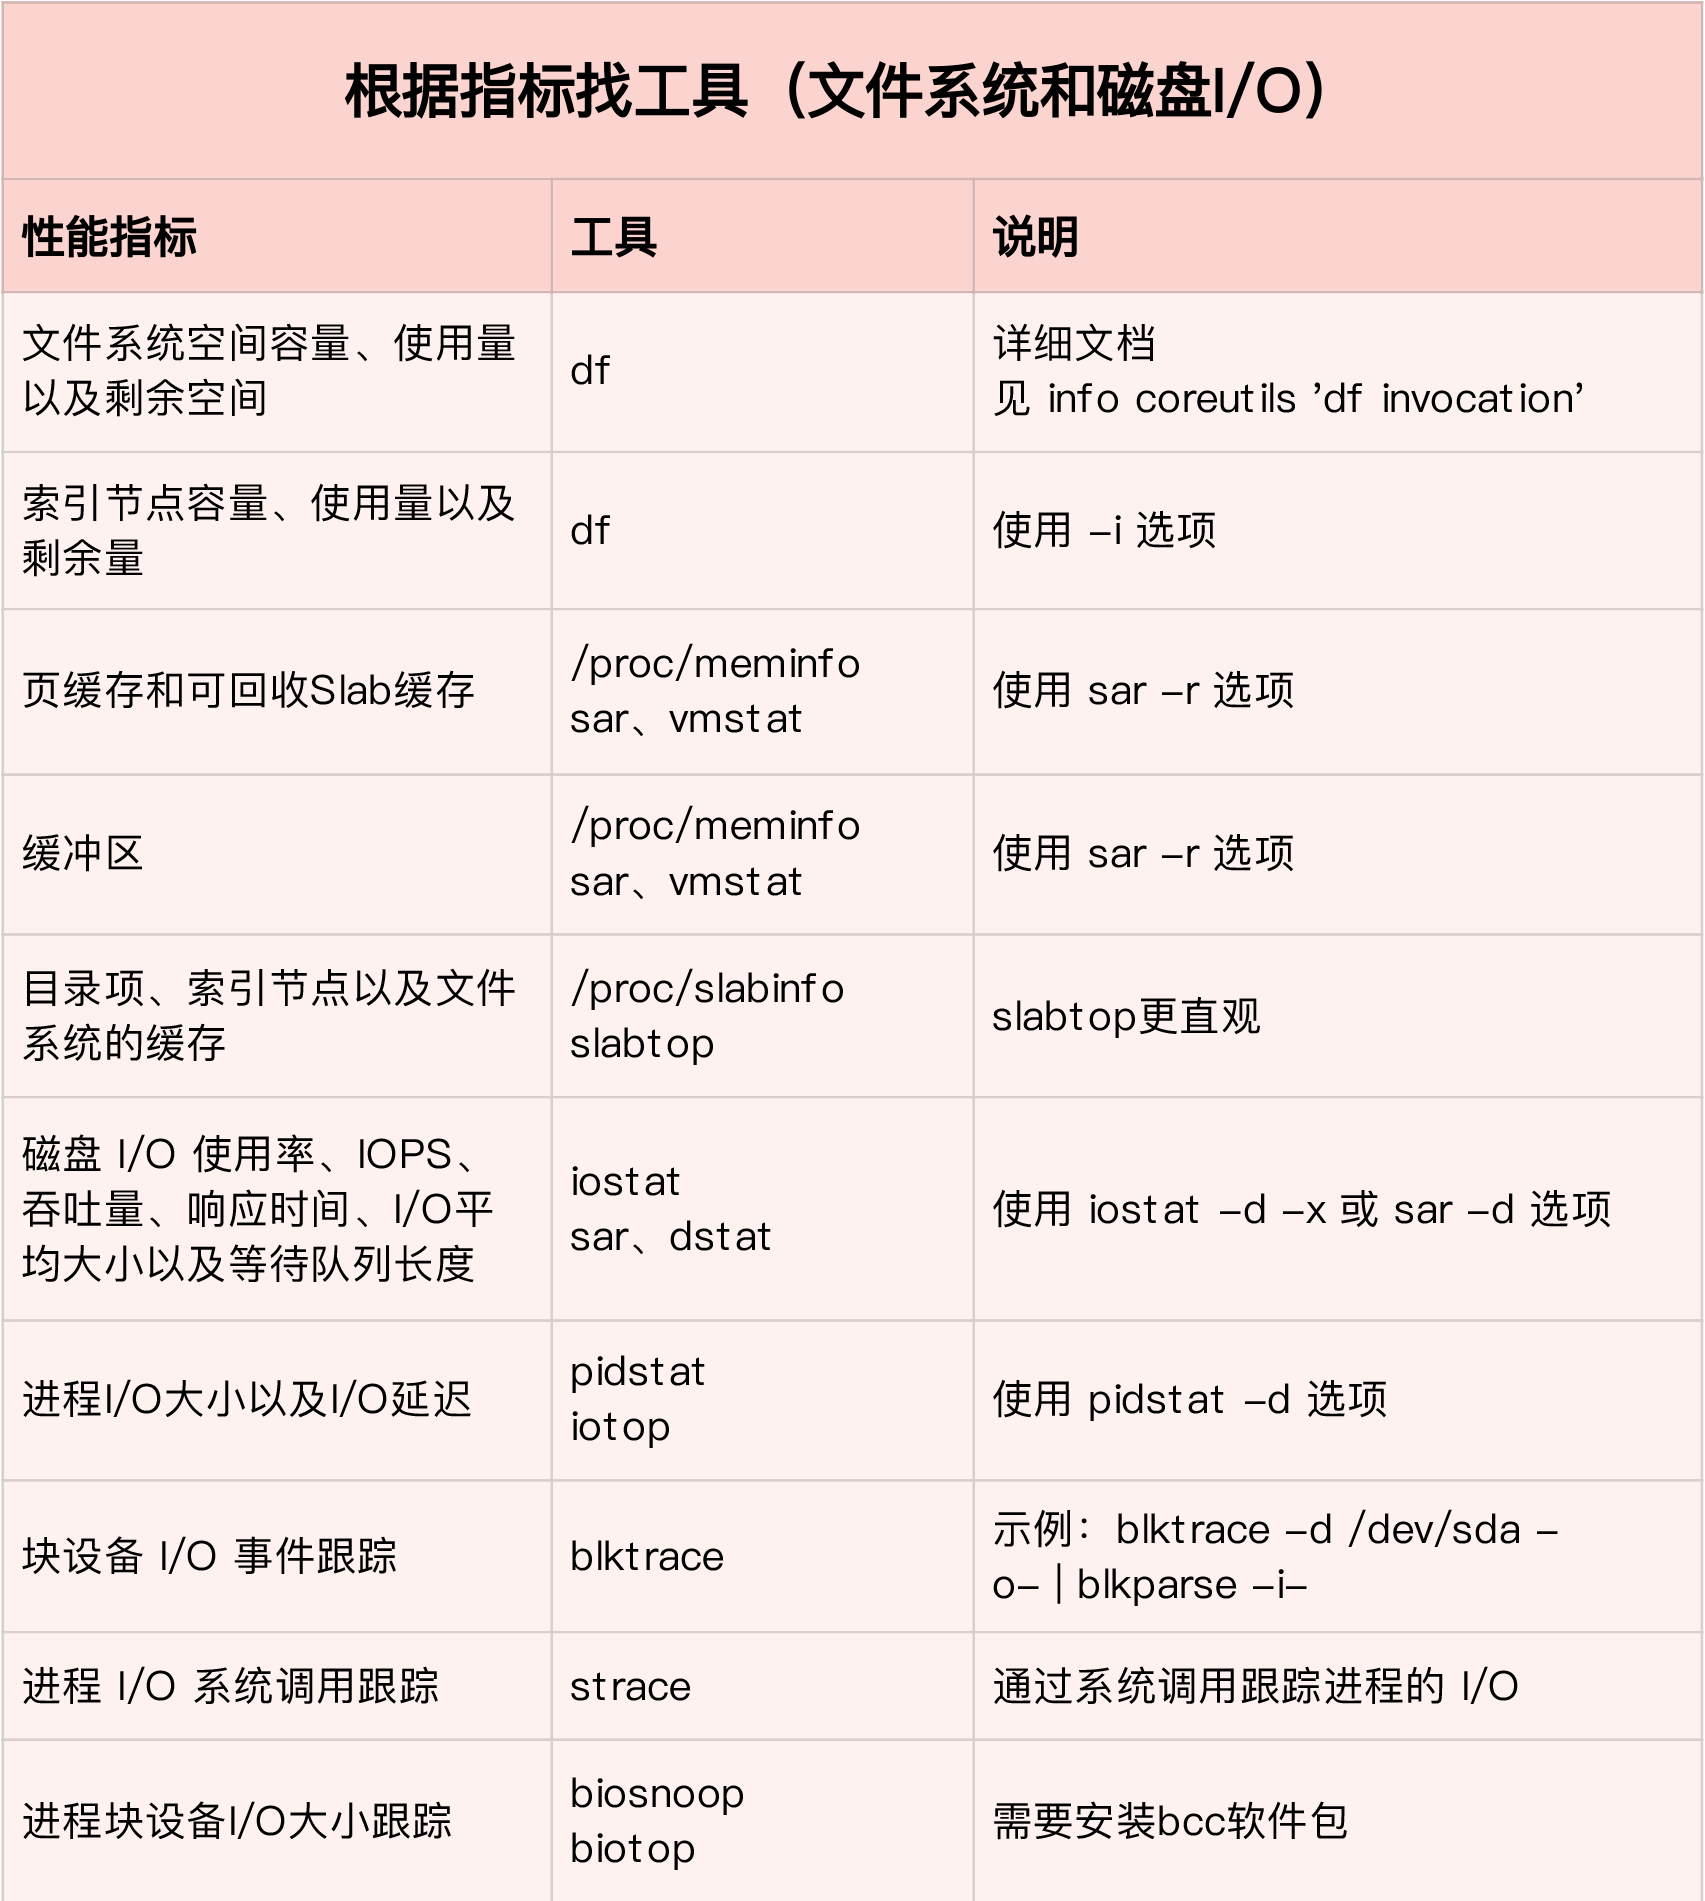
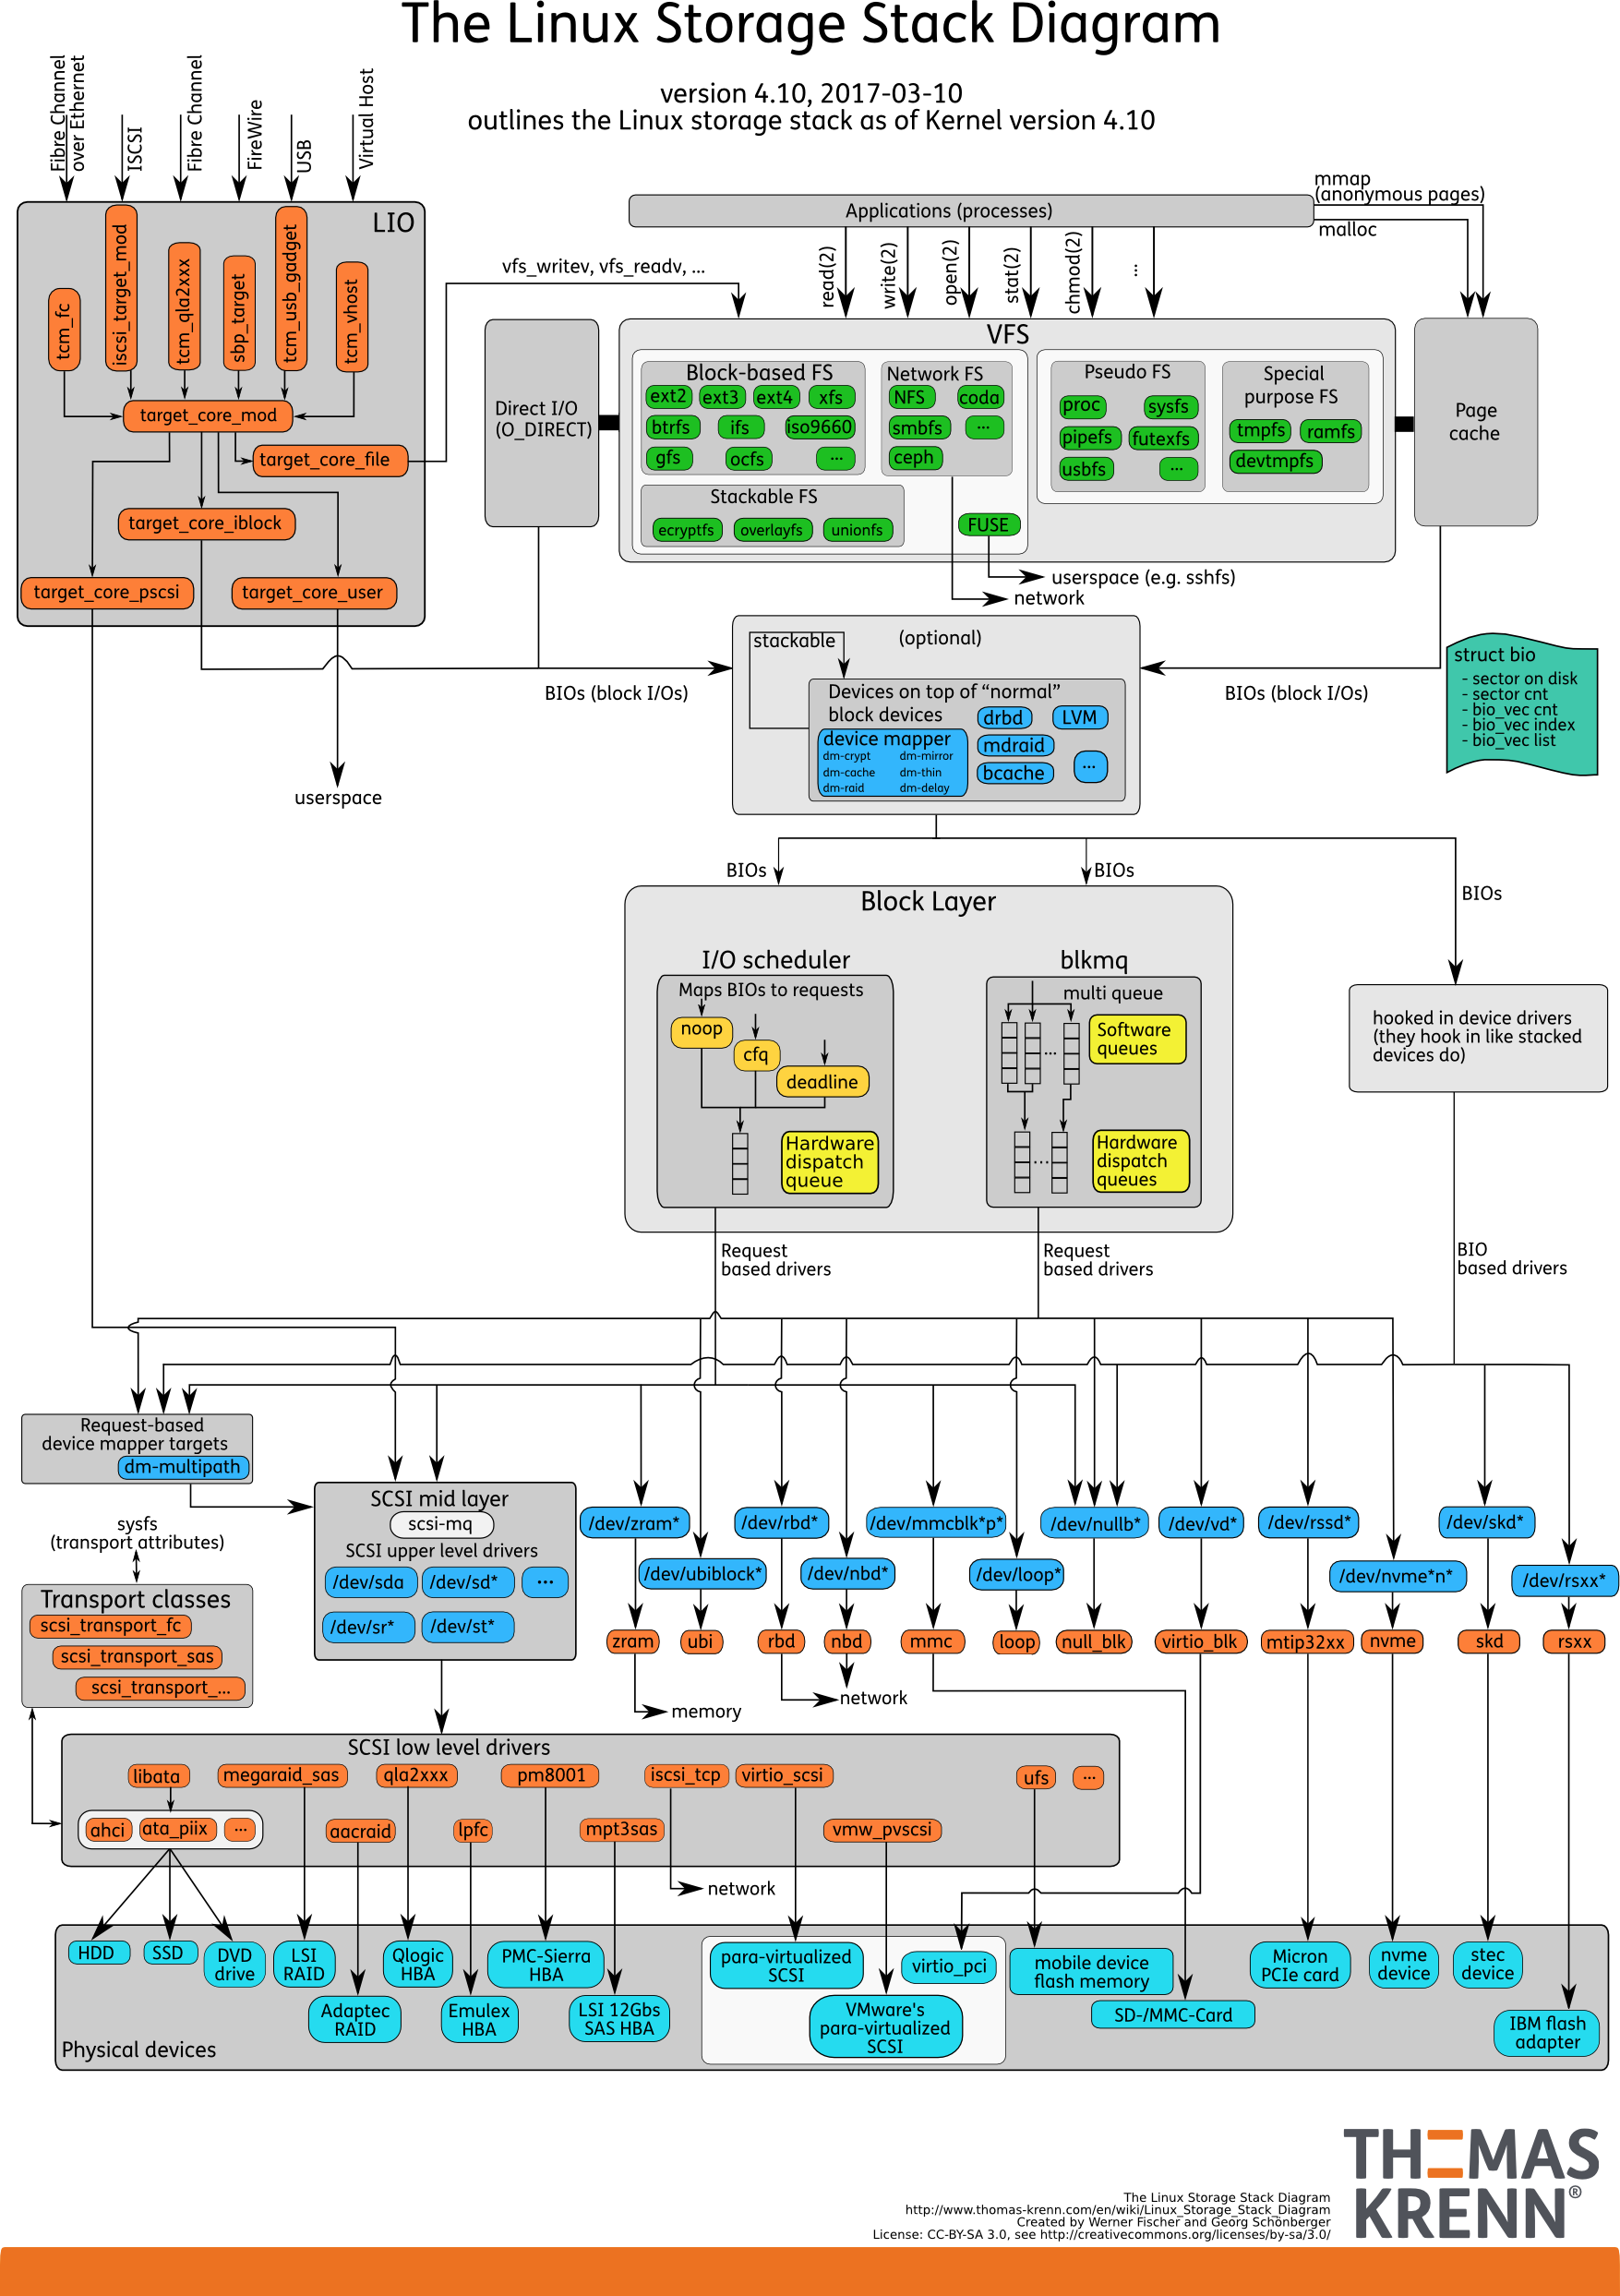
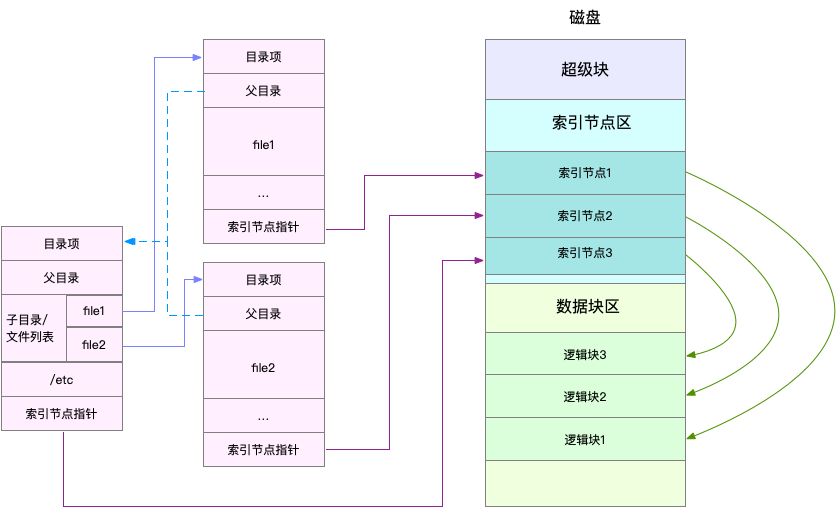
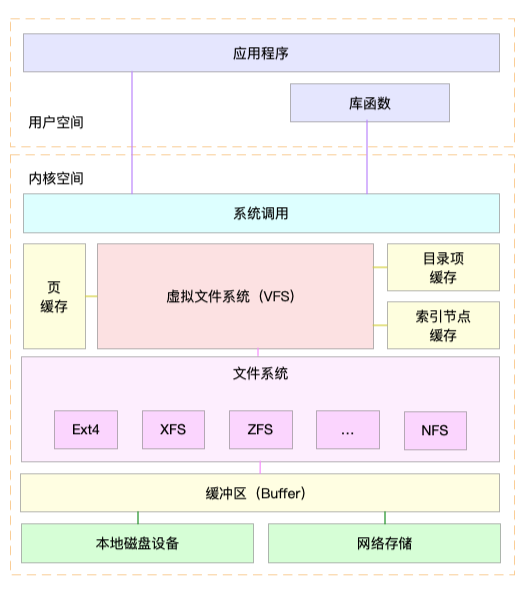
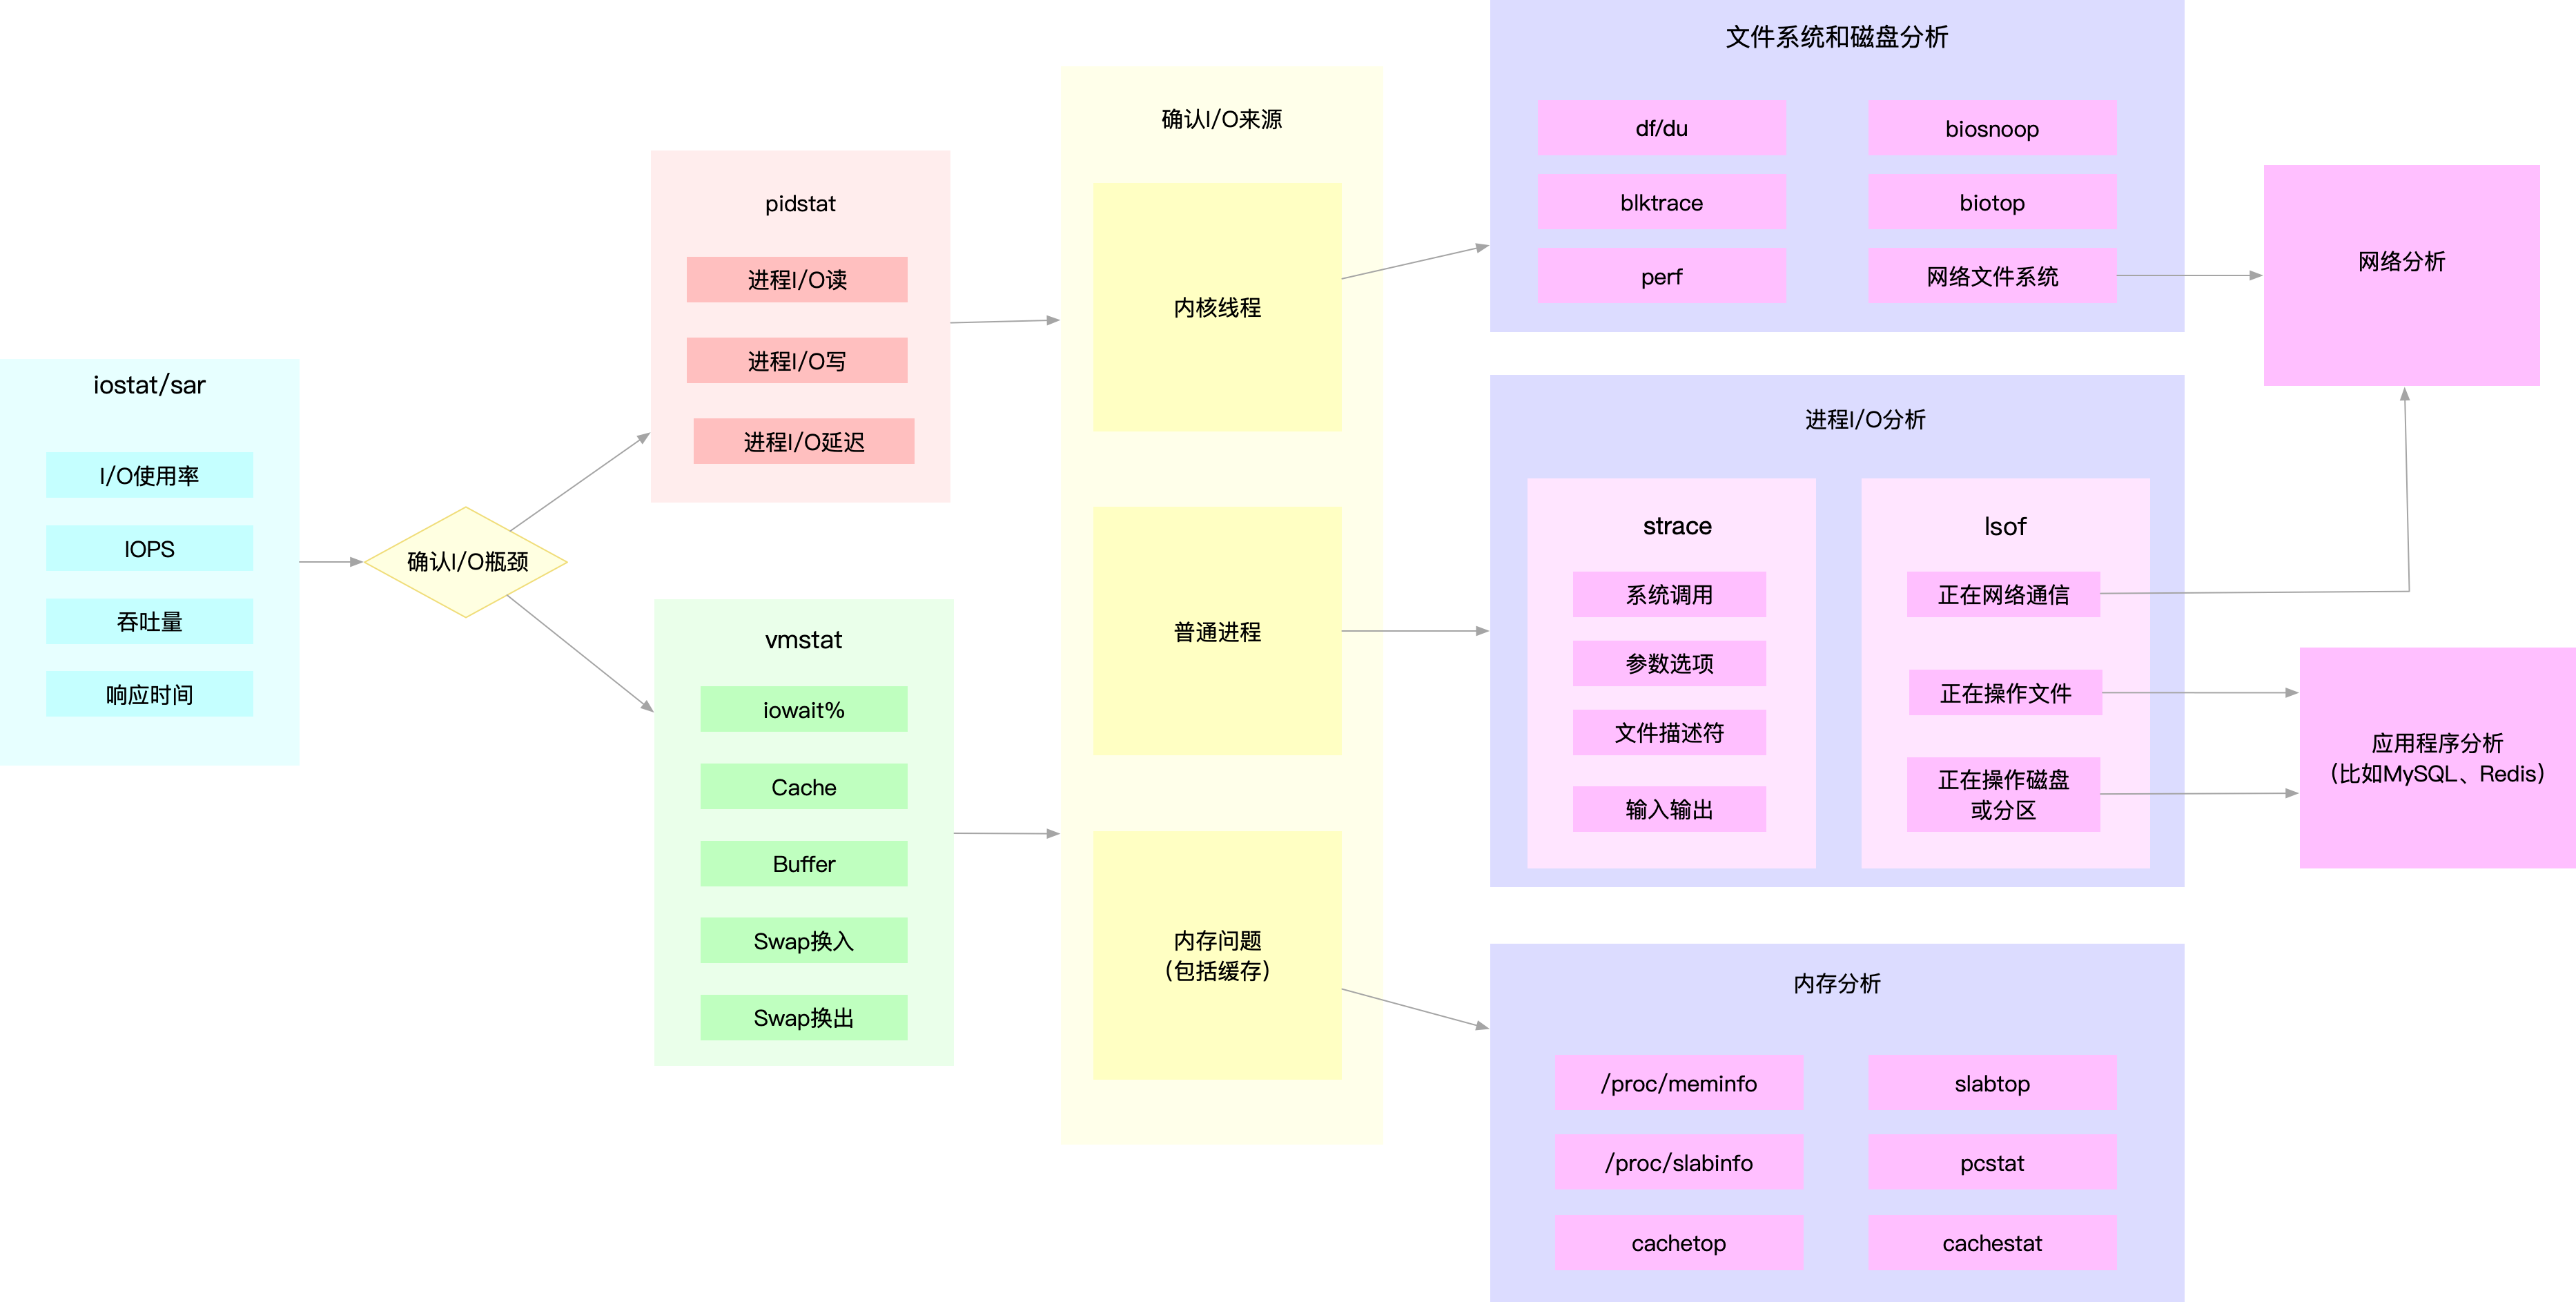
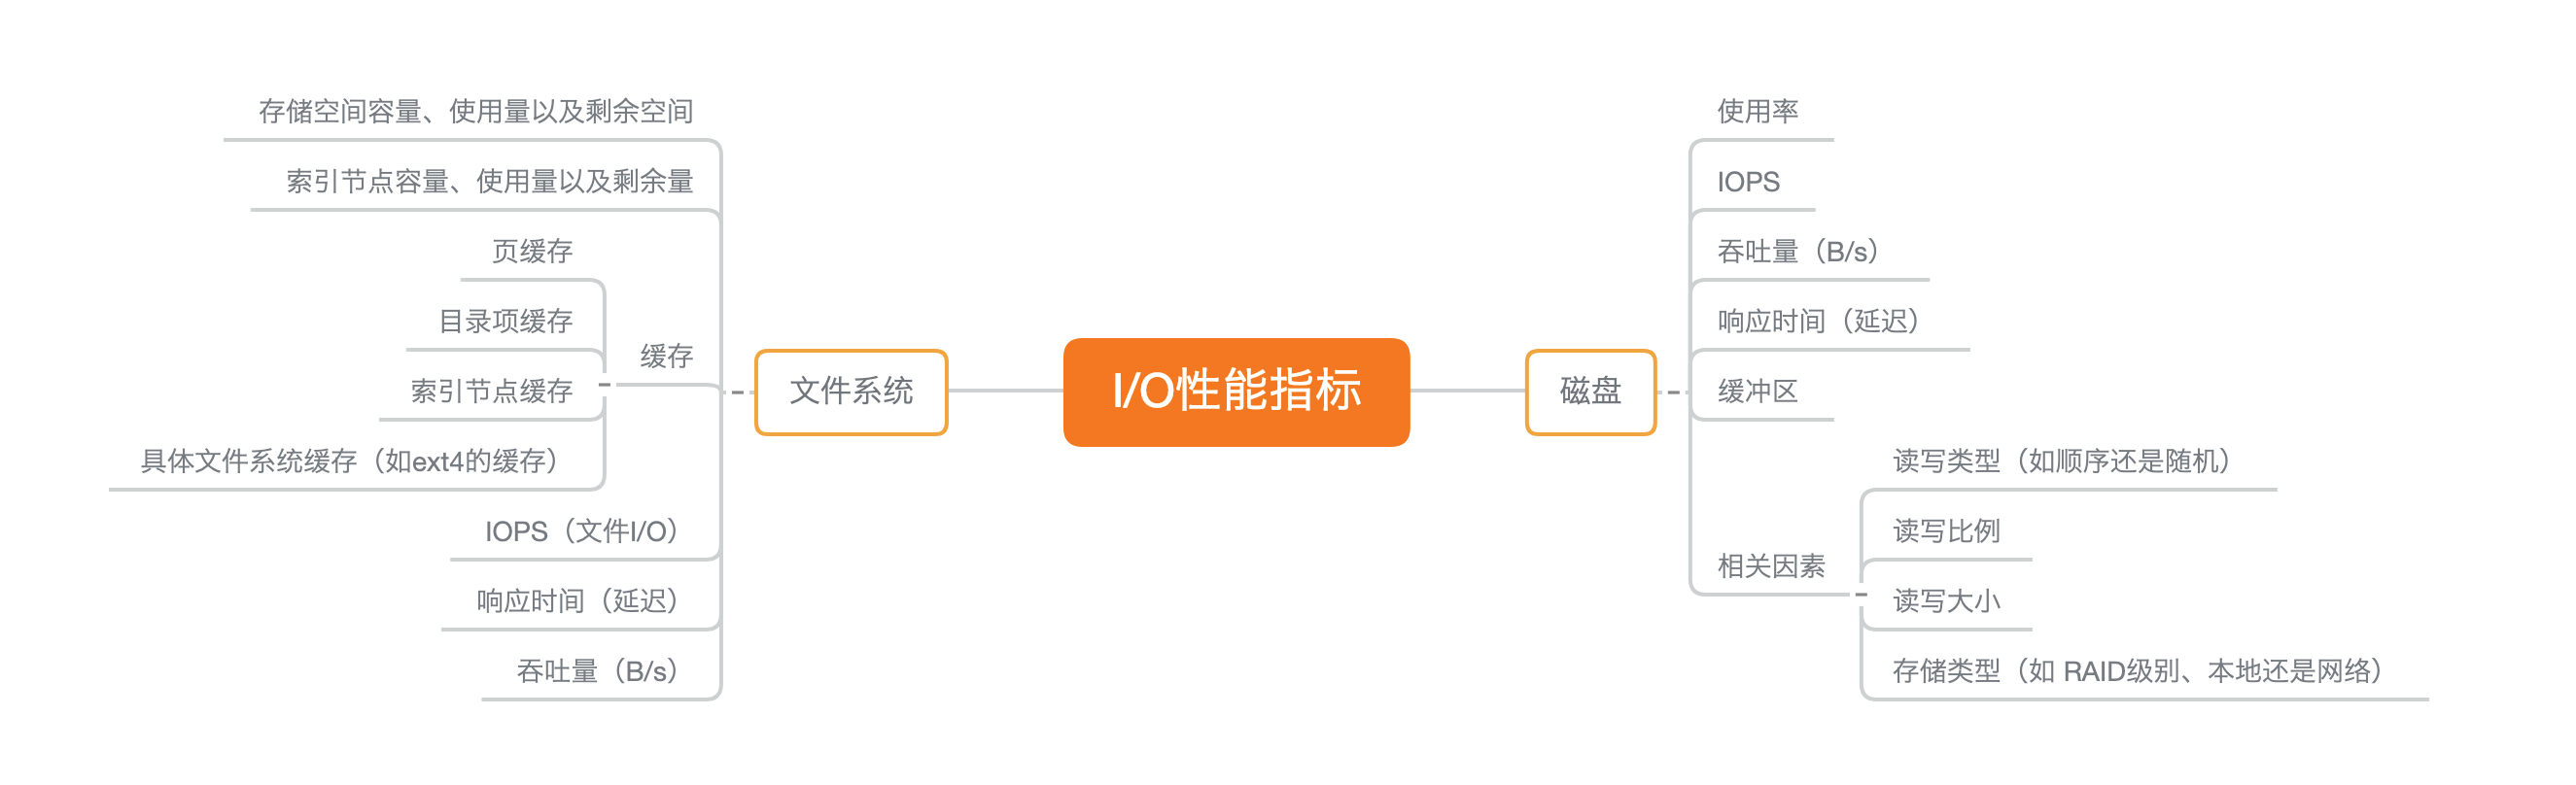
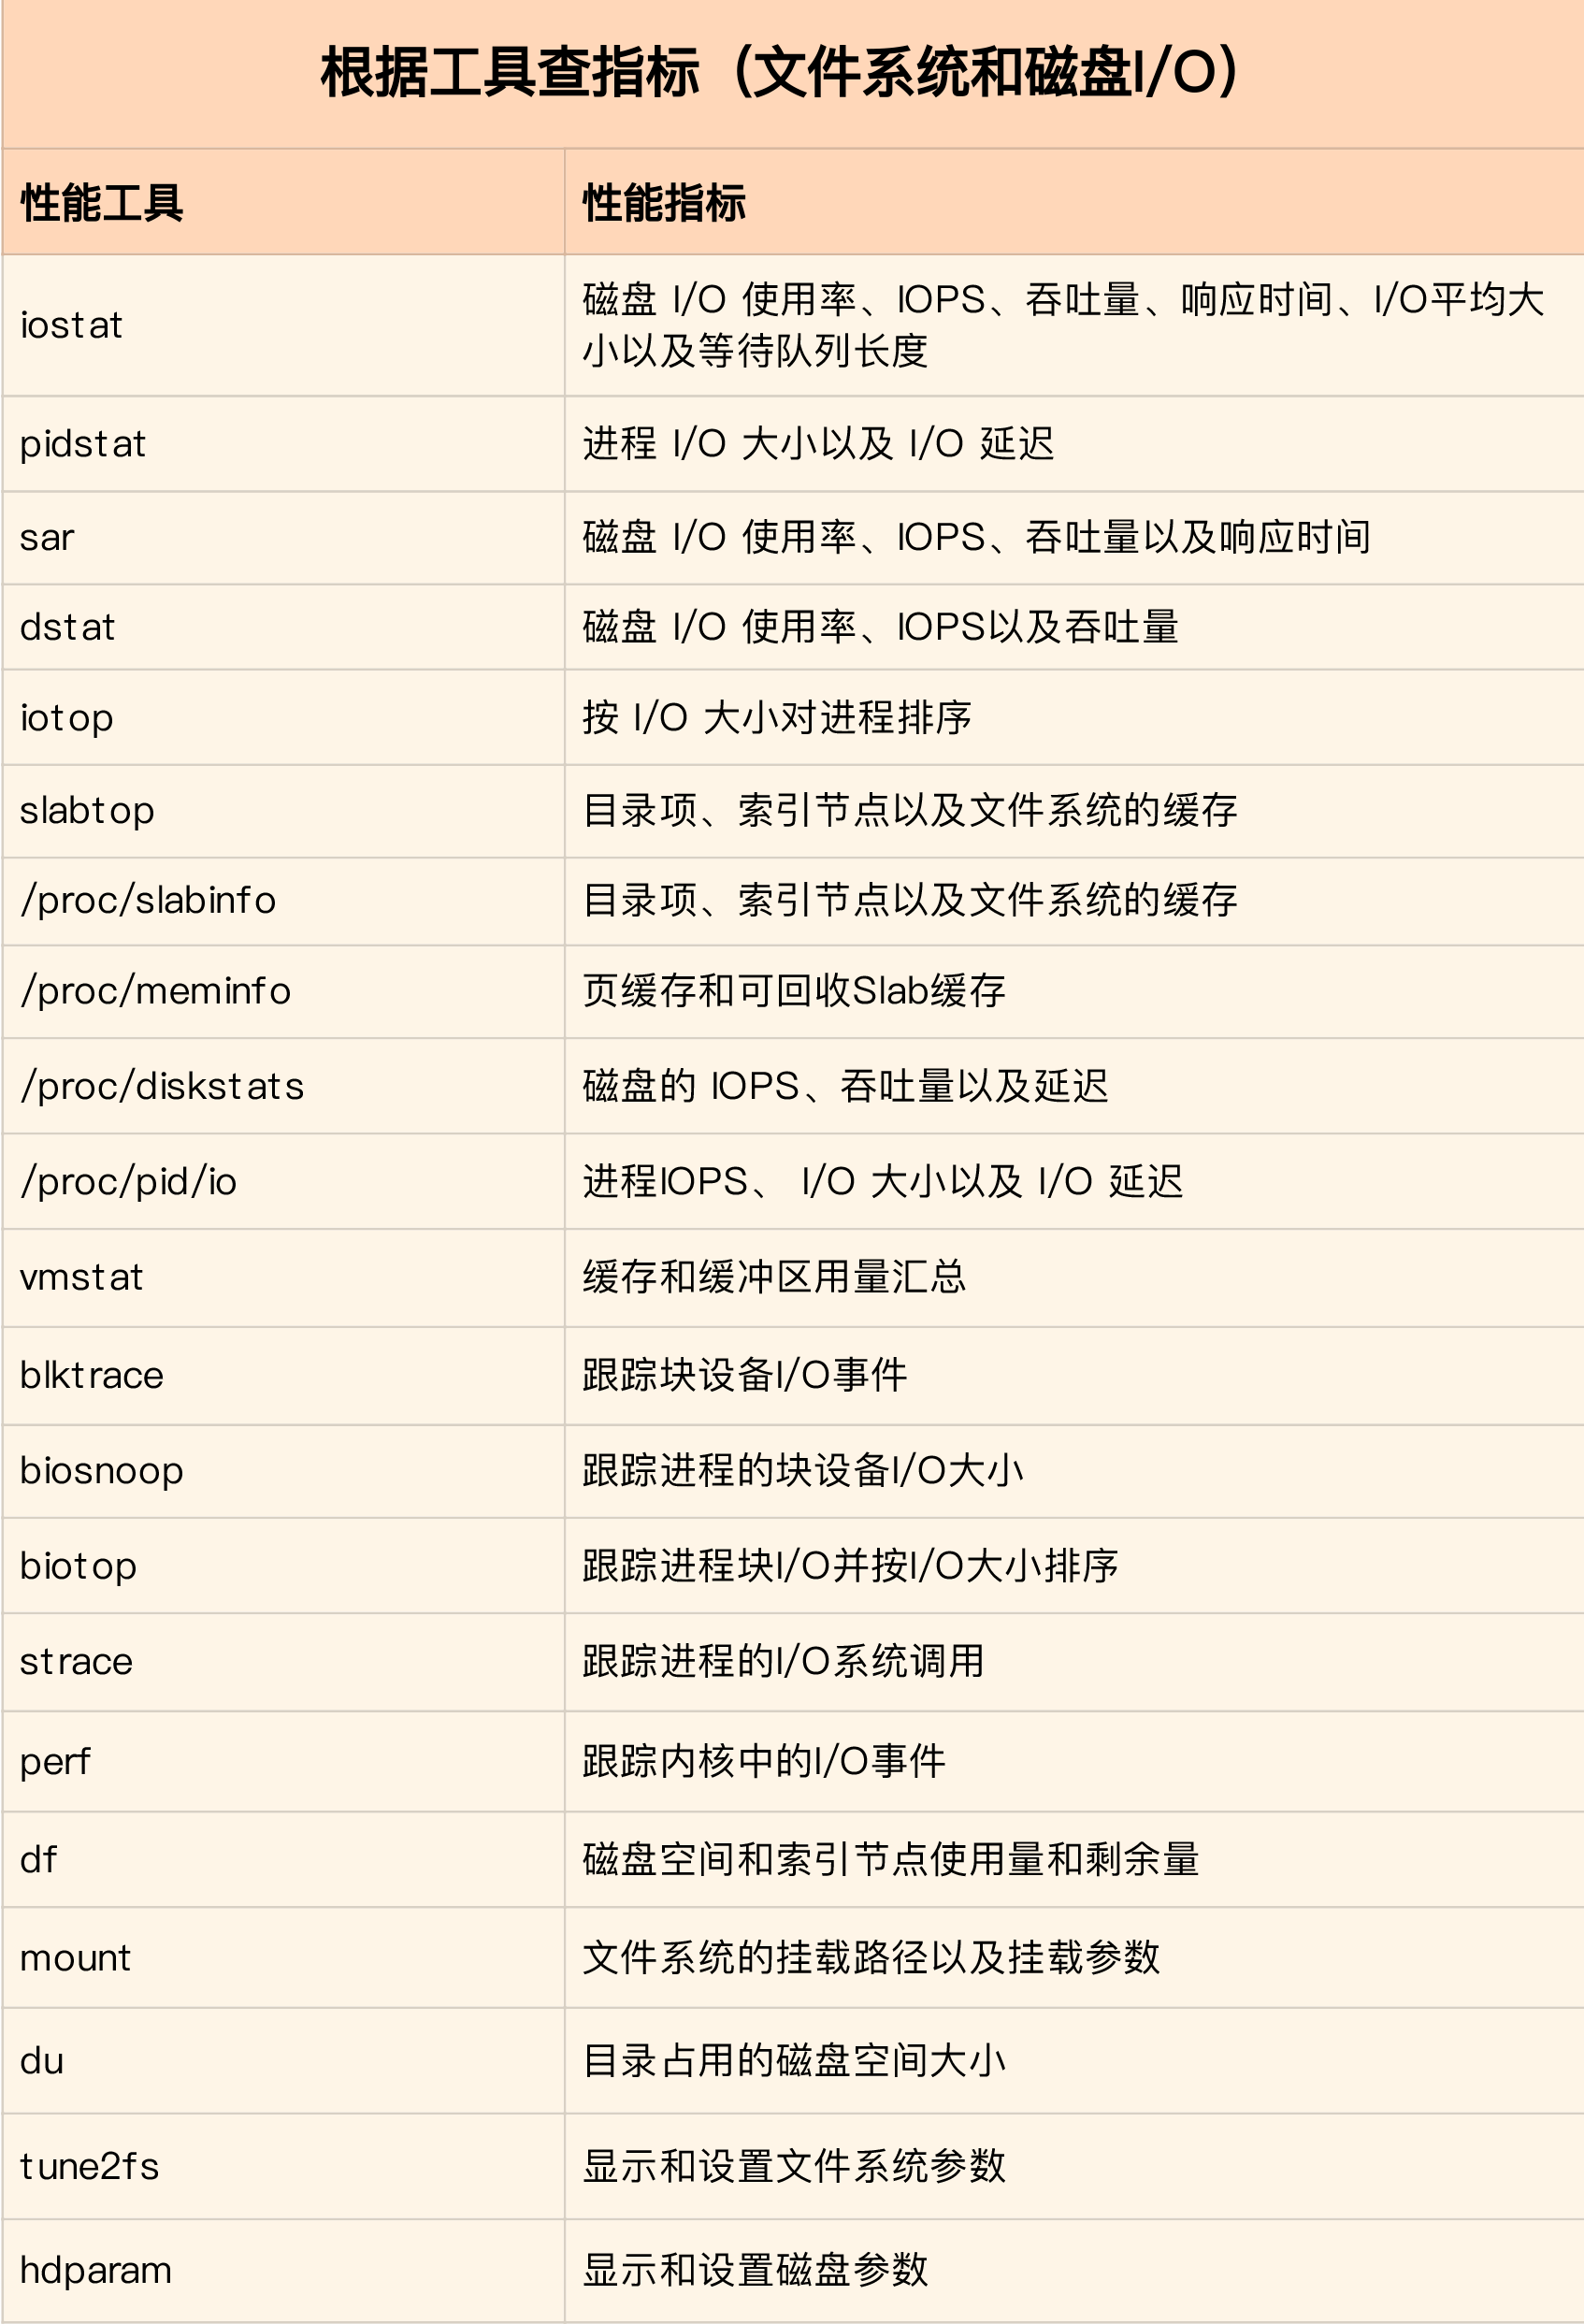
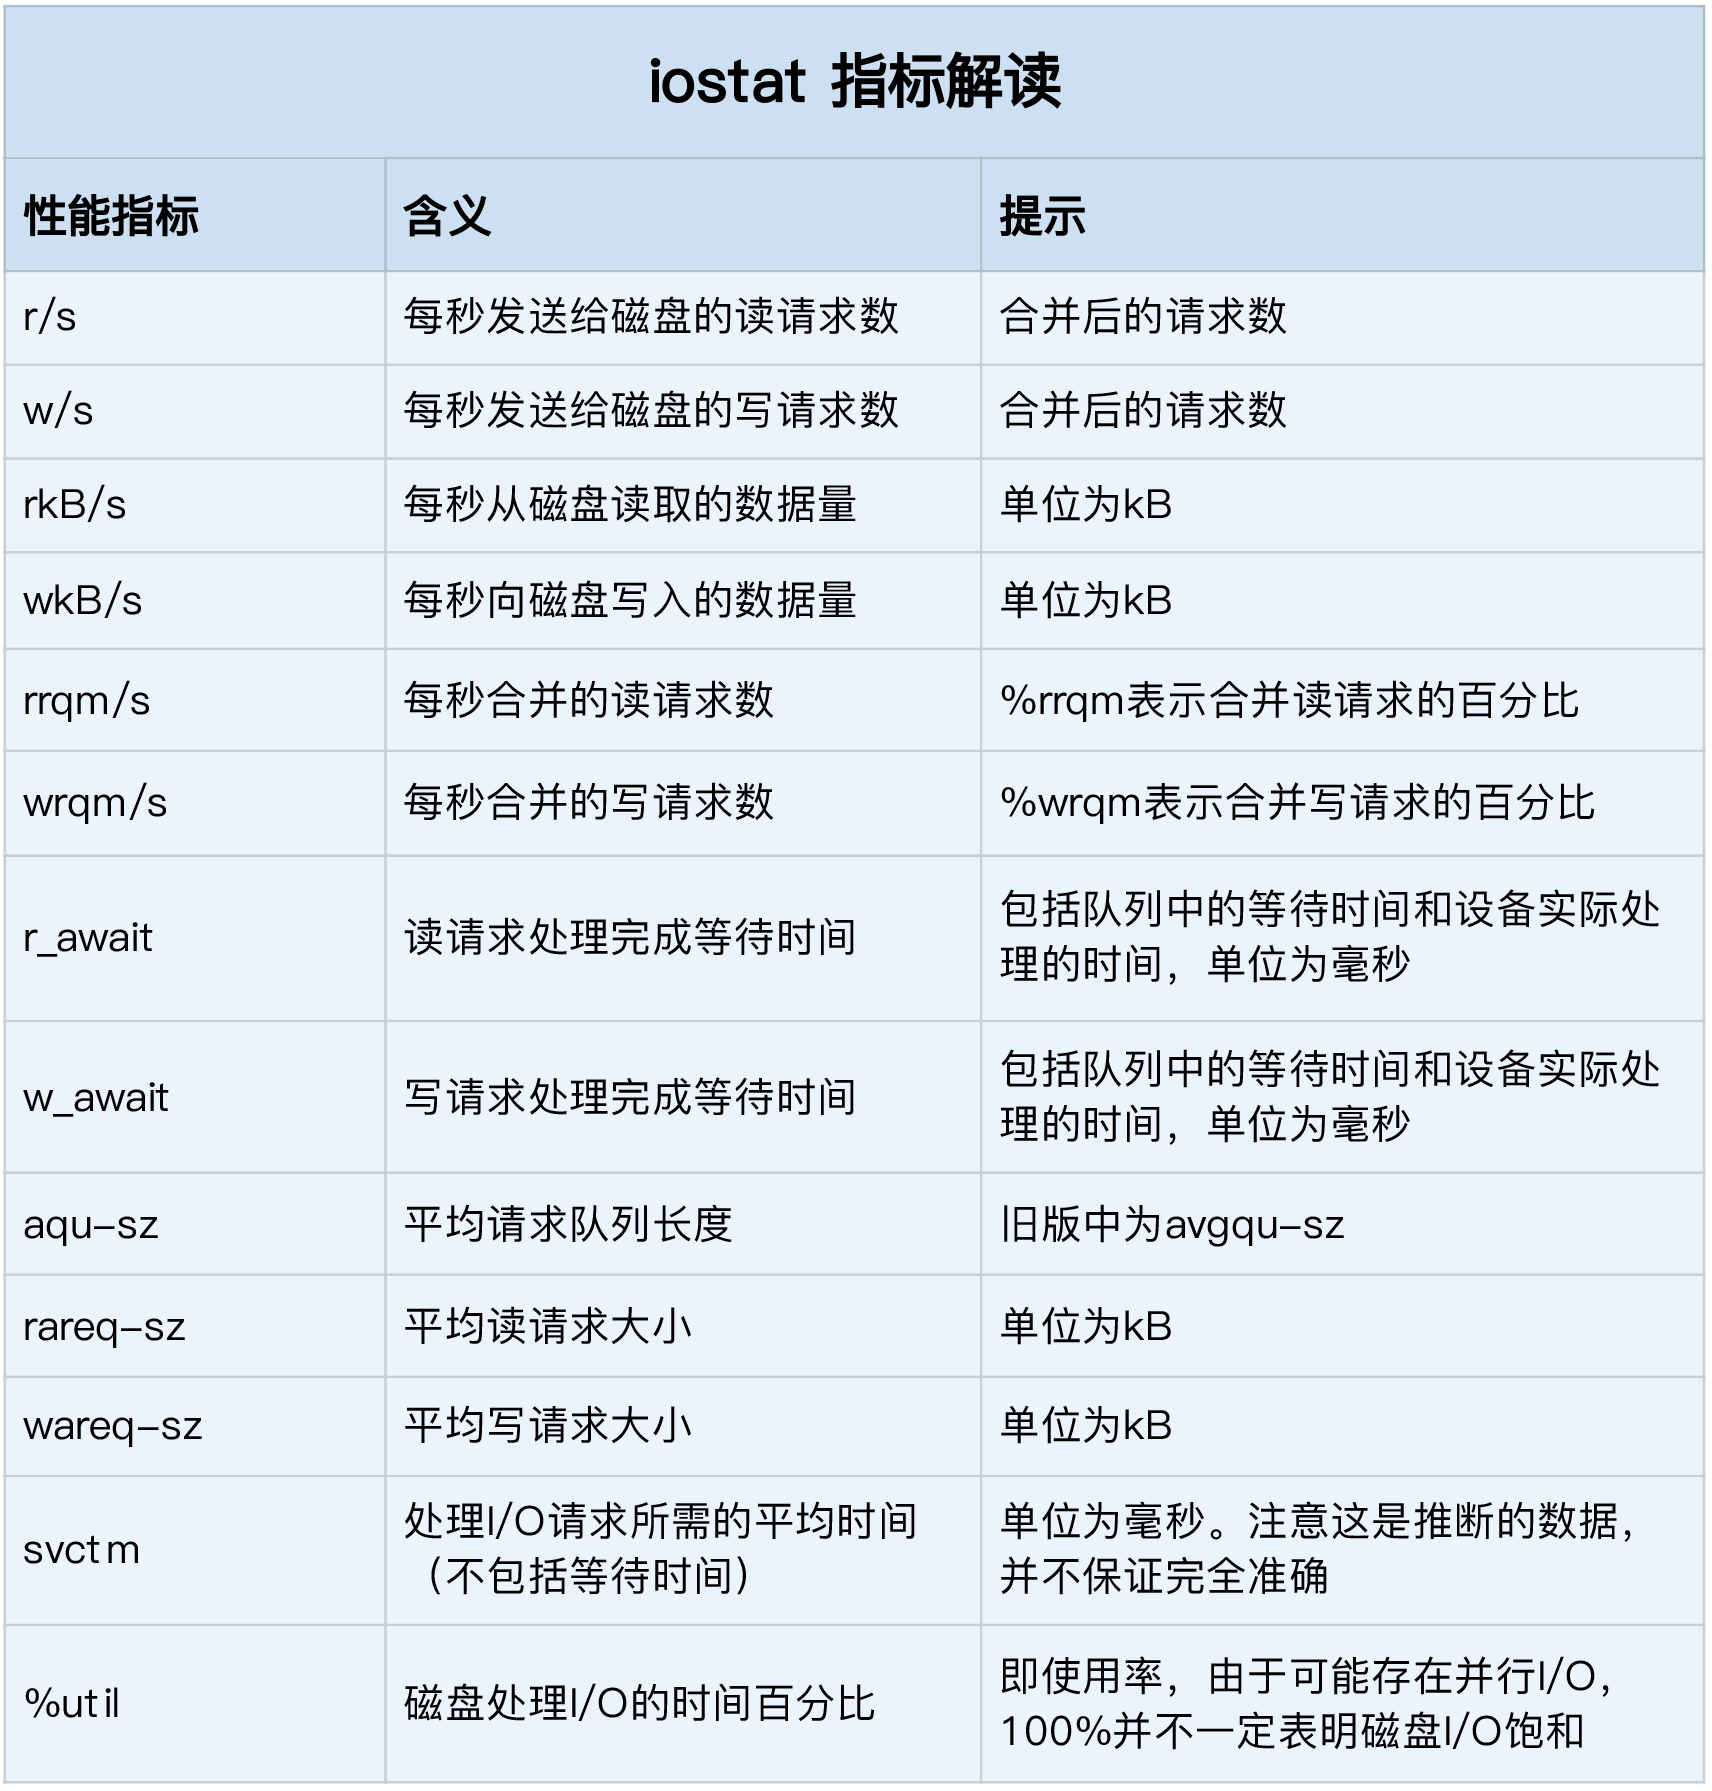
磁盘IO
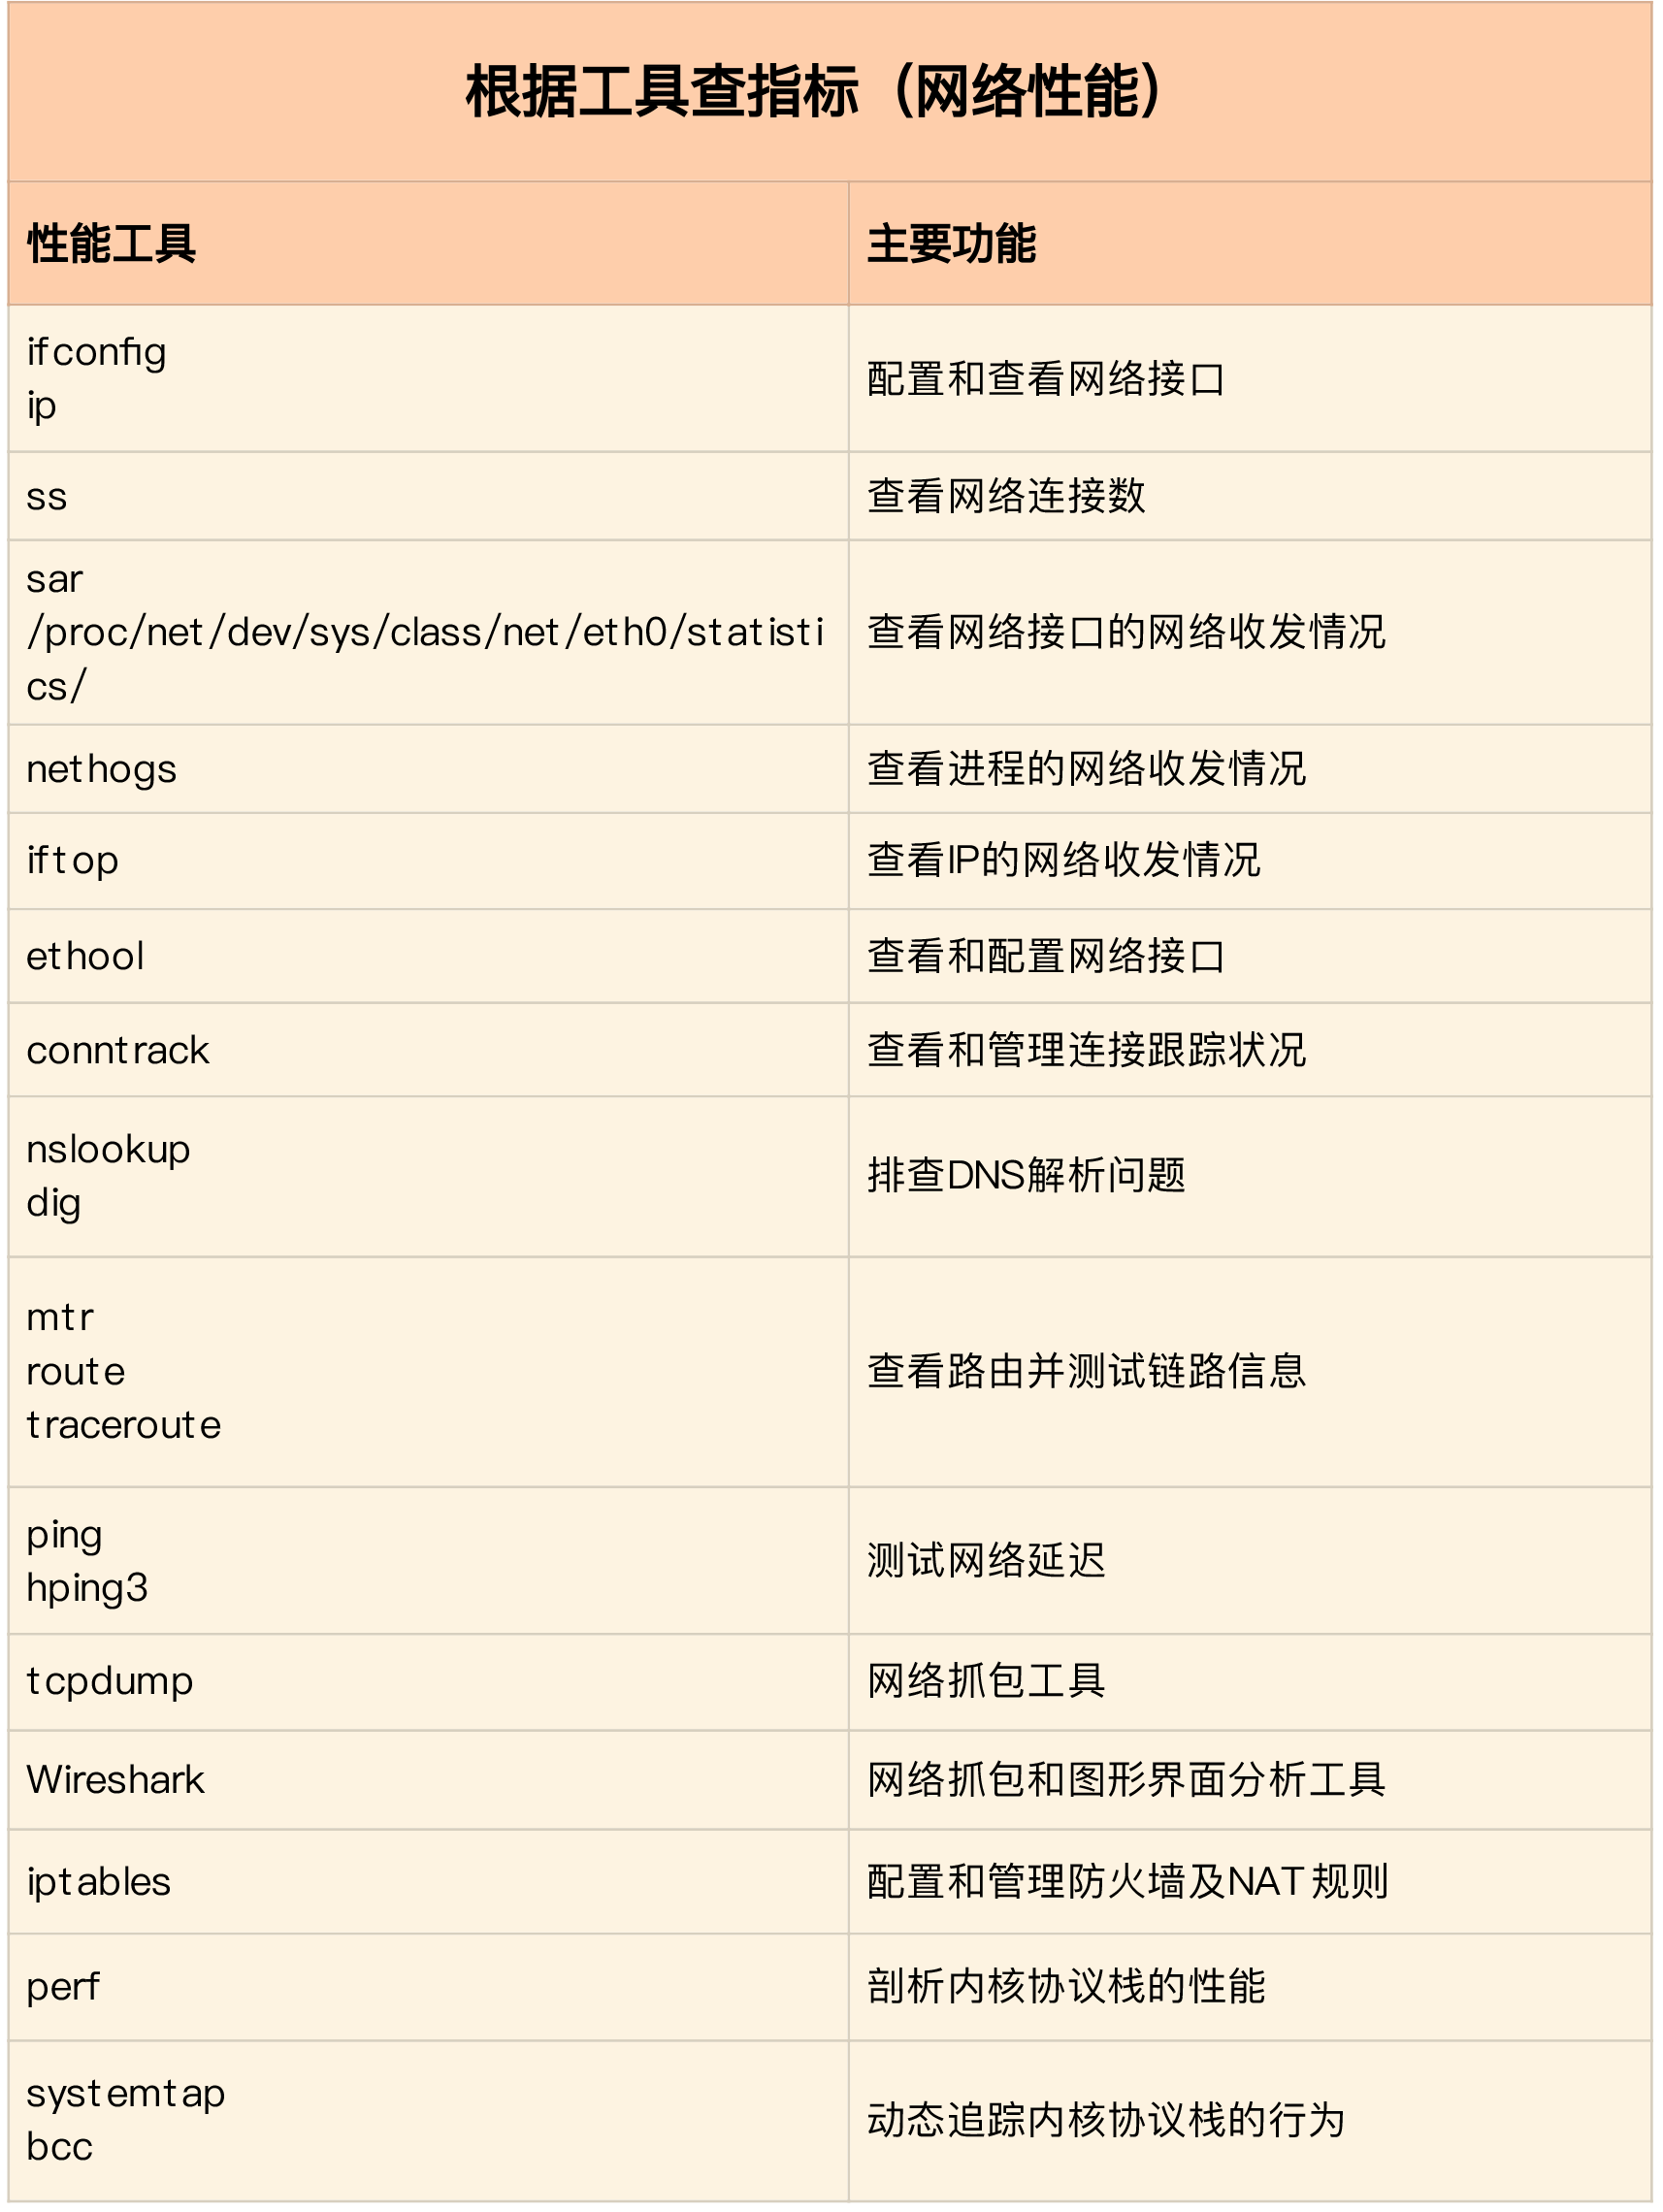
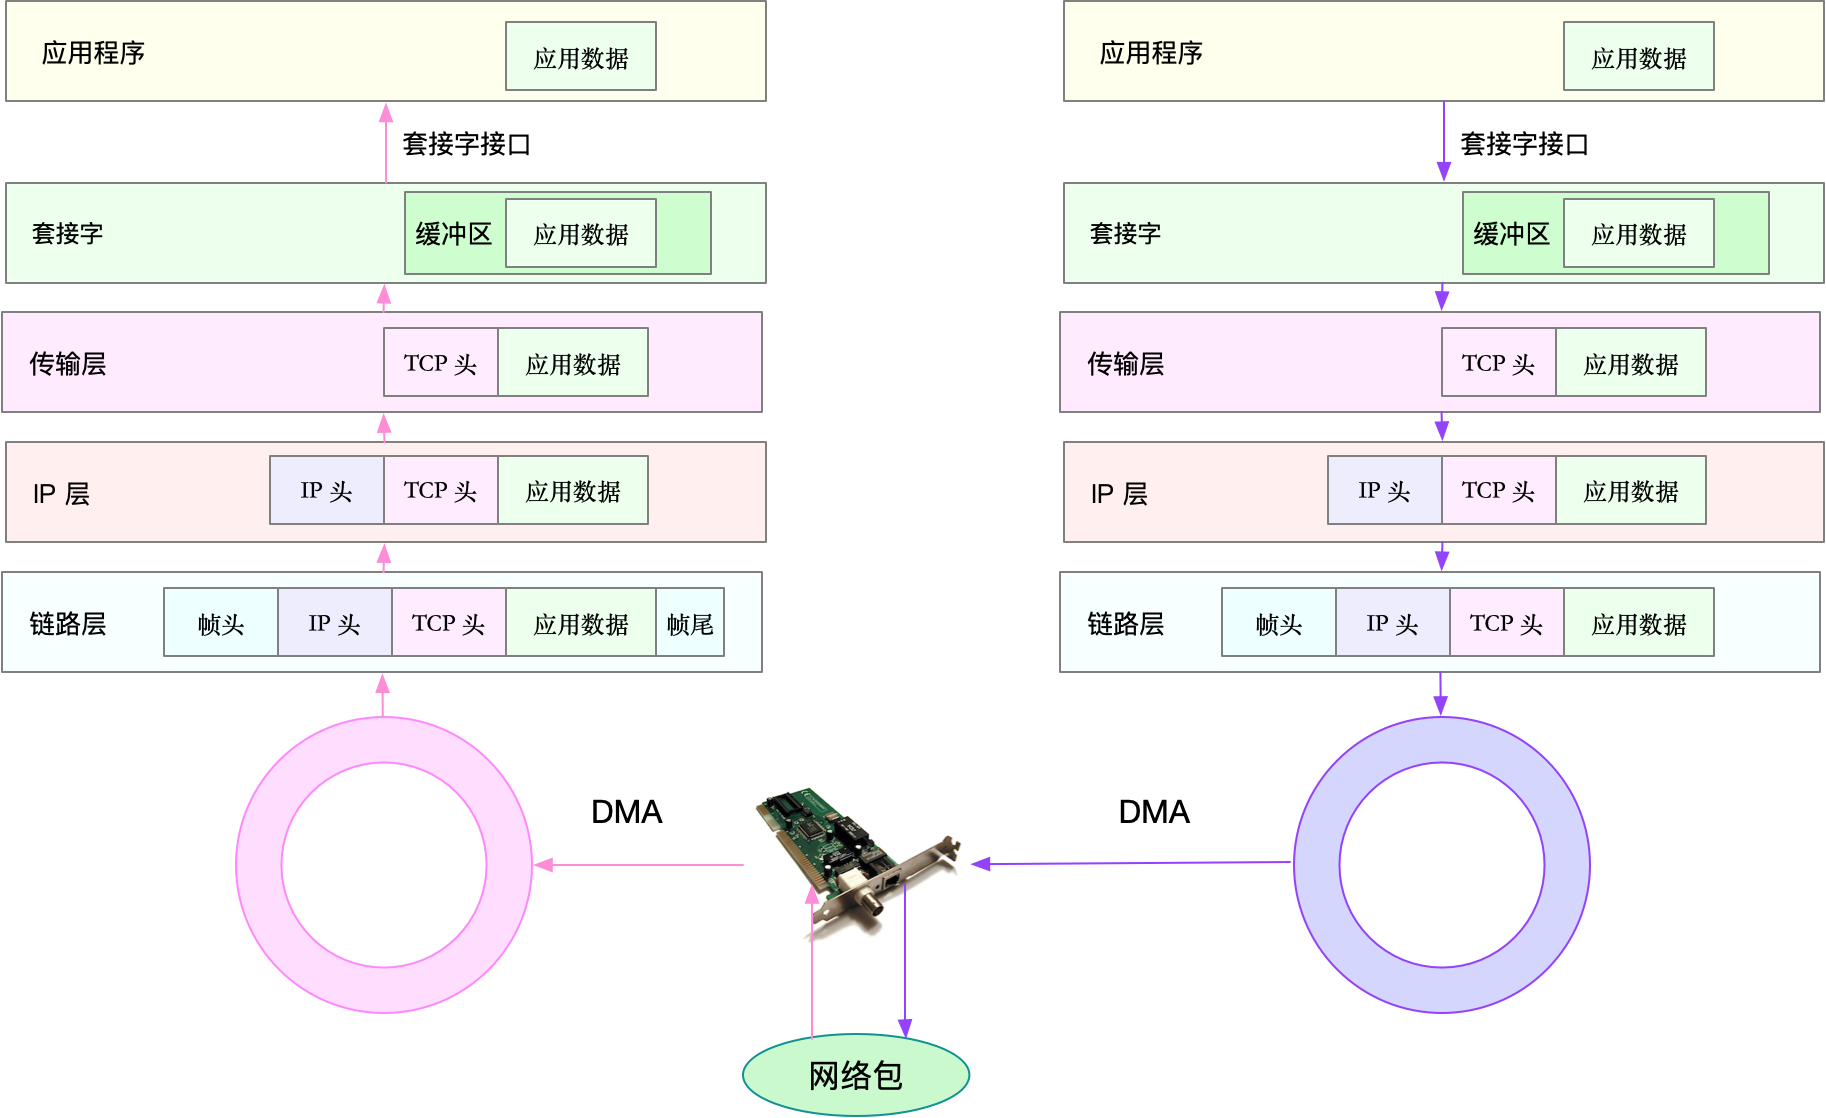
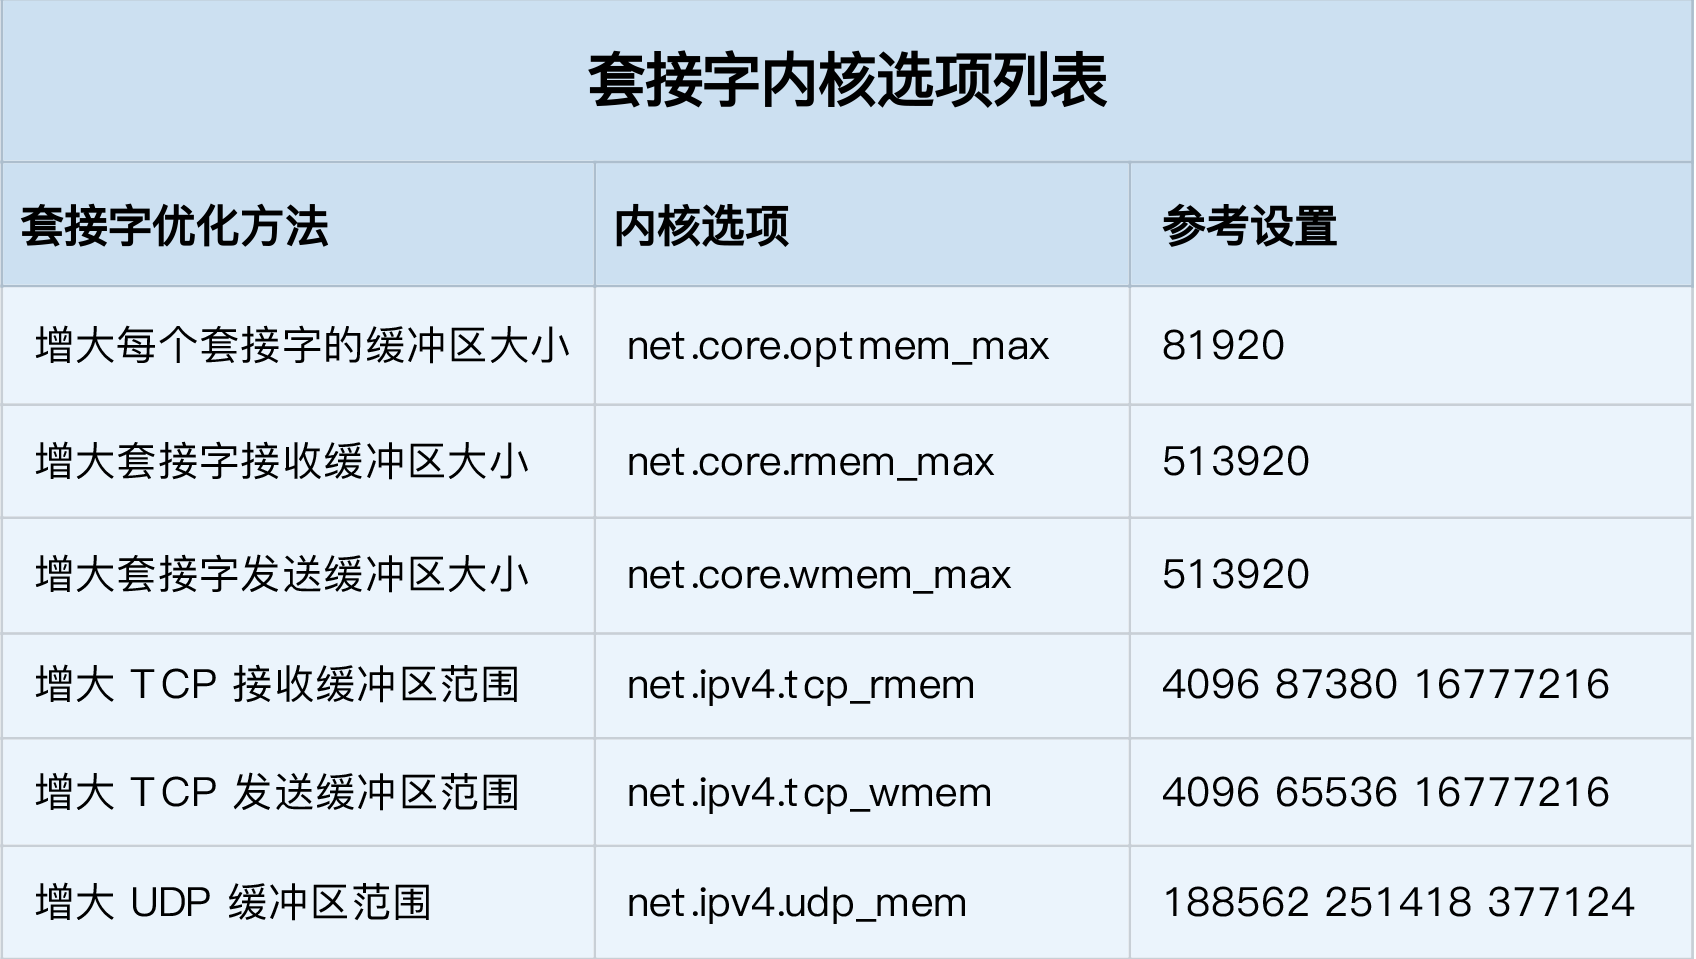
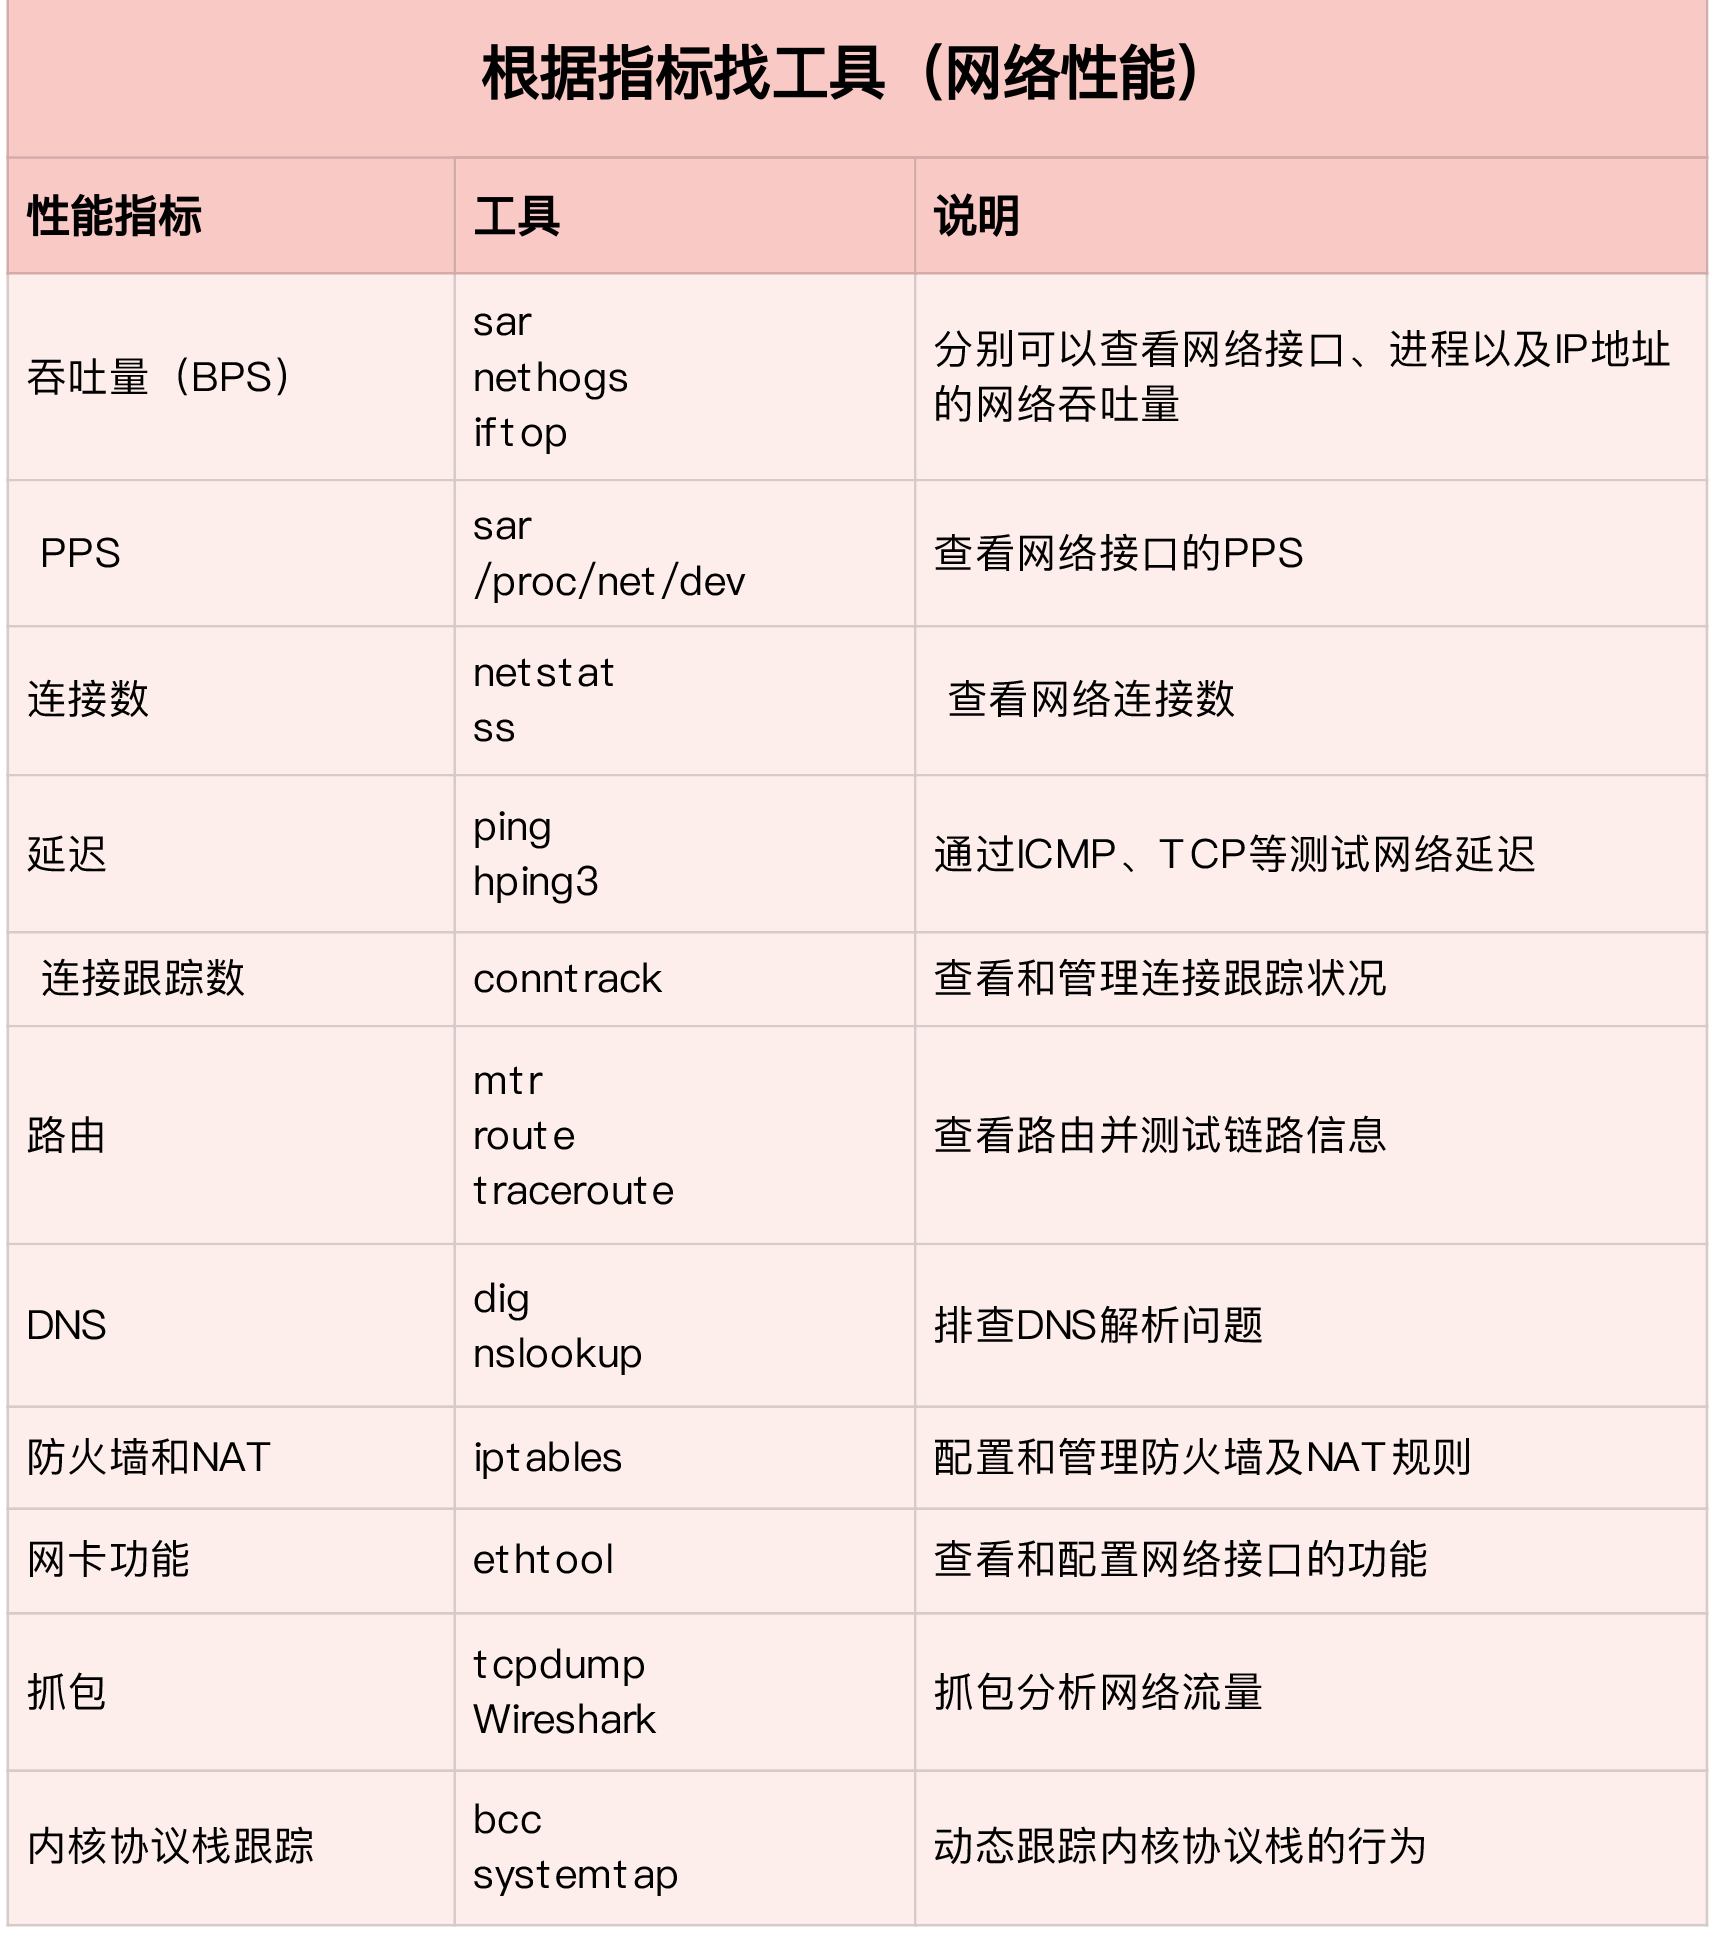
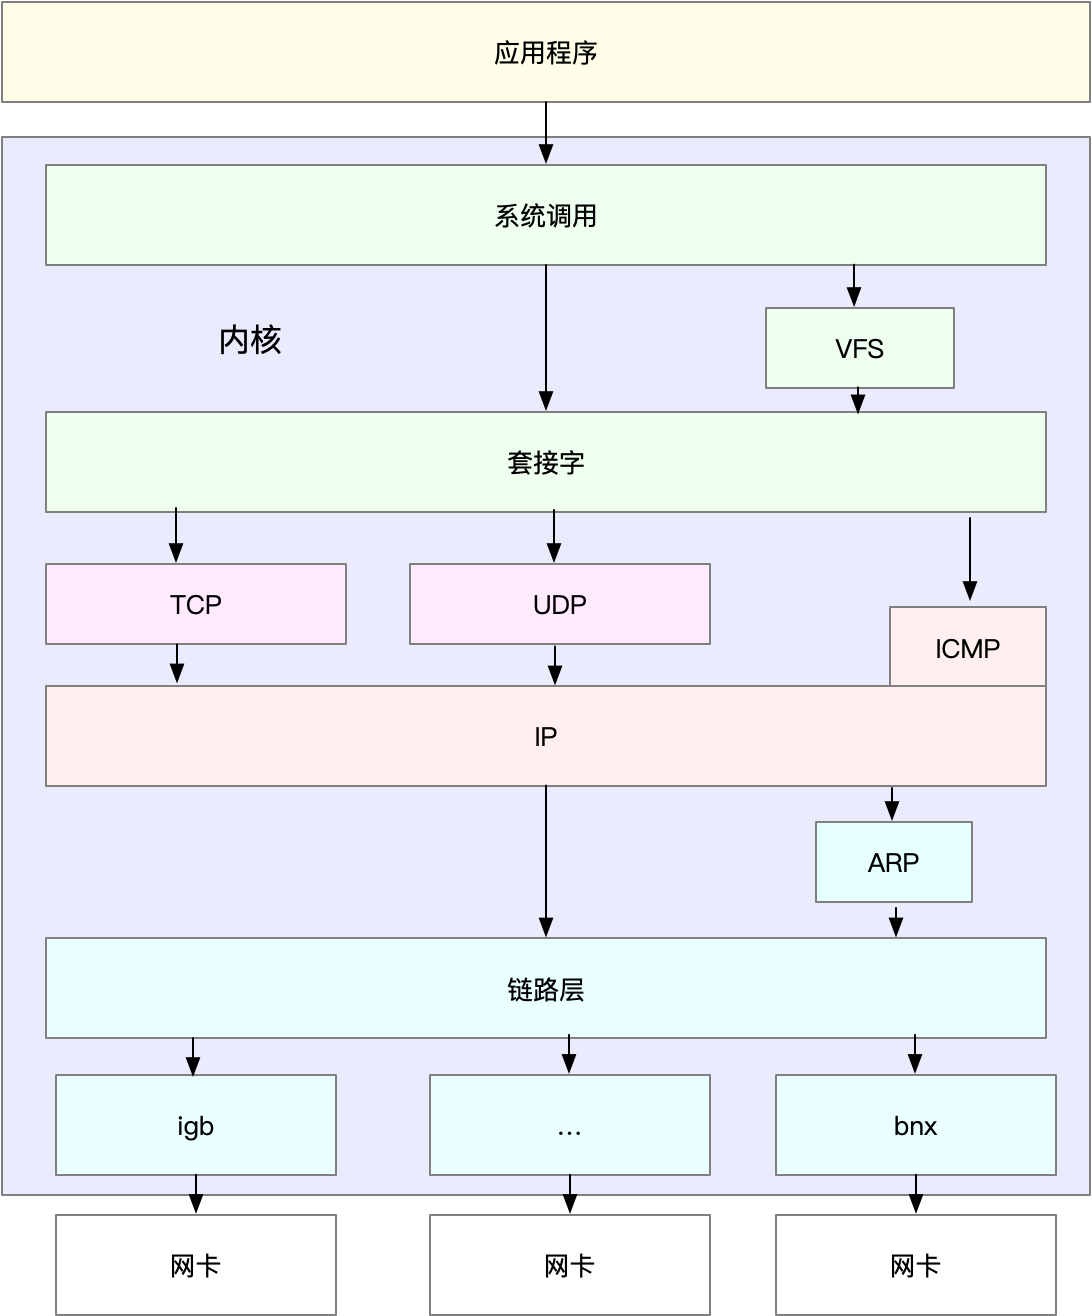
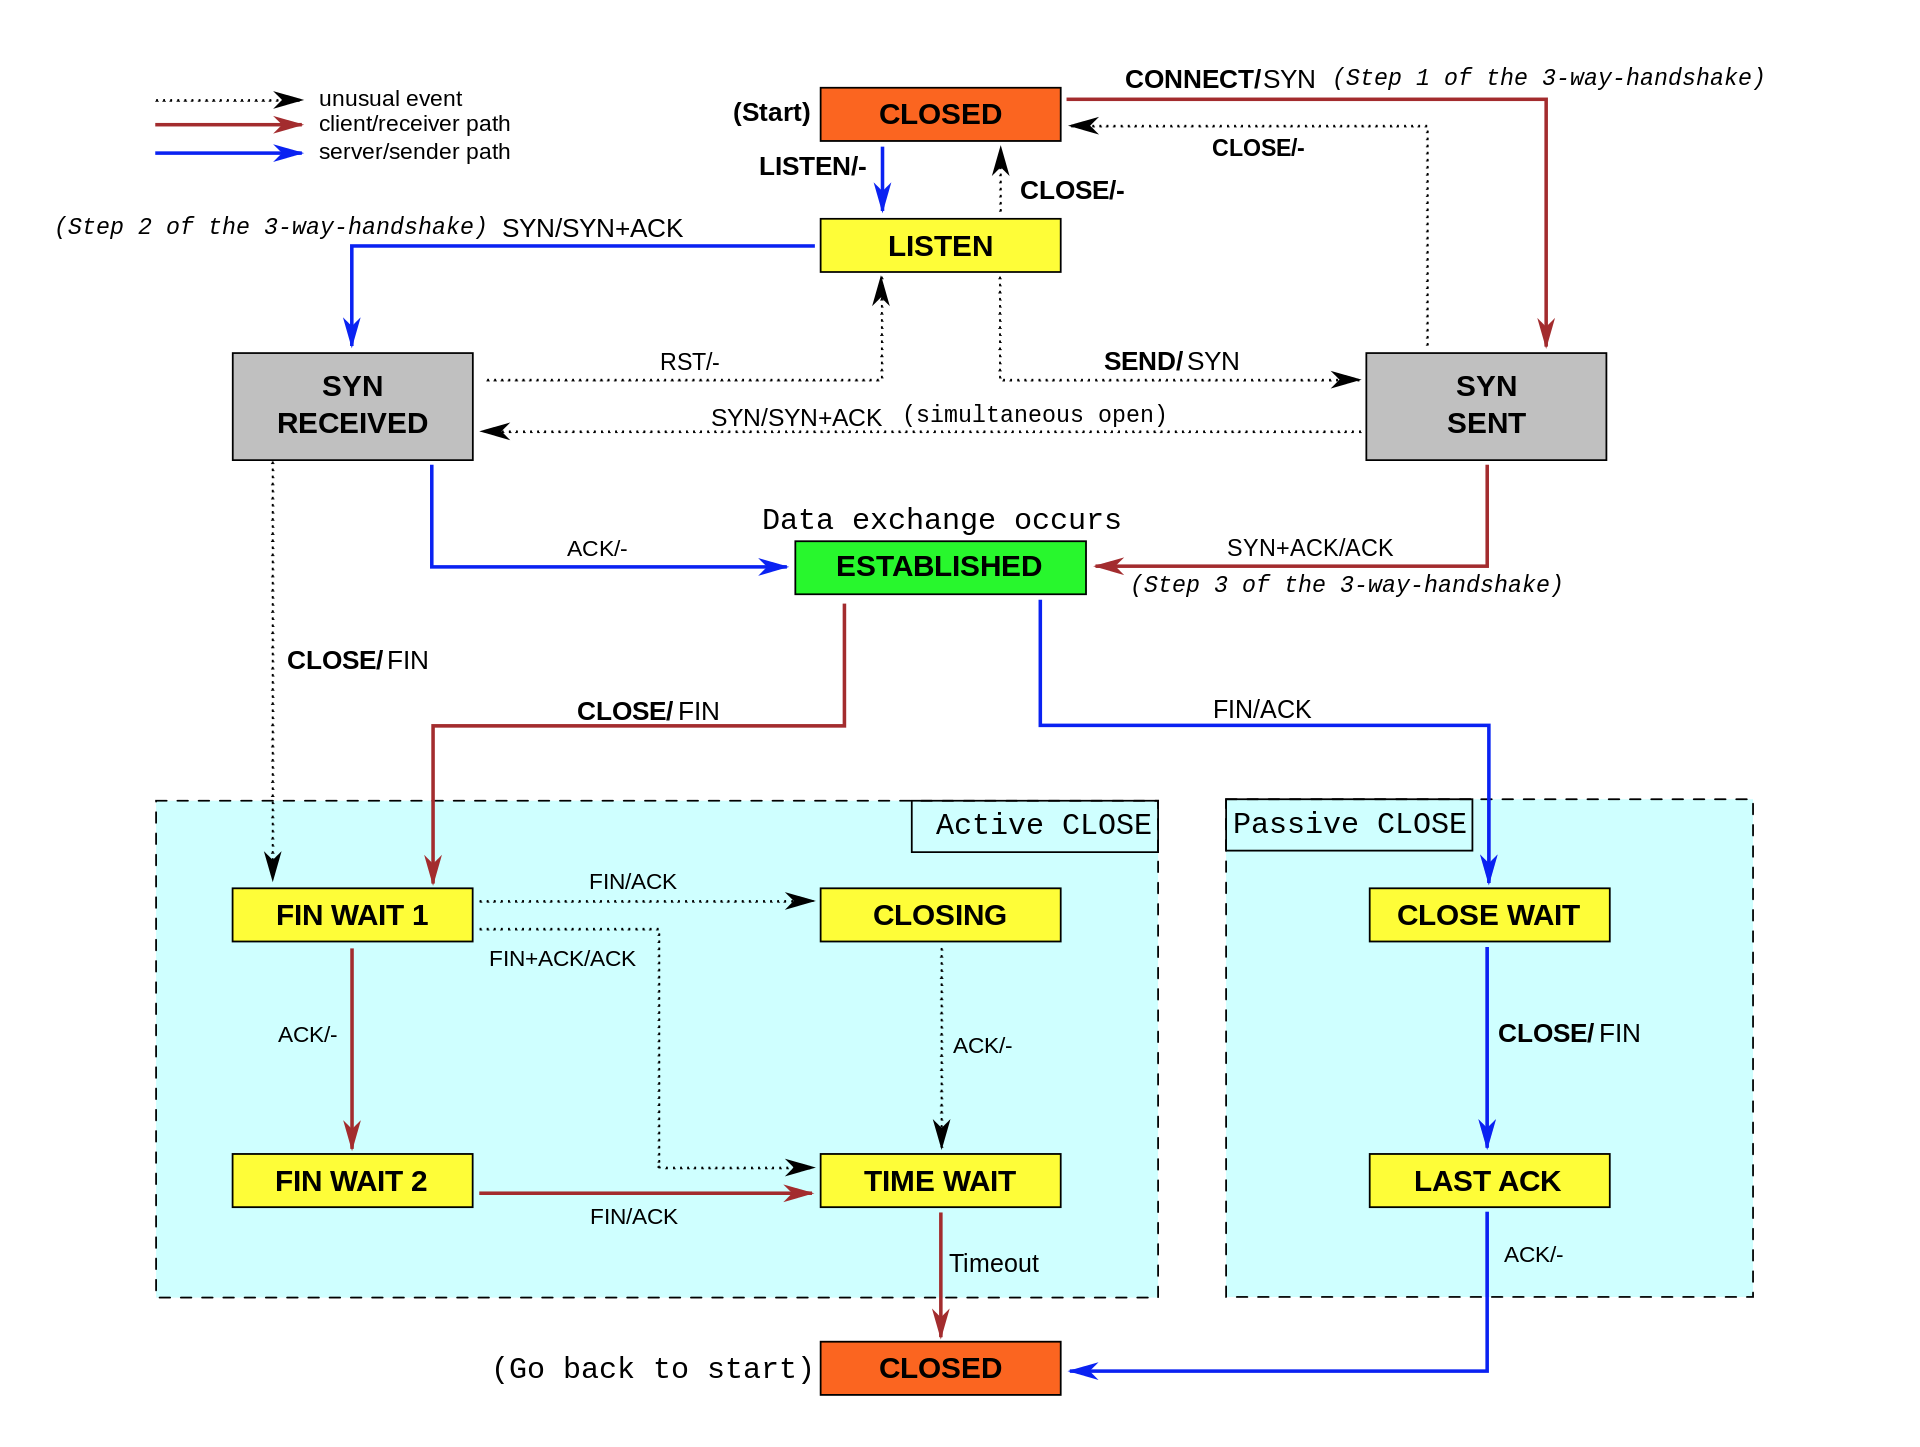
网络IO
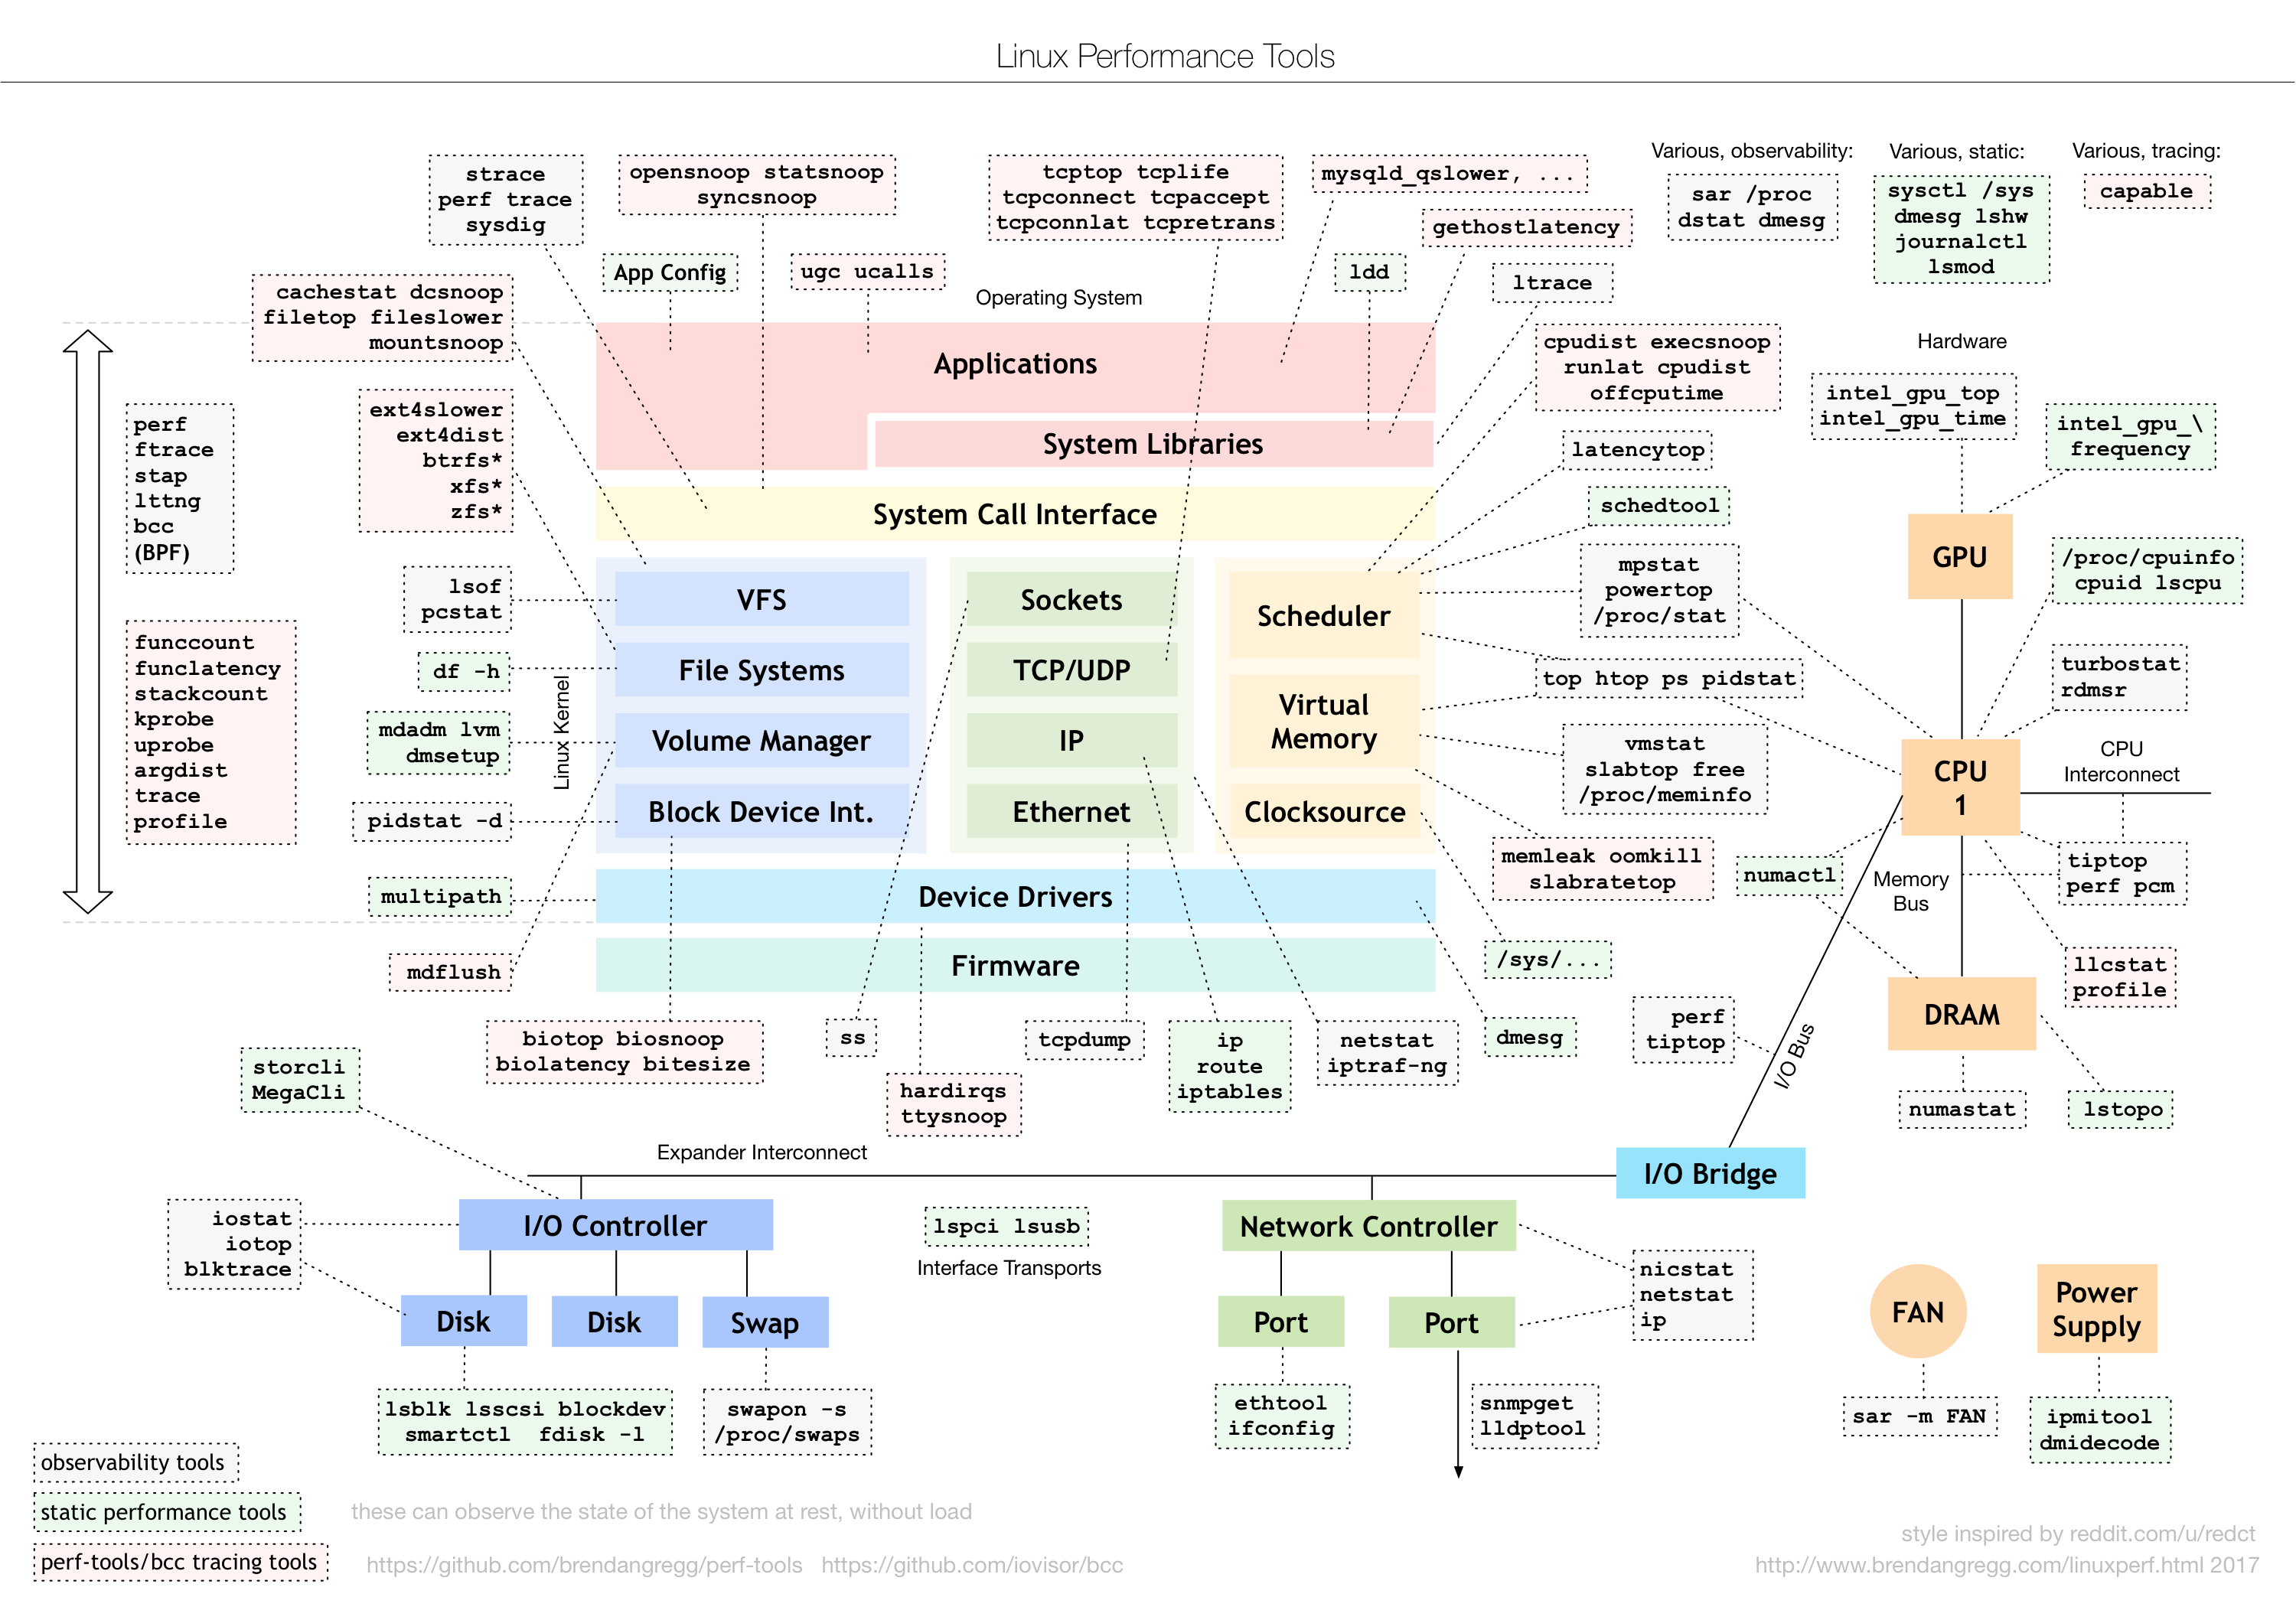
Linux 性能工具图谱
linux 性能优化
linux 知识地图

若有收获,就点个赞吧
0 人点赞
