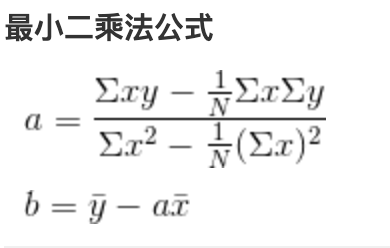
损失函数:(y_preduct - y_true) ** 2,用最小二乘法求解
import numpy as npfrom matplotlib import pyplot as pltx = np.array([1, 2, 3, 4, 5])y = np.array([1, 3, 2, 3, 5])plt.scatter(x, y)

y_meain = np.mean(y)x_mean = np.mean(x)a = np.dot((x - x_mean), (y - y_meain) / np.dot((x-x_mean), x-x_mean))b = y_meain - a * x_meany_preduct = x * a + bplt.scatter(x, y)plt.plot(x, y_preduct, color='r')

回归算法的评价
均方误差 MSE 因为存在量纲的问题 使用均方根误差 RMSE 平均绝对误差 MAE
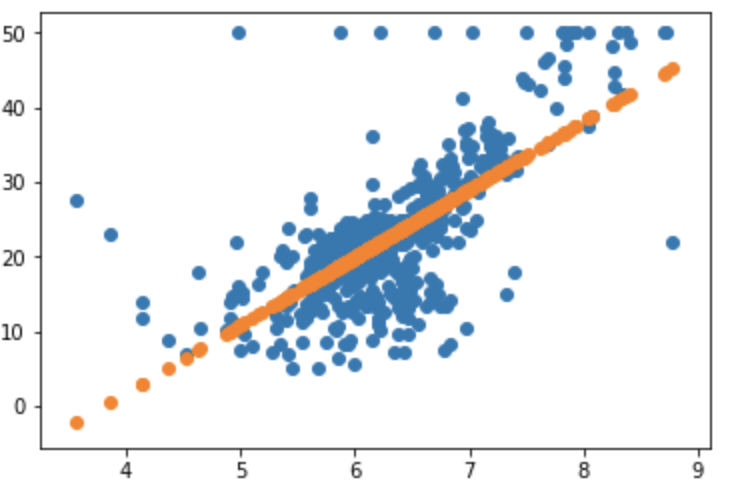
from sklearn import datasetsboston = datasets.load_boston()X = boston.data[:, [5]]plt.scatter(X, y)

line = LinearRegression()line.fit(X, y)y_prdict = line.predict(X)plt.scatter(X, y)plt.scatter(X, y_prdict)
MSE = sum((y_prdict - y) ** 2) / len(y)MSERMSE = np.sqrt(MSE)RMSEMAE = sum(np.absolute(y_prdict - y)) / len(y)MAE
机器学习中的MSE、MAE库
from sklearn.metrics import mean_squared_error, mean_absolute_errormean_squared_error(y_prdict, y)mean_absolute_error(y_prdict, y)
R**2

R = 1 - np.dot((y_prdict - y), (y_prdict - y)) / np.dot((np.mean(y) - y), (np.mean(y) - y))line.score(X, y)# sklear中的R**2from sklearn.metrics import r2_scorer2_score(y, y_prdict)
R 2 <= 1。
R2 越大越好,当我们训练的模型不犯任何错误的时候是 R2得到最大值。
当我们的模型等于基准模型时 R2 = 0。
如果R**2 < 0, 说明我们学习的模型还不如基准模型。此时很可能我们的数据不存在任何线性关系。
多项式回归—-损失函数求解方式:正规方程


若有收获,就点个赞吧
0 人点赞
