Terms
a disk sector 磁盘扇区
Disk sector
Ref: Wikepedia
The sector is the minimum storage unit of a hard drive. Most disk partitioning schemes are designed to have files occupy an integral number of sectors regardless of the file’s actual size. Files that do not fill a whole sector will have the remainder of their last sector filled with zeroes.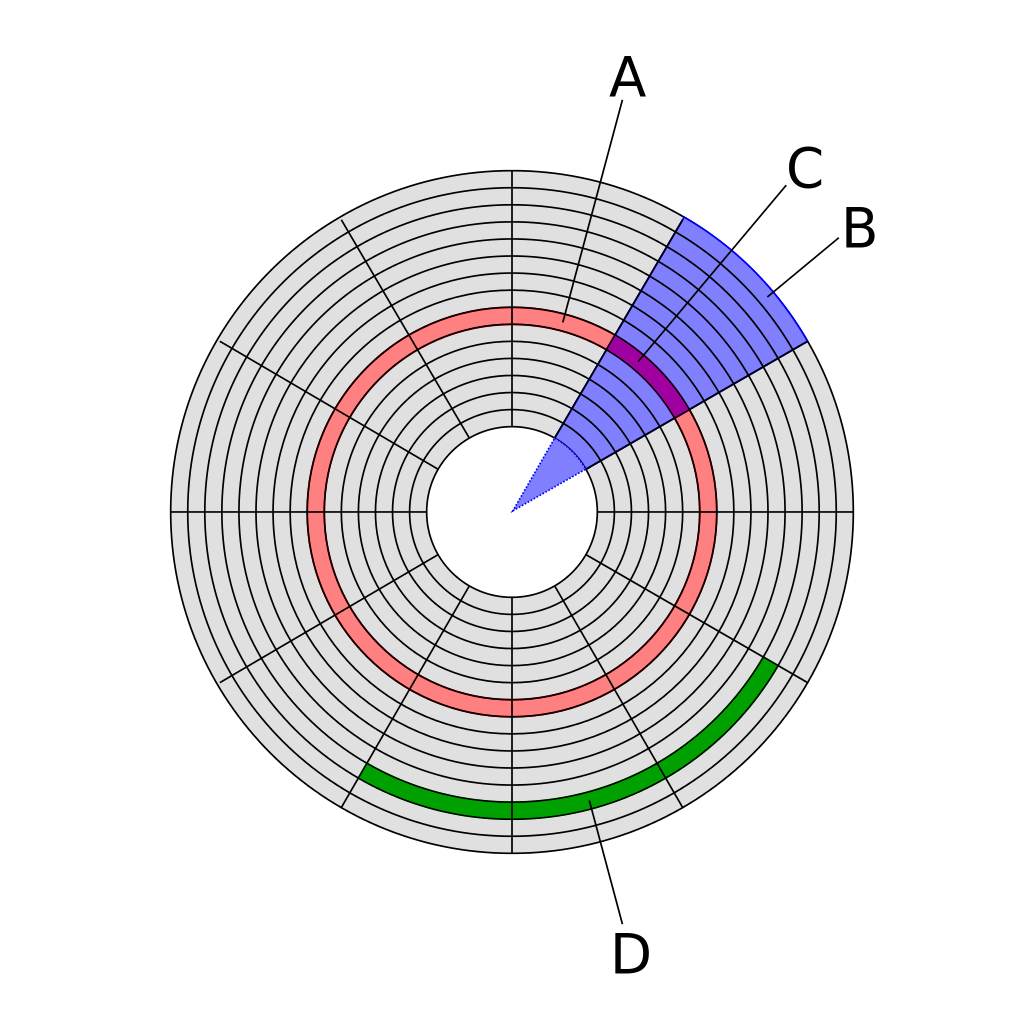
A: Track
B: Geometrical sector
C: Disk sector
D: Cluster
Supported sector sizes: 512, 1024, 2048, or 4096 bytes.
Take time
Ref: https://stackoverflow.com/a/12990780/8945448
Putting it all together, the total estimated access time isTaccess = Tavg seek + Tavg rotation + Tavg transfer= 9 ms + 4 ms + 0.02 ms= 13.02 ms
This example illustrates some important points:
- The time to access the 512 bytes in a disk sector is dominated by the seek time and the rotational latency. Accessing the first byte in the sector takes a long time, but the remaining bytes are essentially free.
- Since the seek time and rotational latency are roughly the same, twice the seek time is a simple and reasonable rule for estimating disk access time.
Of course, if the data being accessed was recently accessed, there’s a decent chance it’s cached somewhere in the memory heiarchy, in which case the access time is extremely small(practically, “near instant” when compared to disk access time).
2) And more specifically, what is the difference between performance for accessing a specific index in a file? Is this a constant time operation? Or does it depend on how “far down” the index is?
Another seek + rotation amount of time may occur if the seeked location isnt stored sequentially nearby. It depends where in the file you’re seeking, and where that data is physically stored on the disk. For example, fragmented files are guaranteed to cause disk seeks to read the entire file.
Something to keep in mind is that even though you may only request to read a few bytes, the physical reads tend to occur in multiples of a fixed size chunks(the sector size), which ends up in cache. So you may later do a seek to some nearby location in the file, and get lucky that its already in cache for you.
Btw- The full chapter in that book on the memory hierarchy is pure gold, if you’re interested in the subject.
IOPS
Ref: https://scoutapm.com/blog/understanding-disk-i-o-when-should-you-be-worried
IO Wait
For example, lets say it takes 1 second to grab 10,000 rows from MySQL and perform some operations on those rows.
The disk is being accessed while the rows are retrieved. During this time the processor is idle. It’s waiting on the disk. In the example above, disk access took 700 ms, so I/O wait is 70%.
You can check your I/O wait percentage via top, a command available on every flavor of Linux.
If your I/O wait percentage is greater than (1/# of CPU cores) then your CPUs are waiting a significant amount of time for the disk subsystem to catch up.
In the output above, I/O wait is 12.1%. This server has 8 cores (via cat /proc/cpuinfo). This is very close to (1/8 cores = 0.125). Disk access may be slowing the application down if I/O wait is consistently around this threshold.
IOPS
For random disk access (a database, mail server, file server, etc), you should focus on how many input/output operations can be performed per-second (IOPS).
Four primary factors impact IOPS:
- Multidisk Arrays – More disks in the array mean greater IOPS. If one disk can perform 150 IOPS, two disks can perform 300 IOPS.
- Average IOPS per-drive – The greater the number of IOPS each drive can handle, the greater the the total IOPS capacity. This is largely determined by the rotational speed of the drive.
- RAID Factor – Your application is likely using a RAID configuration for storage, which means you’re using multiple disks for reliability and redundancy. Some RAID configurations have a significant penalty for write operations. For RAID 6, every write request requires 6 disk operations. For RAID 1 and RAID 10, a write request requires only 2 disk operations. The lower the number of disk operations, the higher the IOPS capacity. This article has a great breakdown on RAID and IOPS performance.
- Read and Write Workload – If you have a high percentage of write operations and a RAID setup that performs many operations for each write request (like RAID 5 or RAID 6), your IOPS will be significantly lower.
You can determine theoretical IOPS via the the following equation:
| I/O Operations Per-Sec = | number of disks * Average I/O Operations on 1 disk per-sec |
|---|---|
| % of read workload + (Raid Factor * % of write workload) |
Fix an IO bottleneck
- Disk access is slooowww – Disk access speeds do not come close to approaching RAM.
- Optimize your apps first – Tuning your disk hardware isn’t trivial or likely to be a quick fix. Try to have your I/O-heavy services read more data from a RAM cache first.
- Measure – Modifications to your application can have a big impact on Disk I/O. Record the key I/O metrics over time.
More servers? Or faster code?
IOPS with RIAD
https://www.techrepublic.com/article/calculate-iops-in-a-storage-array/

若有收获,就点个赞吧
0 人点赞
