概述
pprof 是用于可视化和分析性能分析数据的工具CPU Profiling:CPU 分析,按照一定的频率采集所监听的应用程序 CPU(含寄存器)的使用情况,可确定应用程序在主动消耗 CPU 周期时花费时间的位置Memory Profiling:内存分析,在应用程序进行堆分配时记录堆栈跟踪,用于监视当前和历史内存使用情况,以及检查内存泄漏Block Profiling:阻塞分析,记录 goroutine 阻塞等待同步(包括定时器通道)的位置Mutex Profiling:互斥锁分析,报告互斥锁的竞争情况。
Go语言内置了获取程序的运行数据的工具,包括以下两个标准库:
runtime/pprof:采集工具型应用运行数据进行分析net/http/pprof:采集web应用运行时数据进行分析
注意:获取的 Profiling 数据是动态的,要想获得有效的数据,请保证应用处于较大的负载(比如正在生成中运行的服务,或者通过其他工具模拟访问压力)。否则如果应用处于空闲状态,得到的结果可能没有任何意义。
runtime/pprof
CUP分析
开启CPU性能分析:
pprof.StartCPUProfile(file)
停止CPU性能分析
pprof.StopCPUProfile()
应用执行结束后,就会生成一个文件,保存了我们的 CPU profiling 数据。得到采样数据之后,使用go tool pprof工具进行CPU性能分析。
内存分析
记录程序的堆栈信息
pprof.WriteHeapProfile(file)
net/http/pprof
安装graphviz
https://graphviz.gitlab.io/download/
mac 推荐使用brew
brew install graphviz
Linux安装
# Ubuntusudo apt-get install graphviz# Centosyum install graphviz
检查是否安装成功
dot -version
package mainimport ("net/http""log"_ "net/http/pprof")func main() {http.HandleFunc("/hello", func(writer http.ResponseWriter, request *http.Request) {writer.Write([]byte("hello world"))})log.Fatal(http.ListenAndServe(":8080", nil))}
执行下面的命令 开启服务,监听8080
go run main.go
打开监控界面 http://localhost:8080/debug/pprof/,或者使用下面单独接口
cpu(CPU Profiling): HOST/debug/pprof/profile,默认进行 30s 的 CPU Profiling,得到一个分析用的 profile 文件
block(Block Profiling):HOST/debug/pprof/block,查看导致阻塞同步的堆栈跟踪
goroutine:HOST/debug/pprof/goroutine,查看当前所有运行的 goroutines 堆栈跟踪
heap(Memory Profiling): HOST/debug/pprof/heap,查看活动对象的内存分配情况
mutex(Mutex Profiling):HOST/debug/pprof/mutex,查看导致互斥锁的竞争持有者的堆栈跟踪
threadcreate:HOST/debug/pprof/threadcreate,查看创建新OS线程的堆栈跟踪

allocs:所有过去内存分配的采样
block:导致同步原语阻塞的堆栈跟踪
cmdline:当前程序的命令行调用
goroutine:所有当前goroutine的堆栈跟踪
heap:活动对象的内存分配的采样。在获取堆样本之前,可以指定gc GET参数来运行gc。
metux:争用互斥锁持有者的堆栈跟踪
profile:CPU配置文件。您可以在seconds GET参数中指定持续时间。获取配置文件后,使用go tool pprof命令调查配置文件
threadcreate:导致创建新操作系统线程的堆栈跟踪
trace:当前程序的执行轨迹。您可以在seconds GET参数中指定持续时间。获取跟踪文件后,使用go tool trace命令调查跟踪
go tool命令
不管是工具型应用还是服务型应用,我们使用相应的pprof库获取数据之后,下一步的都要对这些数据进行分析,我们可以使用go tool pprof命令行工具。
pprof
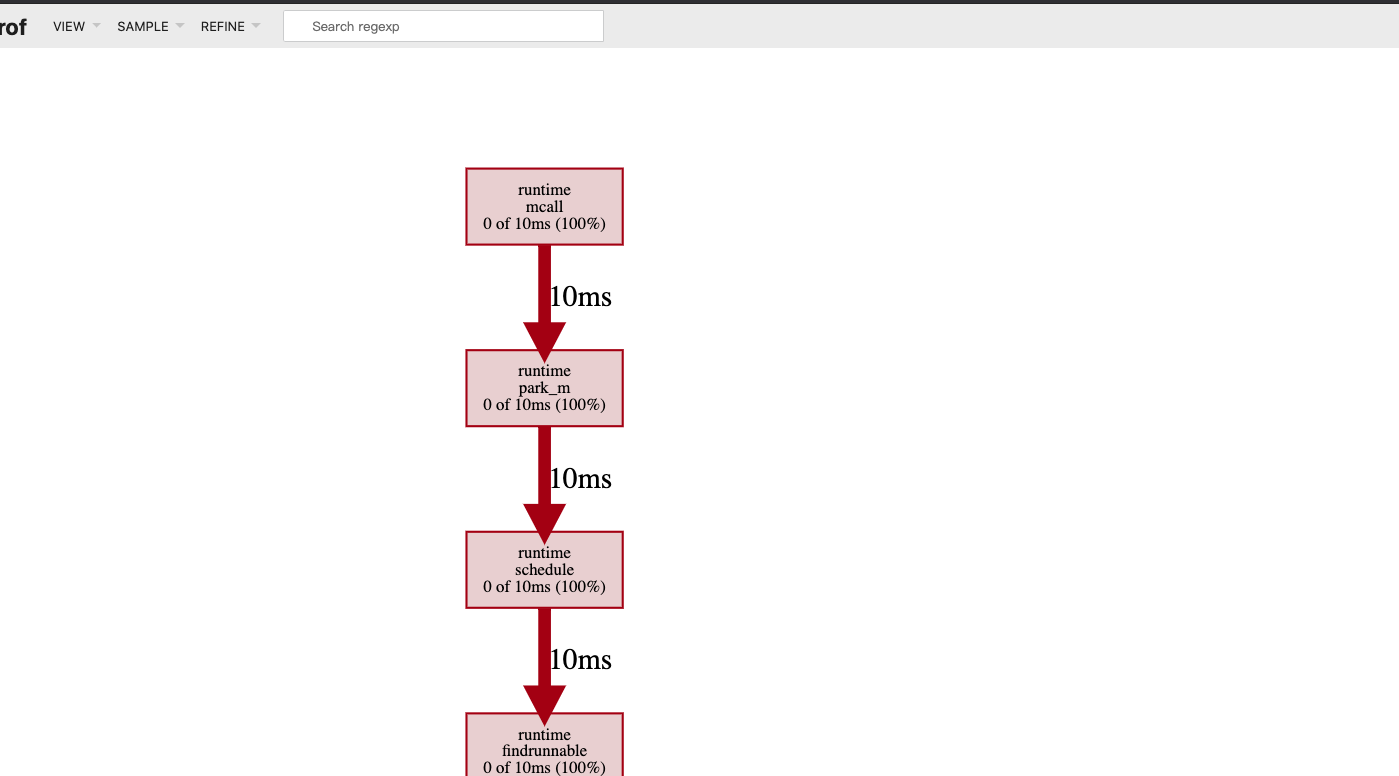
go tool pprof profile文件名, 此时会进入一个交互式控制台,输入命令 web会产生一个svg文件,程序回启动浏览器自动打开这个文件,即可进入可视化界面。我们也可以在上面CPU分析中的控制台中以同样的方式进入可视化界面。
go tool pprof http://localhost:8080/debug/pprof/profile\?seconds\=60Fetching profile over HTTP from http://localhost:8080/debug/pprof/profile?seconds=60Saved profile in /Users/baxiang/pprof/pprof.samples.cpu.001.pb.gzType: cpuTime: Apr 3, 2019 at 12:20am (CST)Duration: 1mins, Total samples = 1.08mins (107.69%)Entering interactive mode (type "help" for commands, "o" for options)(pprof) top10Showing nodes accounting for 61.29s, 94.69% of 64.73s totalDropped 55 nodes (cum <= 0.32s)Showing top 10 nodes out of 43flat flat% sum% cum cum%20.93s 32.33% 32.33% 21.72s 33.55% runtime.bulkBarrierPreWrite10.35s 15.99% 48.32% 10.35s 15.99% runtime.memclrNoHeapPointers8.58s 13.26% 61.58% 8.58s 13.26% runtime.usleep8.02s 12.39% 73.97% 8.82s 13.63% runtime.scanobject6.19s 9.56% 83.53% 6.19s 9.56% runtime.memmove3.60s 5.56% 89.09% 44.64s 68.96% main.main.func11.39s 2.15% 91.24% 1.39s 2.15% runtime.mach_semaphore_timedwait1.07s 1.65% 92.89% 3.02s 4.67% runtime.notetsleep0.59s 0.91% 93.81% 0.59s 0.91% runtime.heapBits.bits (inline)0.57s 0.88% 94.69% 0.61s 0.94% runtime.heapBitsSetType(pprof)
go tool pprof -http=:8080 profile文件名 ,此时浏览器会默认打开localhost:8080访问 ,建议使用这种方式,获取更好体验。
$ go tool pprof -http=:8090 profile
go tool trace
火焰图
已经集成到go tool
下载安装:
go get -u github.com/google/pprof
go-torch
go-torch是urbe开源的,现在这个项目已经废弃不维护了 直接建议使用pprof
ginpprof
https://github.com/gin-contrib/pprof
使用 https://github.com/DeanThompson/ginpprof
package mainimport ("github.com/gin-gonic/gin""github.com/DeanThompson/ginpprof")func main() {router := gin.Default()router.GET("/ping", func(c *gin.Context) {c.JSON(200,gin.H{"data":"ping"})})ginpprof.Wrap(router)router.Run(":8080")}
运行
$ go run main.go[GIN-debug] [WARNING] Creating an Engine instance with the Logger and Recovery middleware already attached.[GIN-debug] [WARNING] Running in "debug" mode. Switch to "release" mode in production.- using env: export GIN_MODE=release- using code: gin.SetMode(gin.ReleaseMode)[GIN-debug] GET /ping --> main.main.func1 (3 handlers)[GIN-debug] GET /debug/pprof/ --> github.com/DeanThompson/ginpprof.IndexHandler.func1 (3 handlers)[GIN-debug] GET /debug/pprof/heap --> github.com/DeanThompson/ginpprof.HeapHandler.func1 (3 handlers)[GIN-debug] GET /debug/pprof/goroutine --> github.com/DeanThompson/ginpprof.GoroutineHandler.func1 (3 handlers)[GIN-debug] GET /debug/pprof/allocs --> github.com/DeanThompson/ginpprof.AllocsHandler.func1 (3 handlers)[GIN-debug] GET /debug/pprof/block --> github.com/DeanThompson/ginpprof.BlockHandler.func1 (3 handlers)[GIN-debug] GET /debug/pprof/threadcreate --> github.com/DeanThompson/ginpprof.ThreadCreateHandler.func1 (3 handlers)[GIN-debug] GET /debug/pprof/cmdline --> github.com/DeanThompson/ginpprof.CmdlineHandler.func1 (3 handlers)[GIN-debug] GET /debug/pprof/profile --> github.com/DeanThompson/ginpprof.ProfileHandler.func1 (3 handlers)[GIN-debug] GET /debug/pprof/symbol --> github.com/DeanThompson/ginpprof.SymbolHandler.func1 (3 handlers)[GIN-debug] POST /debug/pprof/symbol --> github.com/DeanThompson/ginpprof.SymbolHandler.func1 (3 handlers)[GIN-debug] GET /debug/pprof/trace --> github.com/DeanThompson/ginpprof.TraceHandler.func1 (3 handlers)[GIN-debug] GET /debug/pprof/mutex --> github.com/DeanThompson/ginpprof.MutexHandler.func1 (3 handlers)
执行 http://127.0.0.1:8080/debug/pprof/
go-wrk
安装go-wrk 进入到GOPATH/src/github
$ cd $GOPATH/src/github.com$ mkdir tsliwowicz$ cd tsliwowicz$ git clone https://github.com/tsliwowicz/go-wrk.git$ cd go-wrk$ go install go-wrk.go
go-wrk常用命令
$ go-wrk -helpUsage: go-wrk <options> <url>Options:-H header line, joined with ';' (Default )-M HTTP method (Default GET)-T Socket/request timeout in ms (Default 1000)-body request body string or @filename (Default )-c Number of goroutines to use (concurrent connections) (Default 10)-ca CA file to verify peer against (SSL/TLS) (Default )-cert CA certificate file to verify peer against (SSL/TLS) (Default )-d Duration of test in seconds (Default 10)-f Playback file name (Default <empty>)-help Print help (Default false)-host Host Header (Default )-http Use HTTP/2 (Default true)-key Private key file name (SSL/TLS (Default )-no-c Disable Compression - Prevents sending the "Accept-Encoding: gzip" header (Default false)-no-ka Disable KeepAlive - prevents re-use of TCP connections between different HTTP requests (Default false)-redir Allow Redirects (Default false)-v Print version details (Default false)
测试,开启50并发 5秒 查看请求结果性能
$ go-wrk -c 50 -d 5 http://127.0.0.1:8080/pingRunning 5s test @ http://127.0.0.1:8080/ping50 goroutine(s) running concurrently16436 requests in 5.000469347s, 1.91MB readRequests/sec: 3286.89Transfer/sec: 391.60KBAvg Req Time: 15.211941msFastest Request: 165.578µsSlowest Request: 432.370243msNumber of Errors: 0
参考文章
Golang 大杀器之性能剖析 PProf
深度解密Go语言之pprof
https://www.jianshu.com/p/9c6e4cc94dda

若有收获,就点个赞吧
0 人点赞
