- 1 segmentation fault段错误
- 2 backtrace丢失
- 3 内存双重释放
- 4 死锁的调试
- 0 __pthread_clockjoin_ex (threadid=140699237369600, thread_return=0x0,
- 1 0x000055dd590092ed in main ()
- 0 __lll_lock_wait (futex=futex@entry=0x55dd5900c040
, private=0) - 0 __lll_lock_wait (futex=futex@entry=0x55dd5900c040
, private=0) - 1 0x00007ff7183060a3 in GI_pthread_mutex_lock (mutex=0x55dd5900c040
) - 2 0x000055dd5900921d in resetCnt() ()===========该函数中lock时导致死锁睡眠等待
- 3 0x000055dd59009262 in subThread(void*) ()
- 4 0x00007ff718303609 in start_thread (arg=
) at pthread_create.c:477 - 5 0x00007ff71822a103 in clone () at ../sysdeps/unix/sysv/linux/x86_64/clone.S:95
- 0 0x00007ffff7bc8cc0 in pthread_mutex_lock () from /lib64/libpthread.so.0
- 1 0x00007ffff792e292 in _dl_addr () from /lib64/libc.so.6
- 2 0x00007ffff7877b1c in ptmalloc_init.part.7 () from /lib64/libc.so.6
- 3 0x00007ffff7877e2e in malloc_hook_ini () from /lib64/libc.so.6
- 4 0x00007ffff7877701 in calloc () from /lib64/libc.so.6
- 5 0x00007ffff7ded735 in _dl_allocate_tls () from /lib64/ld-linux-x86-64.so.2
- 6 0x00007ffff7bc783c in pthread_create@@GLIBC_2.2.5 () from /lib64/libpthread.so.0
- 7 0x00000000004007a8 in main () at a.cpp:35
- 0 0x00007ffff7bc9ea0 in pthread_mutex_unlock () from /lib64/libpthread.so.0
- 1 0x00007ffff792e49e in _dl_addr () from /lib64/libc.so.6
- 2 0x00007ffff7877b1c in ptmalloc_init.part.7 () from /lib64/libc.so.6
- 3 0x00007ffff7877e2e in malloc_hook_ini () from /lib64/libc.so.6
- 4 0x00007ffff7877701 in calloc () from /lib64/libc.so.6
- 5 0x00007ffff7ded735 in _dl_allocate_tls () from /lib64/ld-linux-x86-64.so.2
- 6 0x00007ffff7bc783c in pthread_create@@GLIBC_2.2.5 () from /lib64/libpthread.so.0
- 7 0x00000000004007a8 in main () at a.cpp:35
- 0 0x00007ffff7bc8cc0 in pthread_mutex_lock () from /lib64/libpthread.so.0
- 1 0x0000000000400737 in subThread () at a.cpp:20
- 2 0x00007ffff7bc6e65 in start_thread () from /lib64/libpthread.so.0
- 3 0x00007ffff78ef88d in clone () from /lib64/libc.so.6
- 0 0x00007ffff7bc9ea0 in pthread_mutex_unlock () from /lib64/libpthread.so.0
- 1 0x0000000000400762 in subThread () at a.cpp:25
- 2 0x00007ffff7bc6e65 in start_thread () from /lib64/libpthread.so.0
- 3 0x00007ffff78ef88d in clone () from /lib64/libc.so.6
- 0 0x00007ffff7bc8cc0 in pthread_mutex_lock () from /lib64/libpthread.so.0
- 1 0x0000000000400737 in subThread () at a.cpp:20
- 2 0x00007ffff7bc6e65 in start_thread () from /lib64/libpthread.so.0
- 3 0x00007ffff78ef88d in clone () from /lib64/libc.so.6
- 0 0x00007ffff7bc8cc0 in pthread_mutex_lock () from /lib64/libpthread.so.0
- 1 0x000000000040070b in resetCnt () at a.cpp:10
- 2 0x0000000000400747 in subThread () at a.cpp:22
- 3 0x00007ffff7bc6e65 in start_thread () from /lib64/libpthread.so.0
- 4 0x00007ffff78ef88d in clone () from /lib64/libc.so.6
1 segmentation fault段错误
程序执行了非法的访问内存操作,就触发SIGSEGV异常。一般时发生如下情况:
- 访问NULL指针
- 指针被破坏等原因,导致非法地址访问
- 栈溢出,导致访问超出已分配范围的内存地址
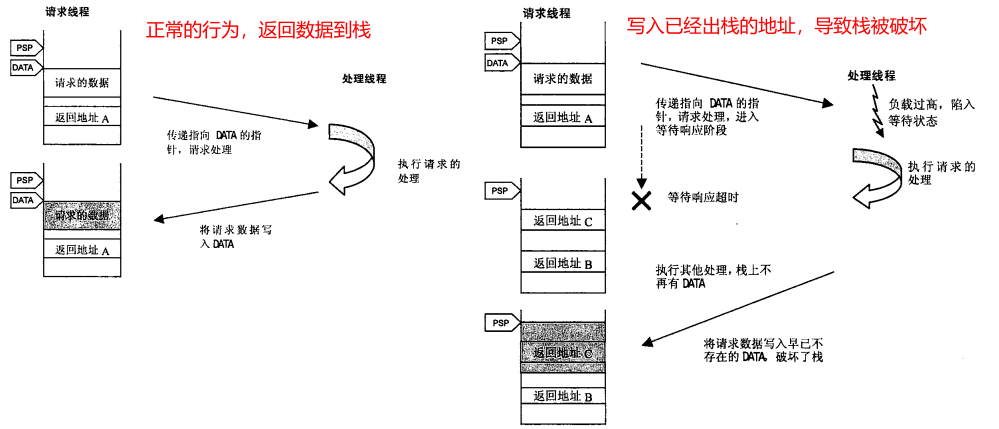
2 backtrace丢失
backtrace信息依赖于栈中保存的信息,出现下面的清空,基本可以认为栈被破坏。如果栈被破坏,就不能信任调试器生成的backtrace信息了。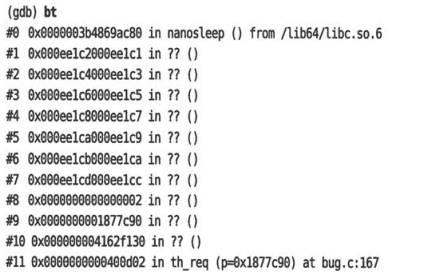
像栈内破坏导致无法胡哦去backtrace的问题,从调试角度来看是很严重的问题,栈内还保存这局部变量的信息,所以GDB此时输出的局部变量也变得不可信。
调查栈破坏最现实的方法是:根据被破坏的数据内容,判断执行写入的位置,看看有没有对栈空间的引用、指针传递处理。
3 内存双重释放
malloc、free导致SIGSEGV时,最危险的情况是:程序可能不会收到内存破坏的影响而继续执行,导致下列后果
- 在完全没有关系的地方产生SIGSEGV
-
利用MALLOCCHECK进行调试
glibc有个方便的调试标志MALLOCCHECK,可以发现内存操作相关的bug。
MALLOCCHECK=0, 和没设置一样,将忽略这些错误
- MALLOCCHECK=1, 将打印一个错误告警
- MALLOCCHECK=2, 程序将收到SIGABRT信号退出
如下面例子:
#include <stdio.h>#include <stdlib.h>#include <string.h>#define BUF_SIZE 32int main(){int i;char *buf1 = (char *)malloc(BUF_SIZE);printf("buf1: [%x] %p\n", buf1, buf1);memset(buf1, 'c', BUF_SIZE + 10); //这里内存越界printf("%s:%d buf1: [%x]\n", __func__, __LINE__, buf1);free(buf1);return 0;}
在编译之后,运行时可以设置环境变量,会产生告警和中断执行:
barret@Barret-PC:~$ export MALLOC_CHECK_=0barret@Barret-PC:~$ ./a.outbuf1: [7f2f82a0] 0x56077f2f82a0main:14 buf1: [7f2f82a0]barret@Barret-PC:~$ export MALLOC_CHECK_=1barret@Barret-PC:~$ ./a.outbuf1: [aa54010] 0x55db0aa54010main:14 buf1: [aa54010]free(): invalid pointerAbortedbarret@Barret-PC:~$ export MALLOC_CHECK_=2barret@Barret-PC:~$ ./a.outbuf1: [cc08e010] 0x556acc08e010main:14 buf1: [cc08e010]free(): invalid pointerAborted
4 死锁的调试
看下面例子:
#include <stdio.h>
#include <unistd.h>
#include <pthread.h>

pthread_mutex_t mutex = PTHREAD_MUTEX_INITIALIZER;
int cnt = 0; //计数

void resetCnt()
{
    pthread_mutex_lock(&mutex);
    cnt = 0;
    pthread_mutex_unlock(&mutex);
}

void* subThread(void*)
{
    //子线程
    while(1)
    {
        pthread_mutex_lock(&mutex);
        if (cnt > 2)
            resetCnt(); //这里会死锁,重复锁定mutex
        else
            cnt++;
        pthread_mutex_unlock(&mutex);

        printf("%d\n", cnt);
        sleep(1);
    }
}

int main()
{
    pthread_t tid;
    pthread_create(&tid, NULL, subThread, NULL);
    pthread_join(tid, NULL);

    return 0;
}
在cnt=3的时候,调用reset,导致重复请求锁定mutex,造成死锁,输出结果会夯死在打印3的位置:
barret@Barret-PC:~$ gcc a.cpp -lpthread
barret@Barret-PC:~$ ./a.out
1
2
3
#本来期待显示0,但是这里死锁了,没有新的显示
那么这样的问题如何debug呢?
首先确认程序是失去控制还是在等待,可以用ps命令查看。第二列为进程状态
- R:进程仍在执行
- S:进程在睡眠。如果睡眠时间大于代码规定的时间,则基本上就是死锁了
barret@Barret-PC:~$ ps ax -l | grep a.out
F S   UID   PID  PPID  C PRI  NI ADDR SZ WCHAN  TTY        TIME CMD
0 S  1000   325    63  0  80   0 - 19094 futex_ pts/1      0:00 ./a.out
使用
gdb attach命令进入这个进程,进行调试 ```bash (gdb) attach 340 Attaching to process 340 [New LWP 341] [Thread debugging using libthread_db enabled] Using host libthread_db library “/lib/x86_64-linux-gnu/libthread_db.so.1”. __pthread_clockjoin_ex (threadid=140699237369600, thread_return=0x0, clockid=, abstime= , block= ) at pthread_join_common.c:145 (gdb) bt==================可以看到bt出来的调用栈是主线程的,需要切换到子线程 0 __pthread_clockjoin_ex (threadid=140699237369600, thread_return=0x0,
clockid=
, abstime= , block= ) at pthread_join_common.c:145 1 0x000055dd590092ed in main ()
(gdb) thread 2==================切换到第二个线程,即子线程 [Switching to thread 2 (Thread 0x7ff718104700 (LWP 341))]
0 __lll_lock_wait (futex=futex@entry=0x55dd5900c040
, private=0) at lowlevellock.c:52 52 lowlevellock.c: No such file or directory. (gdb) bt=======================打印子线程的调用栈
0 __lll_lock_wait (futex=futex@entry=0x55dd5900c040
, private=0) at lowlevellock.c:52
1 0x00007ff7183060a3 in GI_pthread_mutex_lock (mutex=0x55dd5900c040
) at ../nptl/pthread_mutex_lock.c:80====================可以看到在这里进入内核空间并睡眠
2 0x000055dd5900921d in resetCnt() ()===========该函数中lock时导致死锁睡眠等待
3 0x000055dd59009262 in subThread(void*) ()
4 0x00007ff718303609 in start_thread (arg=
) at pthread_create.c:477 5 0x00007ff71822a103 in clone () at ../sysdeps/unix/sysv/linux/x86_64/clone.S:95
- 从gdb我们分析到原因时死锁,但是无法知道第一次lock在什么地方。那我们就需要自定义一个**gdb命令脚本,自动记录lock和unlock被调用时的backtrace**。命令脚本如下,保存为**debug.cmd**文件
set pagination off #显示行数超过终端,继续显示 set logging file debug.log #保存屏幕输出 set logging overwrite set logging on start set $addr1 = pthread_mutex_lock set $addr2 = pthread_mutex_unlock b $addr1 #在lock和unlock调用的地方设置断点 b $addr2 while 1 c if $pc != $addr1 && $pc != $addr2 quit end bt #打印调用栈 end
- 使用命令`gdb a.out -x debug.cmd`执行程序,然后查看得到的debug.log,查看在哪些地方进行的lock和unlock操作。debug.log内容如下:
Temporary breakpoint 1 at 0x40078d: file a.cpp, line 35. [Thread debugging using libthread_db enabled] Using host libthread_db library “/lib64/libthread_db.so.1”.
Temporary breakpoint 1, main () at a.cpp:35 35 pthread_create(&tid, NULL, subThread, NULL); Breakpoint 2 at 0x7ffff7bc8cc0 Breakpoint 3 at 0x7ffff7bc9ea0
Breakpoint 2, 0x00007ffff7bc8cc0 in pthread_mutex_lock () from /lib64/libpthread.so.0
0 0x00007ffff7bc8cc0 in pthread_mutex_lock () from /lib64/libpthread.so.0
1 0x00007ffff792e292 in _dl_addr () from /lib64/libc.so.6
2 0x00007ffff7877b1c in ptmalloc_init.part.7 () from /lib64/libc.so.6
3 0x00007ffff7877e2e in malloc_hook_ini () from /lib64/libc.so.6
4 0x00007ffff7877701 in calloc () from /lib64/libc.so.6
5 0x00007ffff7ded735 in _dl_allocate_tls () from /lib64/ld-linux-x86-64.so.2
6 0x00007ffff7bc783c in pthread_create@@GLIBC_2.2.5 () from /lib64/libpthread.so.0
7 0x00000000004007a8 in main () at a.cpp:35
Breakpoint 3, 0x00007ffff7bc9ea0 in pthread_mutex_unlock () from /lib64/libpthread.so.0
0 0x00007ffff7bc9ea0 in pthread_mutex_unlock () from /lib64/libpthread.so.0
1 0x00007ffff792e49e in _dl_addr () from /lib64/libc.so.6
2 0x00007ffff7877b1c in ptmalloc_init.part.7 () from /lib64/libc.so.6
3 0x00007ffff7877e2e in malloc_hook_ini () from /lib64/libc.so.6
4 0x00007ffff7877701 in calloc () from /lib64/libc.so.6
5 0x00007ffff7ded735 in _dl_allocate_tls () from /lib64/ld-linux-x86-64.so.2
6 0x00007ffff7bc783c in pthread_create@@GLIBC_2.2.5 () from /lib64/libpthread.so.0
7 0x00000000004007a8 in main () at a.cpp:35
[New Thread 0x7ffff77f0700 (LWP 26497)] [Switching to Thread 0x7ffff77f0700 (LWP 26497)]
Breakpoint 2, 0x00007ffff7bc8cc0 in pthread_mutex_lock () from /lib64/libpthread.so.0
0 0x00007ffff7bc8cc0 in pthread_mutex_lock () from /lib64/libpthread.so.0
1 0x0000000000400737 in subThread () at a.cpp:20
2 0x00007ffff7bc6e65 in start_thread () from /lib64/libpthread.so.0
3 0x00007ffff78ef88d in clone () from /lib64/libc.so.6
Breakpoint 3, 0x00007ffff7bc9ea0 in pthread_mutex_unlock () from /lib64/libpthread.so.0
0 0x00007ffff7bc9ea0 in pthread_mutex_unlock () from /lib64/libpthread.so.0
1 0x0000000000400762 in subThread () at a.cpp:25
2 0x00007ffff7bc6e65 in start_thread () from /lib64/libpthread.so.0
3 0x00007ffff78ef88d in clone () from /lib64/libc.so.6
===================可以看到前几次lock和unlock都是成对出现的============================== =====================这里子线程进行了一次lock,没有unlock Breakpoint 2, 0x00007ffff7bc8cc0 in pthread_mutex_lock () from /lib64/libpthread.so.0
0 0x00007ffff7bc8cc0 in pthread_mutex_lock () from /lib64/libpthread.so.0
1 0x0000000000400737 in subThread () at a.cpp:20
2 0x00007ffff7bc6e65 in start_thread () from /lib64/libpthread.so.0
3 0x00007ffff78ef88d in clone () from /lib64/libc.so.6
=====================紧接着resetCnt函数进行第二次lock,造成死锁 Breakpoint 2, 0x00007ffff7bc8cc0 in pthread_mutex_lock () from /lib64/libpthread.so.0
0 0x00007ffff7bc8cc0 in pthread_mutex_lock () from /lib64/libpthread.so.0
1 0x000000000040070b in resetCnt () at a.cpp:10
2 0x0000000000400747 in subThread () at a.cpp:22
3 0x00007ffff7bc6e65 in start_thread () from /lib64/libpthread.so.0
4 0x00007ffff78ef88d in clone () from /lib64/libc.so.6
Program received signal SIGINT, Interrupt. [Switching to Thread 0x7ffff7fd8740 (LWP 26493)] 0x00007ffff7bc7fd7 in pthread_join () from /lib64/libpthread.so.0 A debugging session is active.
Inferior 1 [process 26493] will be killed.
Quit anyway? (y or n) [answered Y; input not from terminal] ``` 通过lock和unlock的成对检测,看一看到最终在debug.log的68行和74行出现了连续的两次lock操作,导致程序死锁睡眠。

若有收获,就点个赞吧
0 人点赞
