单细胞数据数据量很大,加重了分析的负担,但只要掌握好的方法和工具,就可以无往而不利。今年要说的这个如题,是因为在区分亚类的时候,提取了大类型并调整分辨率重新聚类计算的亚类。针对这种情况,该如何实现呢?
问题分析
其实该问题可以简化为把每个亚类的分类信息提取出来并给大类进行赋值,然后使用Seurat内置的DotPlot功能进行作图,样式可以微调。
解决方法
有了方案,解决起来就简单了!
首先,markers基因先输入,然后把大类读入内存并操作一下
library(RColorBrewer)library(ggplot2)library(Seurat)markers<-c("PDGFRB","DCN","LUM","DKK1","ESR1","PGR","NCAM1","ITGA1","FCGR3A","CD3E","TRAC","CD8A","ACTA2","RGS5","TAGLN","ADGRL4","DIPK2B","CD34","KDR","GP1BA","CD14","PROM1","MCAM","CD36","VCAM1","VWF","DEFB1","GPX3","FOXJ1","SNTN","CD14","CD68","CD4","CD163","CD19","IGKC","JCHAIN","CD1C","THBD","CLEC9A","CBR3")endo<-readRDS("all_20_samples_after_cluster_0.09.rds")#这里读取大类###给大类重命名new.cluster.ids <- c("Stroma Cell", "NK and T Cell", "Luminal Epithelial Cell", "Macrophages and Dendritic", "Progenitor Cell", "Endothelial Cell","Smooth Muscle Cell", "Ciliated Epithelial Cell")names(new.cluster.ids) <- levels(endo)endo <- RenameIdents(endo, new.cluster.ids)all_cell<-Idents(endo)need<-as.character(all_cell)names(need)<-names(all_cell)
然后,把需要的三个亚类读入内容并处理亚类和大类之间的映射关系
for (i in c(1,3,4)){fs_name<-paste0("./cluster_",i,"/cluster_",i,".afterclu.rds")cls<-readRDS(fs_name)cell.type<-Idents(cls)cls_cluster<-paste(new.cluster.ids[i+1],cell.type,sep="_")names(cls_cluster)<-names(cell.type)need[which(need==new.cluster.ids[i+1])]<-cls_clusterrm(cls)}
把新的到的分组信息传入到大类中并设置好因子顺序,将其定义为Idents
endo$new_group<-needendo$new_group<-factor(endo$new_group,levels=c("Stroma Cell","NK and T Cell_0","NK and T Cell_1","NK and T Cell_2","NK and T Cell_3","Smooth Muscle Cell","Endothelial Cell","Progenitor Cell_0","Progenitor Cell_1","Progenitor Cell_2","Progenitor Cell_3","Luminal Epithelial Cell","Ciliated Epithelial Cell","Macrophages and Dendritic_0","Macrophages and Dendritic_1","Macrophages and Dendritic_2","Macrophages and Dendritic_3"))Idents(endo)<-"new_group"
最后作图微调并保存
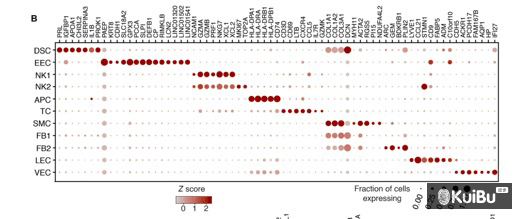
DefaultAssay(endo)<-"RNA"DotPlot(endo,features=unique(markers),cols=c("white","red"))+RotatedAxis()+theme_test()+theme(axis.text=element_text(size=6,face="bold"),axis.title=element_blank(),legend.position="bottom",legend.text=element_text(size=5.5),legend.title=element_text(size=6,face="bold"),axis.text.x=element_text(angle = 90, hjust = 1, vjust = .5))
图形如下:

另外的图?
针对以上的方法,我们可以把每个亚类的关系都映射到大类的umap图上,以尽量展示所有的关系
library(RColorBrewer)library(ggplot2)library(Seurat)endo<-readRDS("all_20_samples_after_cluster_0.09.rds")#这里读取大类###给大类重命名new.cluster.ids <- c("Stroma Cell", "NK and T Cell", "Luminal Epithelial Cell", "Macrophages and Dendritic", "Progenitor Cell", "Endothelial Cell","Smooth Muscle Cell", "Ciliated Epithelial Cell")names(new.cluster.ids) <- levels(endo)endo <- RenameIdents(endo, new.cluster.ids)all_cell<-Idents(endo)need<-as.character(all_cell)names(need)<-names(all_cell)for (i in c(1:7)){fs_name<-paste0("./cluster_",i,"/cluster_",i,".afterclu.rds")cls3<-readRDS(fs_name)#这里读取亚类cell.type<-Idents(cls3)cls3_cluster<-paste(new.cluster.ids[i+1],cell.type,sep="_")names(cls3_cluster)<-names(cell.type)need[which(need2==new.cluster.ids[i+1])]<-cls3_clusterrm(cls3)}endo$new_id<-needDimPlot(endo,reduction="umap",group.by="new_id",cols=colorRampPalette(brewer.pal(29,"Set1"))(29))+theme(legend.text=element_text(size=6))ggsave("dimplot_for_newlable.png",width=7,height=4,dpi=300)


若有收获,就点个赞吧
0 人点赞
