基于 K-means clustering 算法,实现对消费者的聚类
import numpy as npimport pandas as pdfrom tqdm import tqdm
data = pd.read_csv(r"dataset/order.csv", header=0)# data.drop(["Id"], axis=1, inplace=True)t = data.iloc[:,-8:]t
Food% Fresh% Drinks% Home% Beauty% Health% Baby% Pets%0 9.46 87.06 3.48 0.00 0.00 0.00 0.0 0.01 15.87 75.80 6.22 2.12 0.00 0.00 0.0 0.02 16.88 56.75 3.37 16.48 6.53 0.00 0.0 0.03 28.81 35.99 11.78 4.62 2.87 15.92 0.0 0.04 24.13 60.38 7.78 7.72 0.00 0.00 0.0 0.0... ... ... ... ... ... ... ... ...29995 5.80 0.00 51.30 0.00 0.00 0.00 0.0 42.929996 0.00 0.00 0.00 0.00 100.00 0.00 0.0 0.029997 9.25 0.00 77.48 13.27 0.00 0.00 0.0 0.029998 0.00 0.00 100.00 0.00 0.00 0.00 0.0 0.029999 0.00 0.00 0.00 0.00 0.00 0.00 100.0 0.0
30000 rows × 8 columns
class KMeans:'''Kmeans聚类算法实现'''def __init__(self, k, times):'''初始化Parameters-----k: int 聚成几个类times: int 迭代次数'''self.k = kself.times = timesdef fit(self, X):'''根据所给数据训练Pararmeters------X: 类数组类型,形如:[样本数量,特征数量]'''X = np.asarray(X)# 设置随机数种子,以便于可以相同的随机系列,以便随机结果重现np.random.seed(0)# 从数组中随机选择K个点作为初始聚类中心self.cluster_centers_ = X[np.random.randint(0, len(X), self.k)]# 用于存放数据所属标签self.labels_ = np.zeros(len(X))# 开始迭代for t in tqdm(range(self.times)):# 循环遍历样本计算每个样本与聚类中心的距离for index,x in enumerate(X):# 计算每个样本与每个聚类中心的欧式距离dis = np.sqrt(np.sum((x - self.cluster_centers_)**2, axis=1))# 将最小距离的索引赋值给标签数组,索引的值就是当前所属的簇。范围威威(0,K-1)self.labels_[index] = dis.argmin()# 循环便利每一个数更新聚类中心for i in range(self.k):# 计算每个簇内所有点的均值,用来更新聚类中心self.cluster_centers_[i] = np.mean(X[self.labels_==i], axis=0)def predict(self, X):'''预测样本属于哪个簇Parameters-----x: 类数组类型。形如[样本数量。特征数量]Reeturn-----result: 类数组,每一个x所属的簇'''X = np.asarray(X)result = np.zeros(len(X))for index,x in enumerate(X):# 计算样本与聚类中心的距离dis = np.sqrt(np.sum((x - self.cluster_centers_)**2, axis=1))# 找到距离最近的聚类中中心划分一个类别result[index] = dis.argmin()return result
kmeans = KMeans(3, 50)kmeans.fit(t)kmeans.cluster_centers_
100%|██████████████████████████████████████████████████████████████████████████████████| 50/50 [00:43<00:00, 1.15it/s]
array([[46.33977936, 8.93380516, 23.19047005, 13.11741633, 4.8107557 ,
1.17283735, 1.35704647, 0.95392773],
[19.5308009 , 50.42856608, 14.70652695, 7.89437019, 3.69829234,
0.91000428, 1.92515077, 0.82113238],
[ 7.93541008, 4.56182052, 30.65583437, 18.57726789, 8.61597195,
1.28482514, 26.81950293, 1.30158264]])
# 查看某个簇内的所有样本数据t[kmeans.labels_==0]
Food% Fresh% Drinks% Home% Beauty% Health% Baby% Pets%15 48.23 20.37 15.38 8.29 7.73 0.0 0.0 0.023 24.10 22.29 38.69 14.92 0.00 0.0 0.0 0.024 36.51 31.93 27.18 4.38 0.00 0.0 0.0 0.040 22.76 0.00 0.00 77.24 0.00 0.0 0.0 0.043 65.64 12.36 21.99 0.00 0.00 0.0 0.0 0.0... ... ... ... ... ... ... ... ...29974 33.93 0.00 17.46 41.46 7.15 0.0 0.0 0.029977 45.10 0.00 26.68 28.22 0.00 0.0 0.0 0.029988 28.21 0.00 48.34 23.44 0.00 0.0 0.0 0.029989 61.32 0.00 23.34 15.34 0.00 0.0 0.0 0.029990 29.74 28.72 19.52 22.02 0.00 0.0 0.0 0.0
9382 rows × 8 columns
kmeans.predict([[30,30,40,0,0,0,0,0],[0,0,0,0,0,30,30,40],[30,30,0,0,0,0,20,20]])
array([0., 2., 1.])
t2 = data.loc[:,"Food%":"Fresh%"] # 需要注意loc函数是用字符作为索引的。并且包含:后面的那一列kmeans = KMeans(3, 50)kmeans.fit(t2)
100%|██████████████████████████████████████████████████████████████████████████████████| 50/50 [00:43<00:00, 1.15it/s]
import matplotlib as mplimport matplotlib.pyplot as pltmpl.rcParams["font.family"] = "SimHei"mpl.rcParams["axes.unicode_minus"] = False
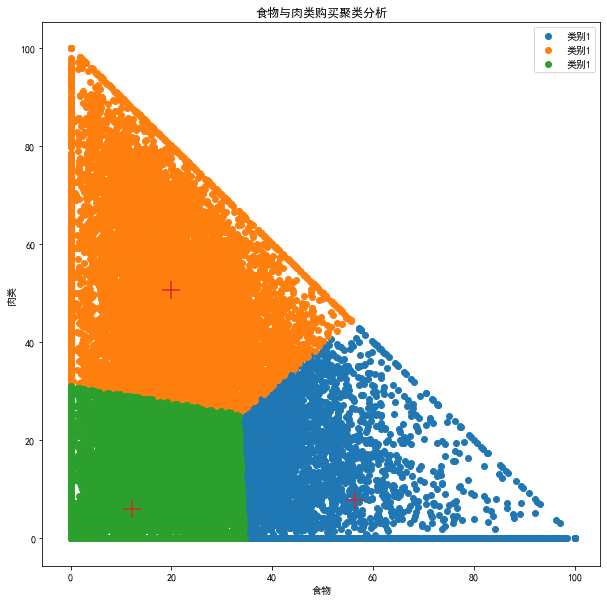
plt.figure(figsize=(10,10))# 绘制每个类别散点图plt.scatter(t2[kmeans.labels_==0].iloc[:,0], t2[kmeans.labels_==0].iloc[:,1], label="类别1")plt.scatter(t2[kmeans.labels_==1].iloc[:,0], t2[kmeans.labels_==1].iloc[:,1], label="类别1")plt.scatter(t2[kmeans.labels_==2].iloc[:,0], t2[kmeans.labels_==2].iloc[:,1], label="类别1")# 绘制聚类中心plt.scatter(kmeans.cluster_centers_[:,0],kmeans.cluster_centers_[:,1], marker="+",s=300)plt.title("食物与肉类购买聚类分析")plt.xlabel("食物")plt.ylabel("肉类")plt.legend()plt.show()

若有收获,就点个赞吧
0 人点赞
