


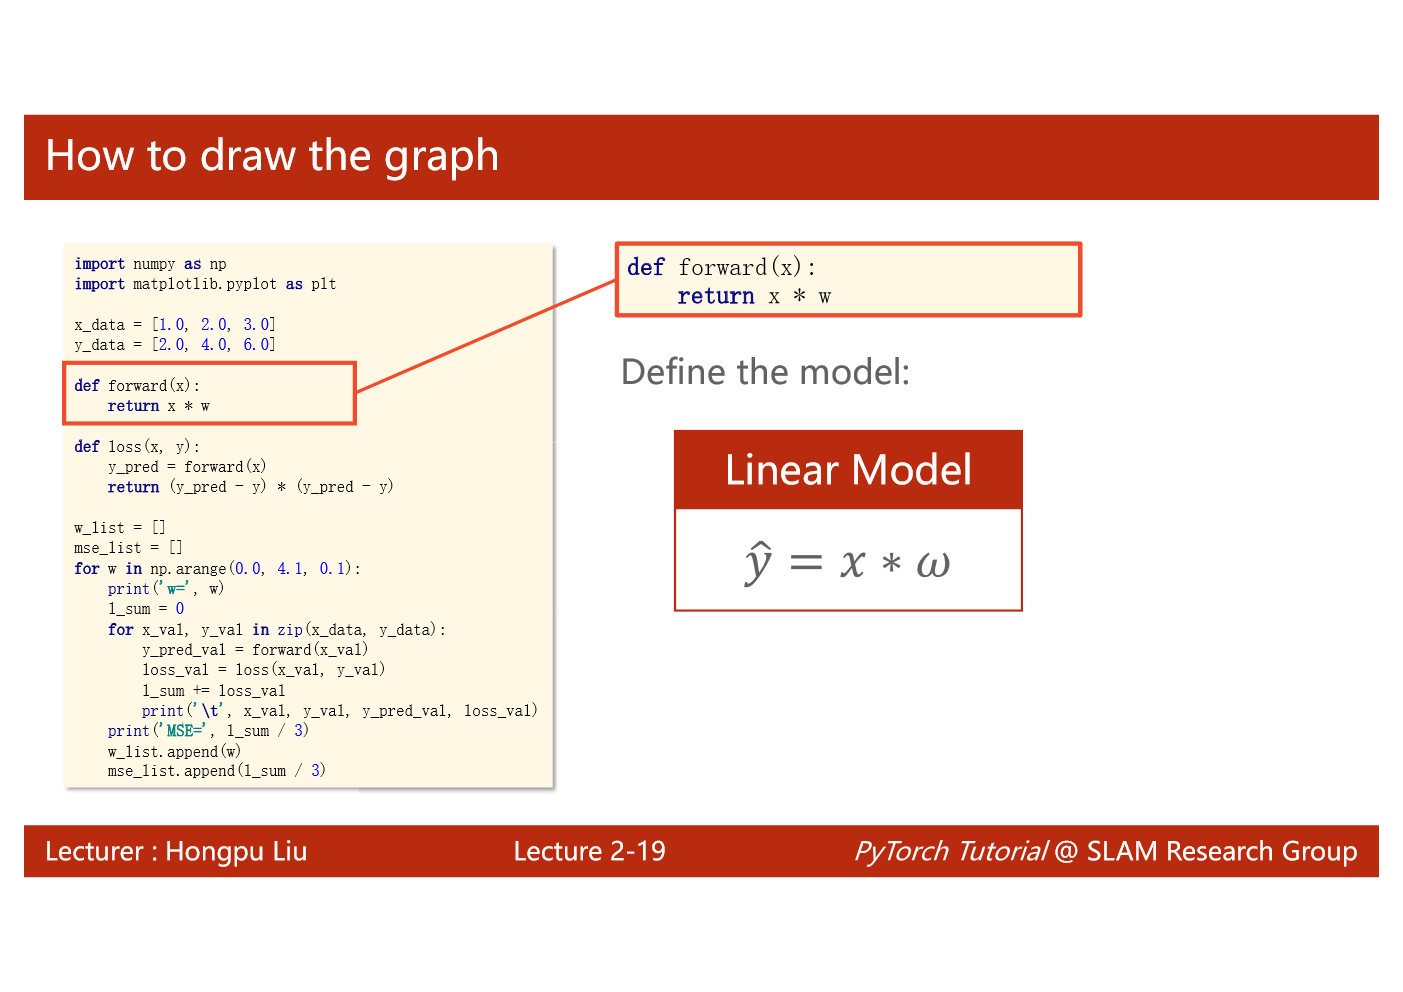
 1、函数forward()中,有一个变量w。这个变量最终的值是从for循环中传入的。
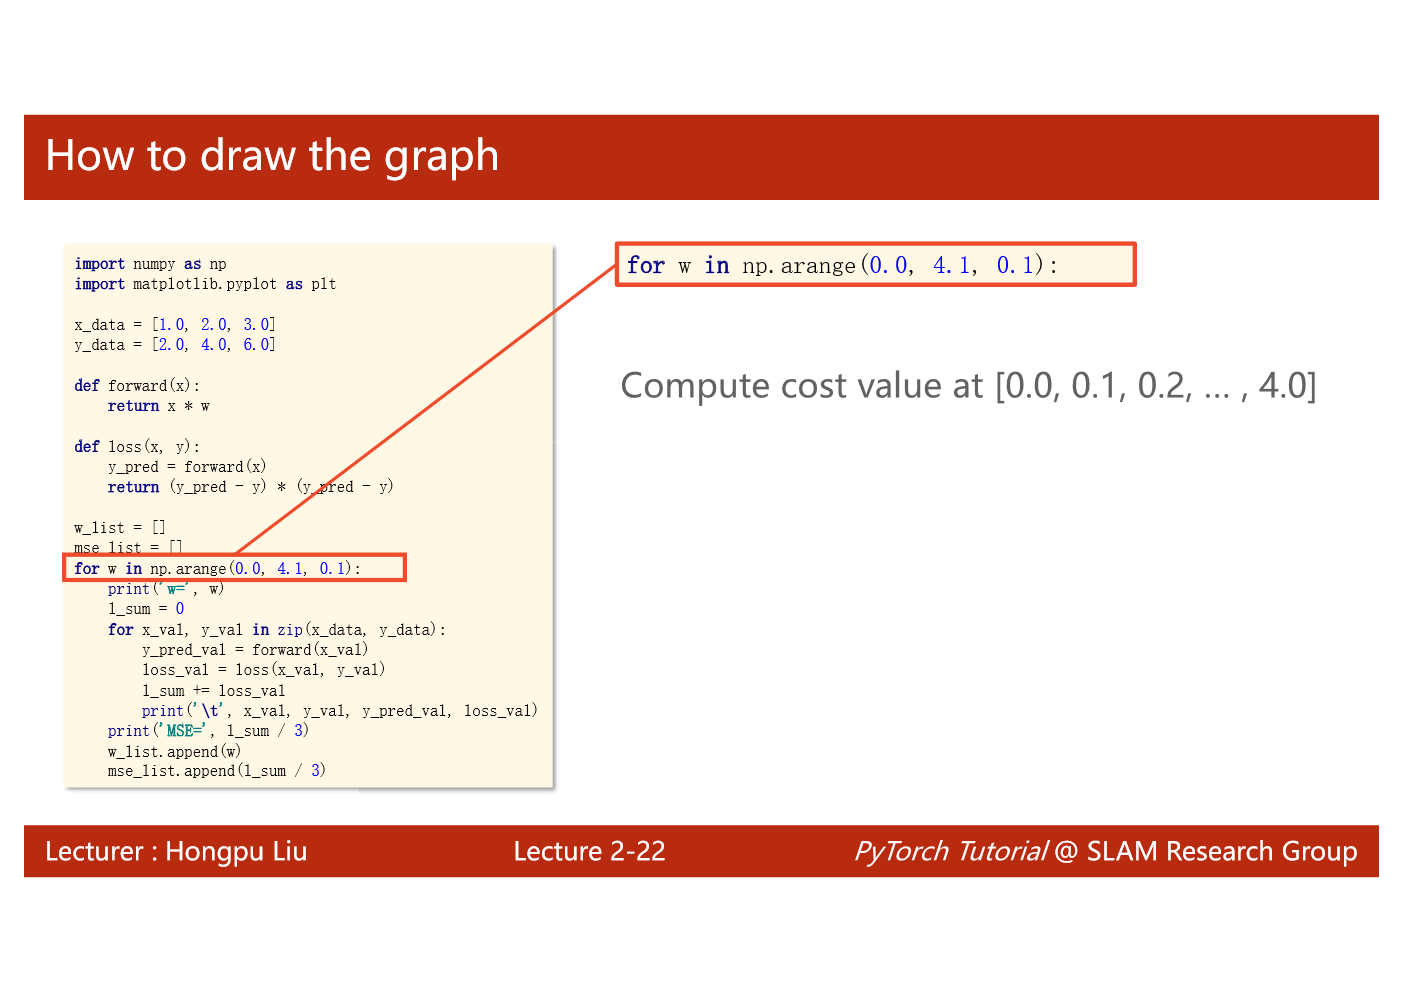
2、for循环中,使用了np.arange。若对numpy不太熟悉,传送门Numpy数据计算从入门到实战
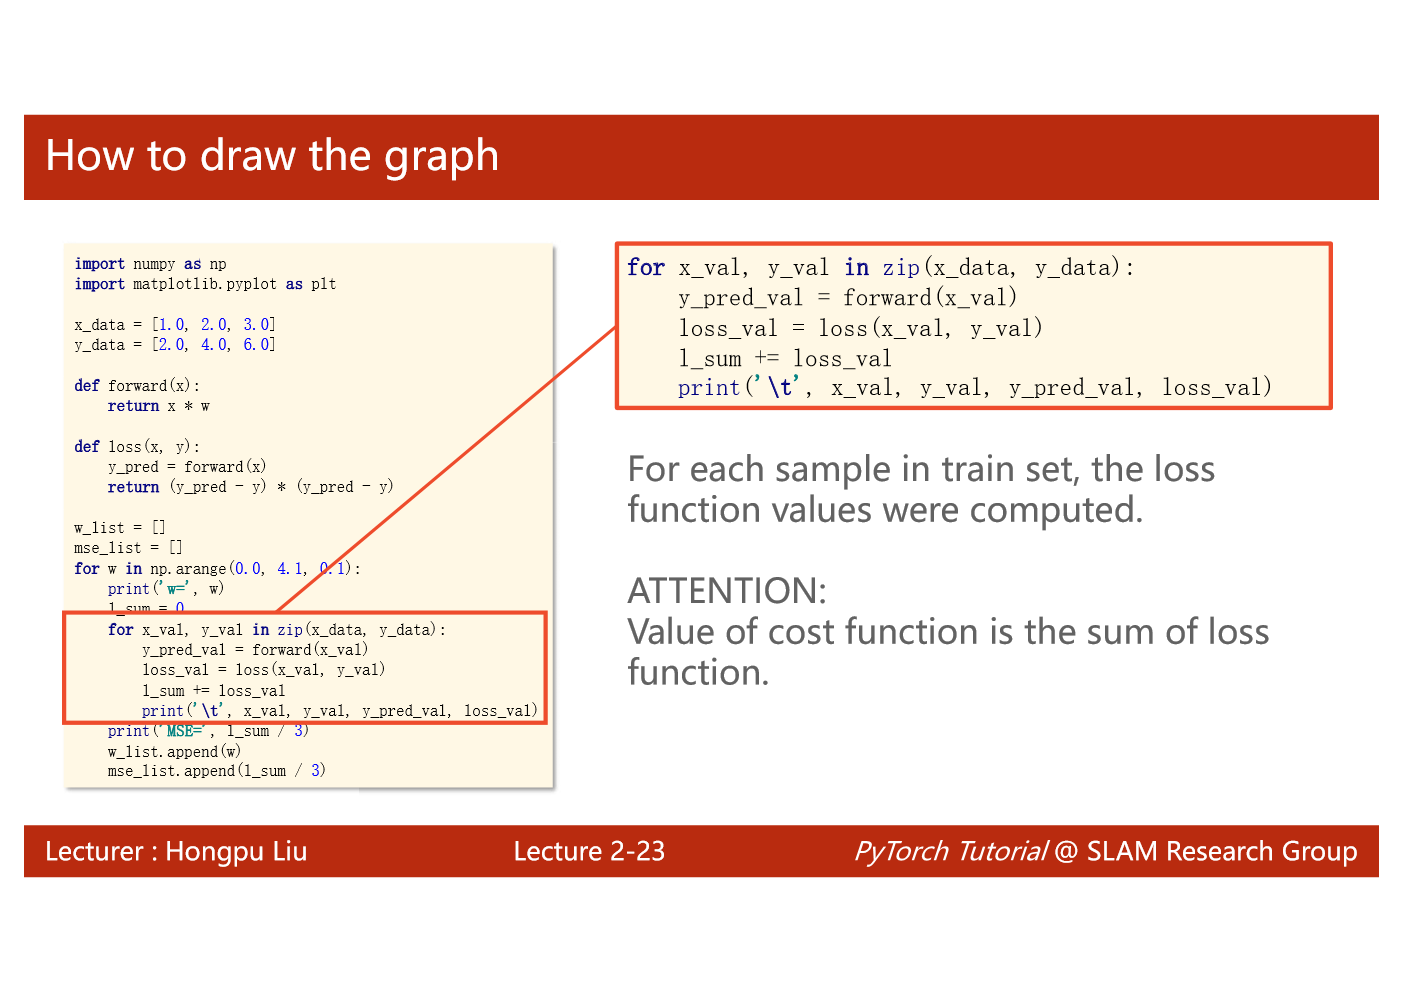
3、python中zip()函数的用法
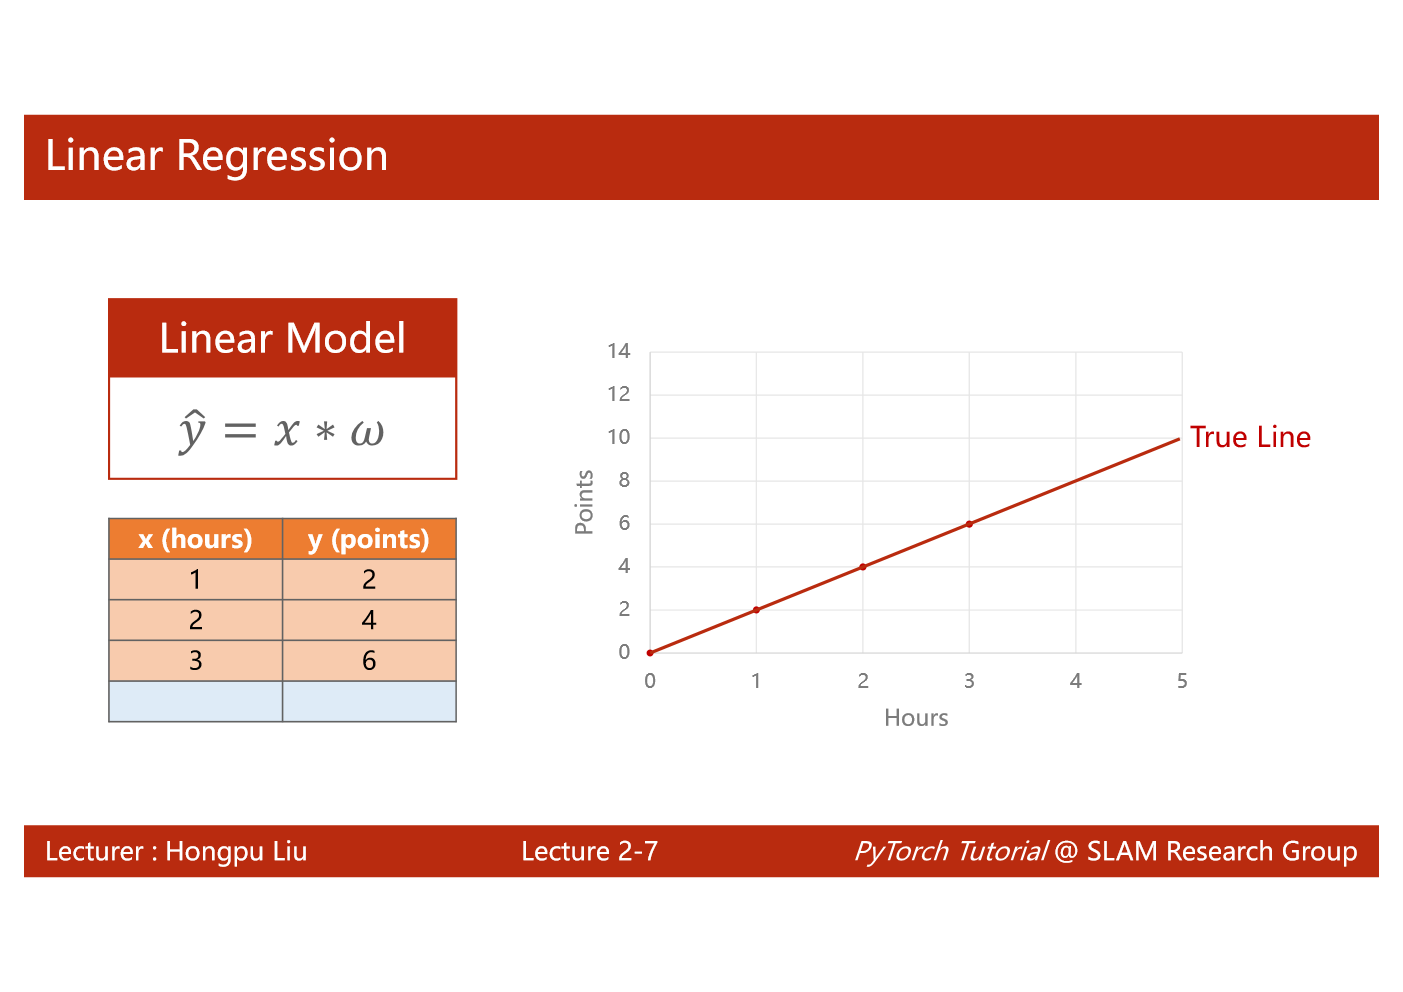
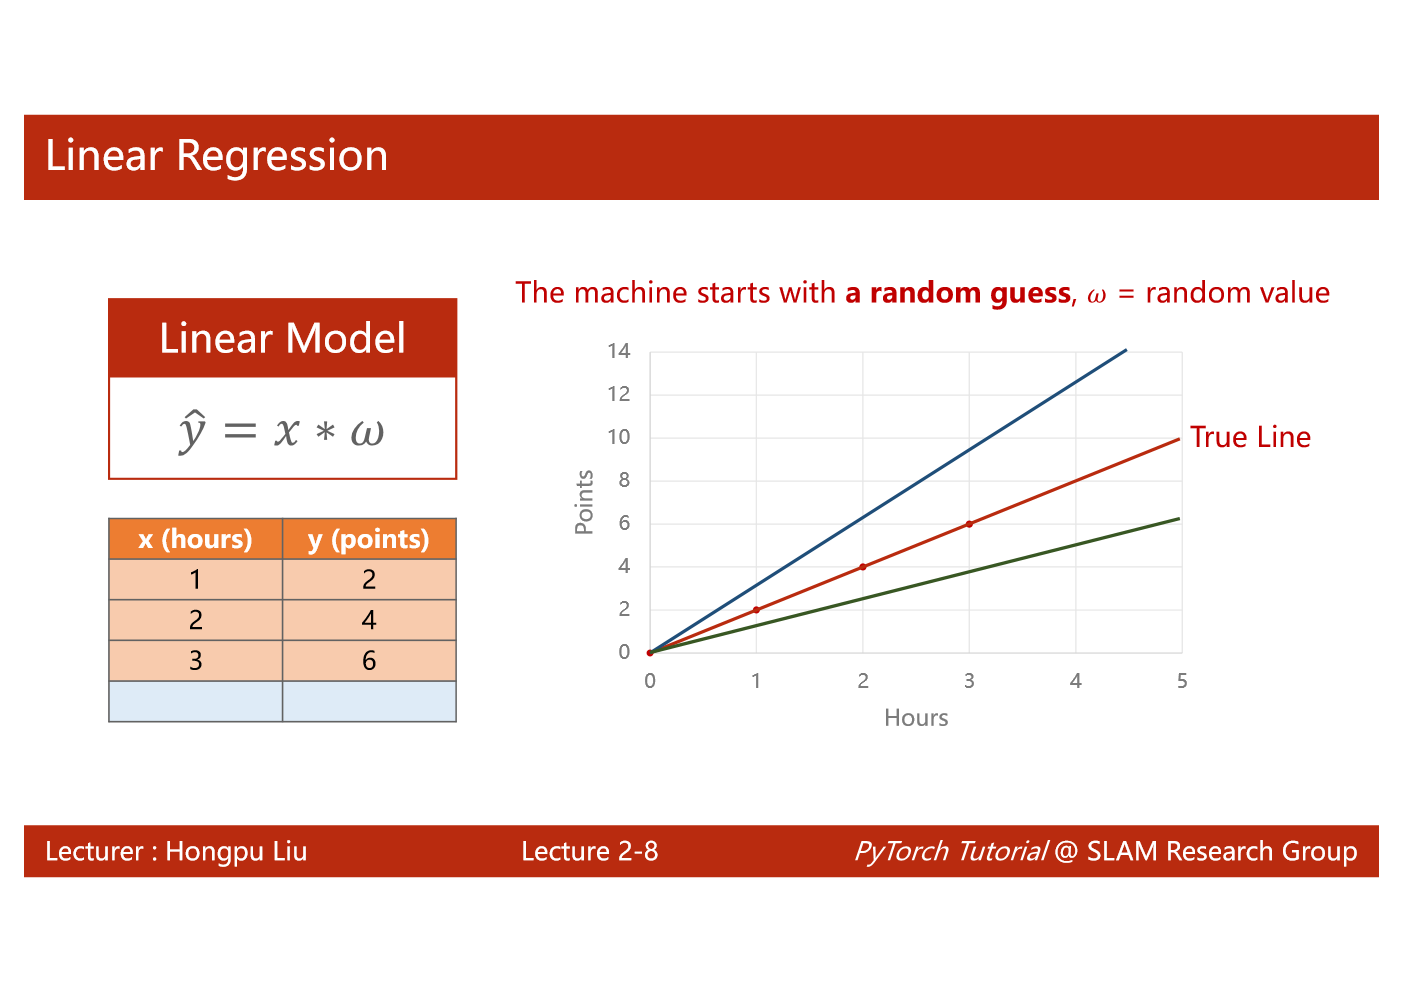
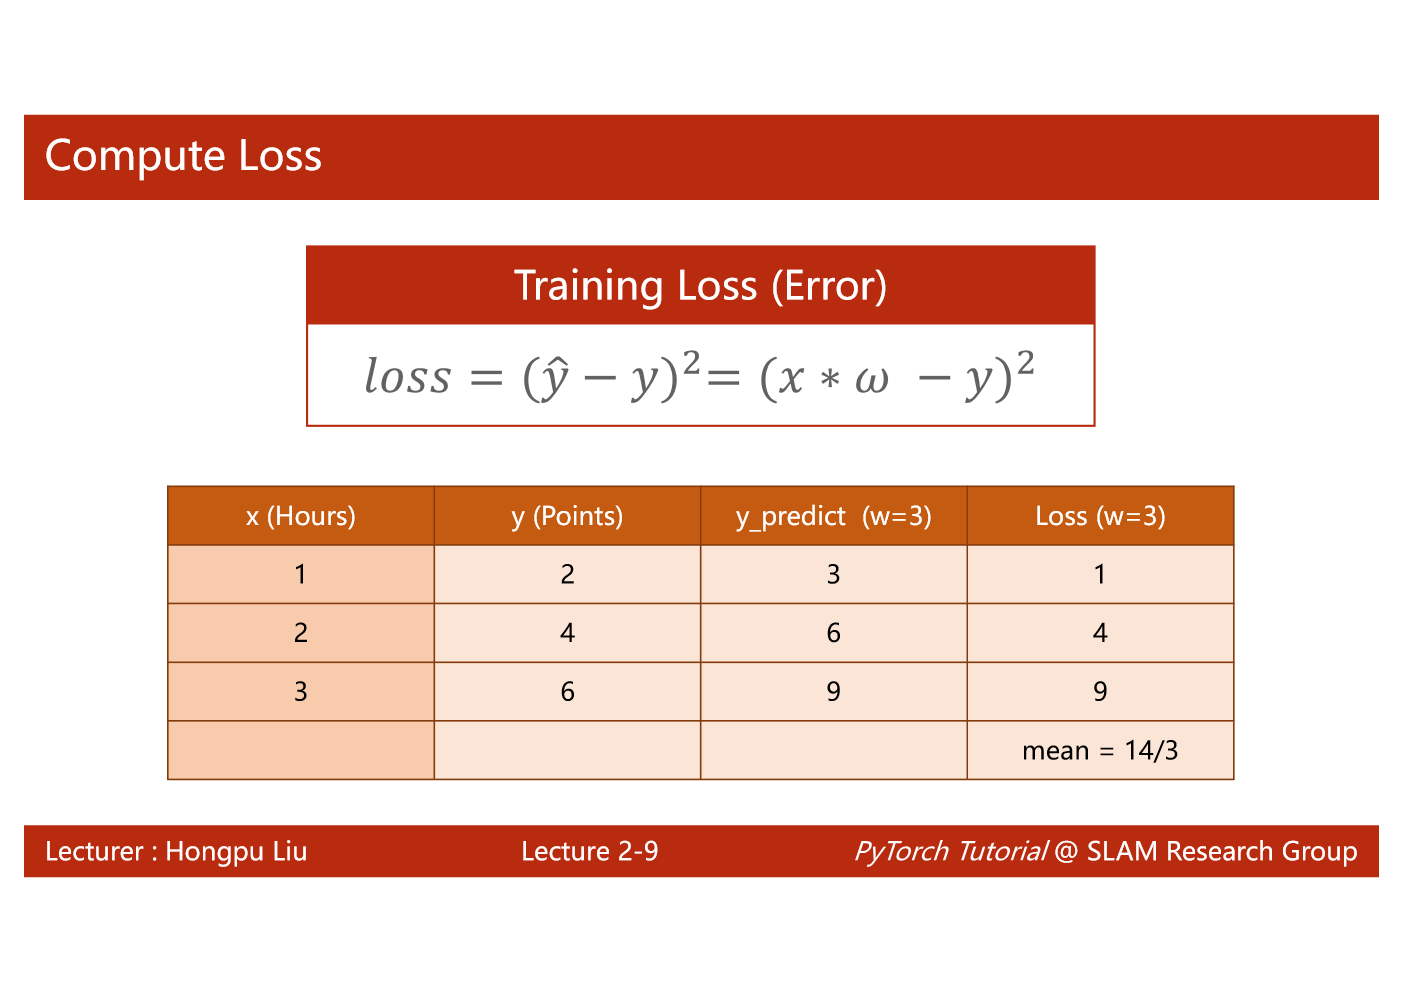
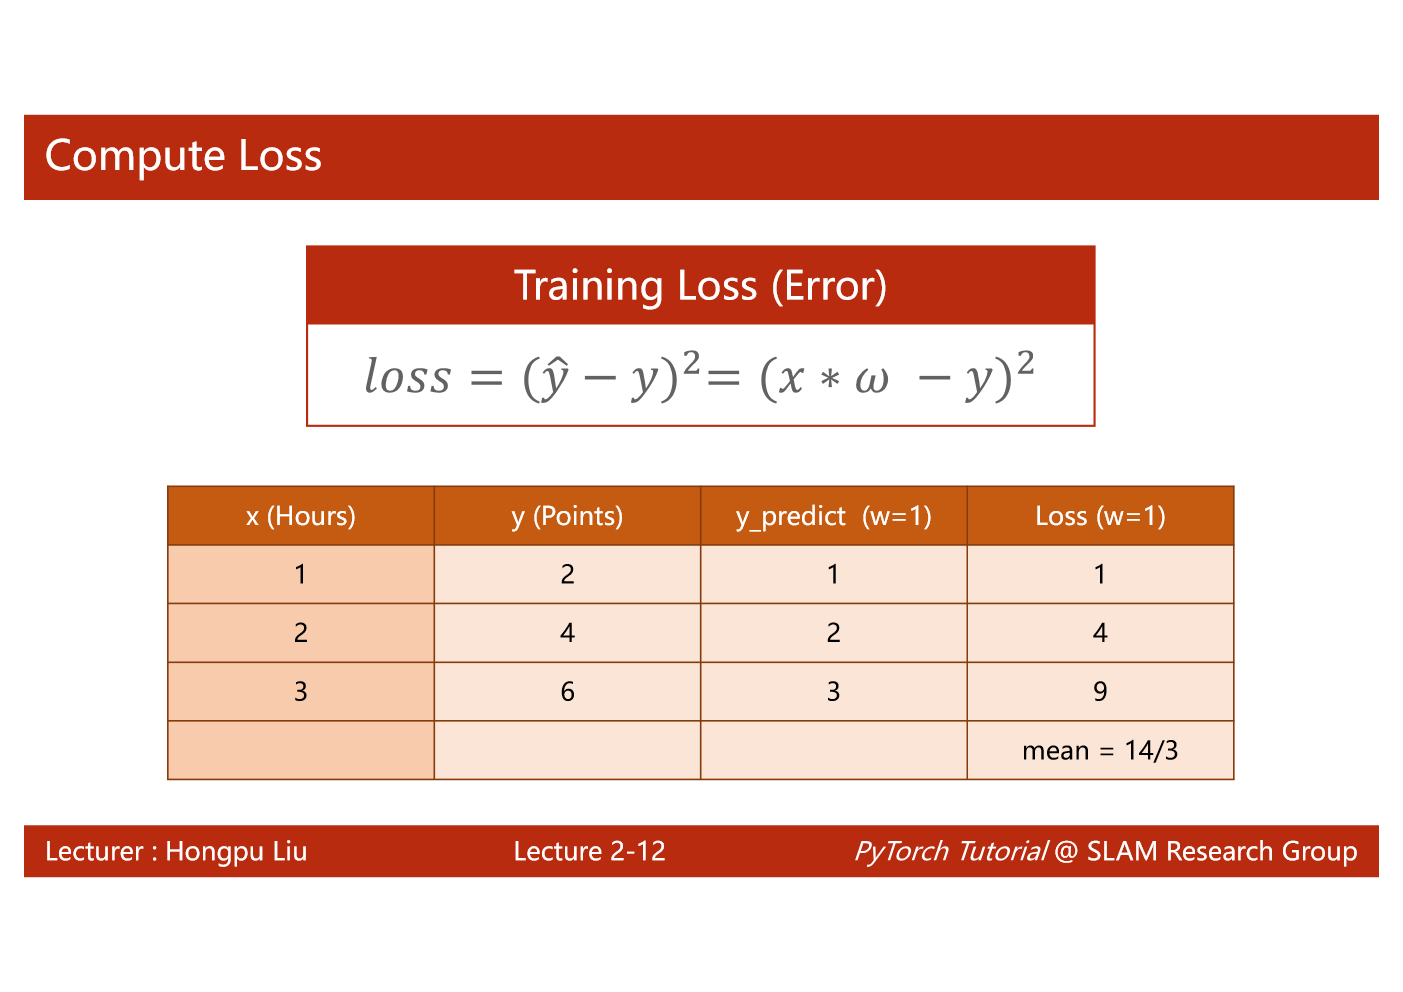
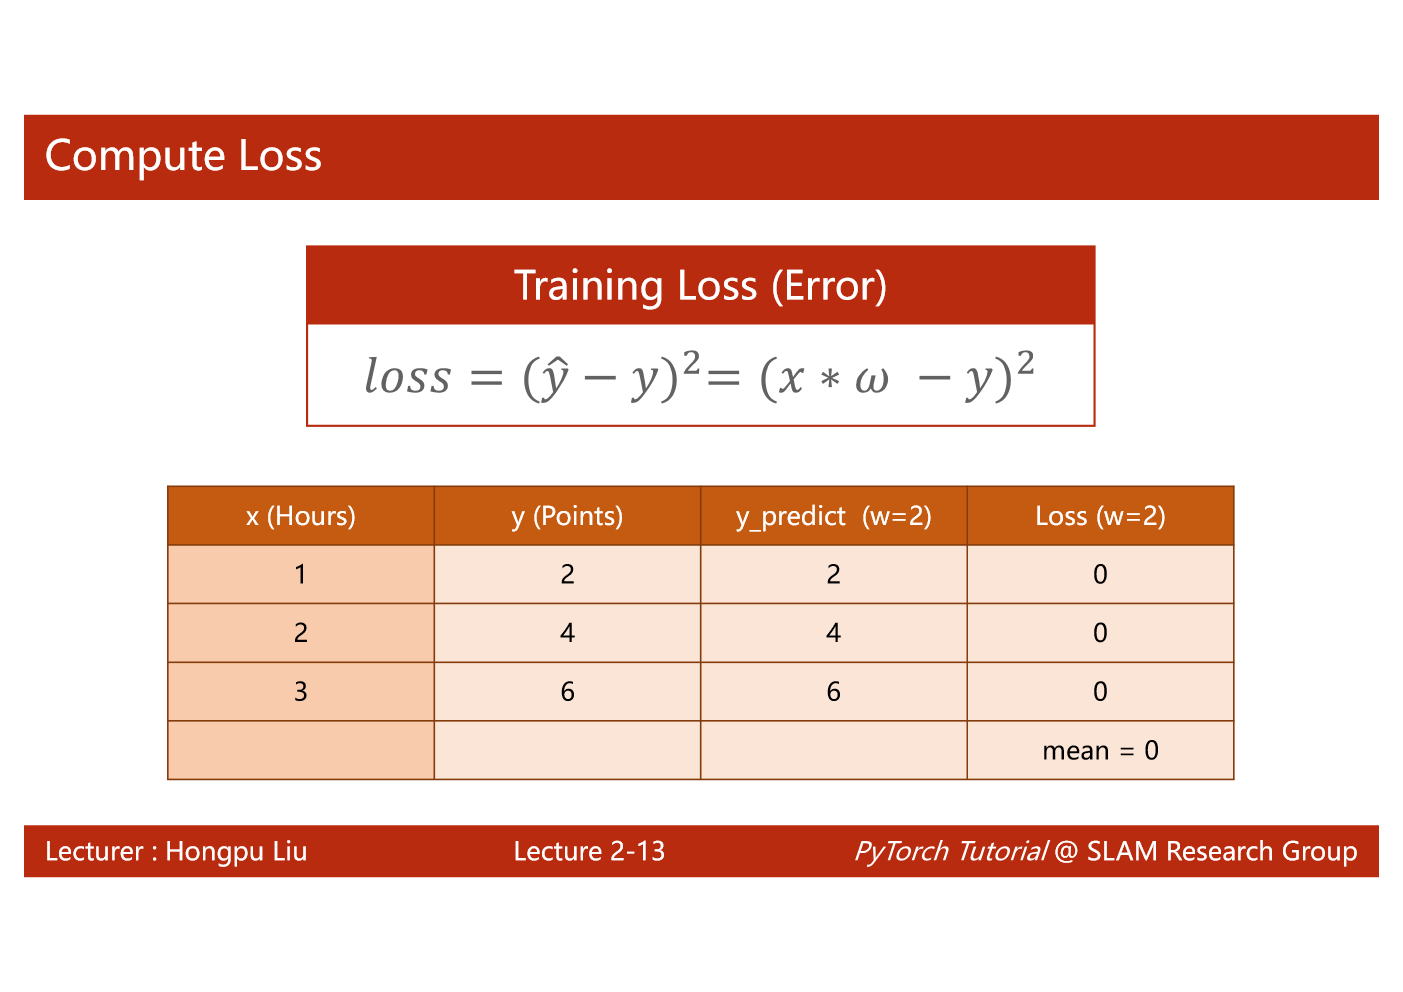
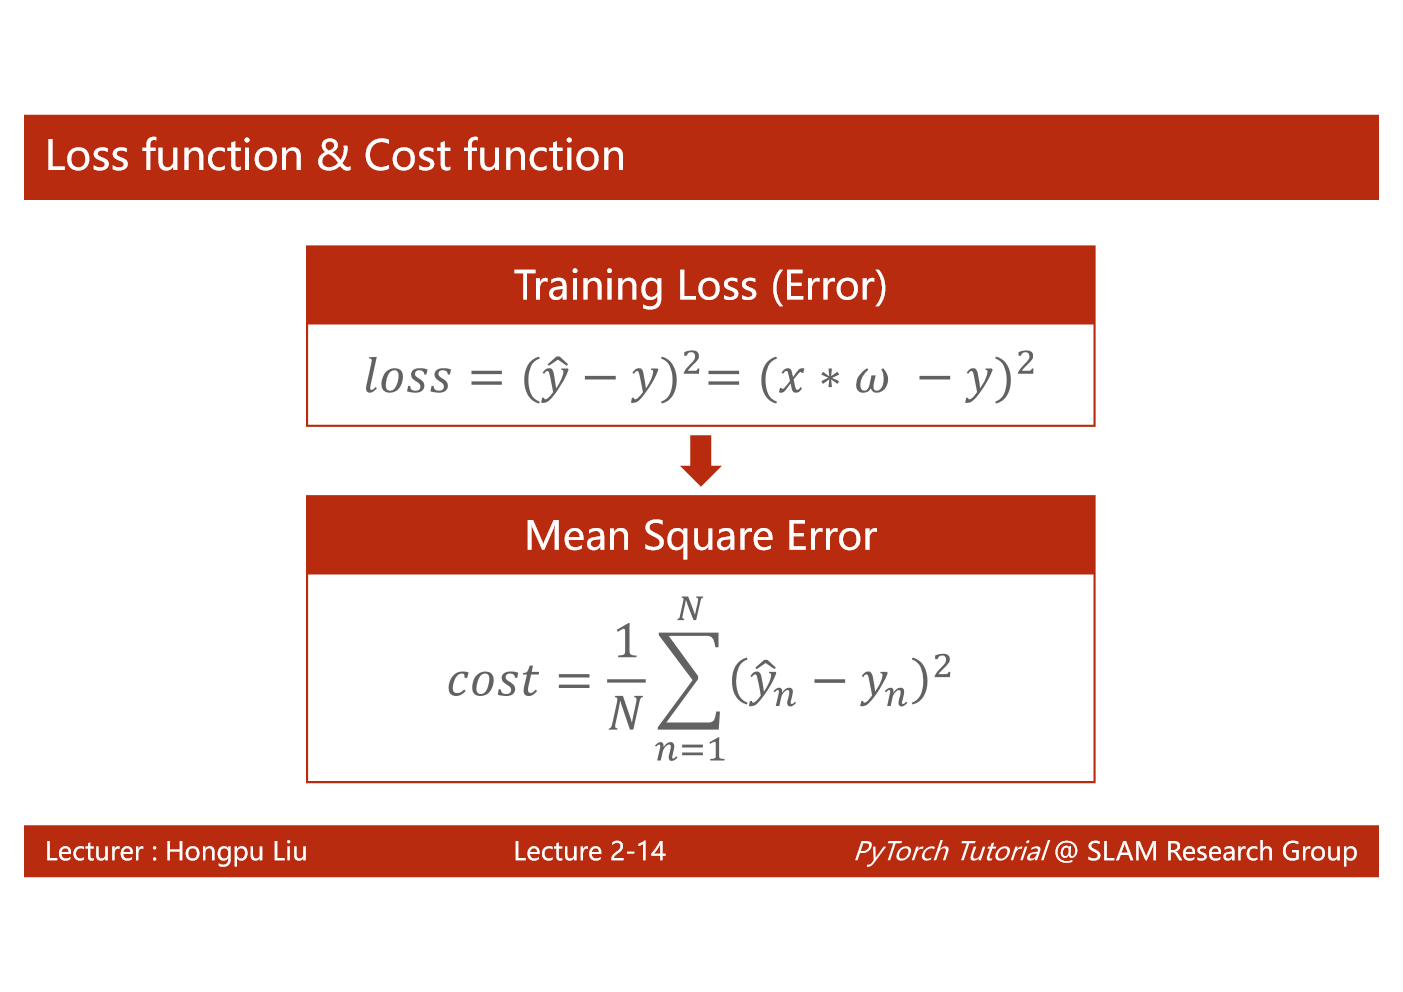
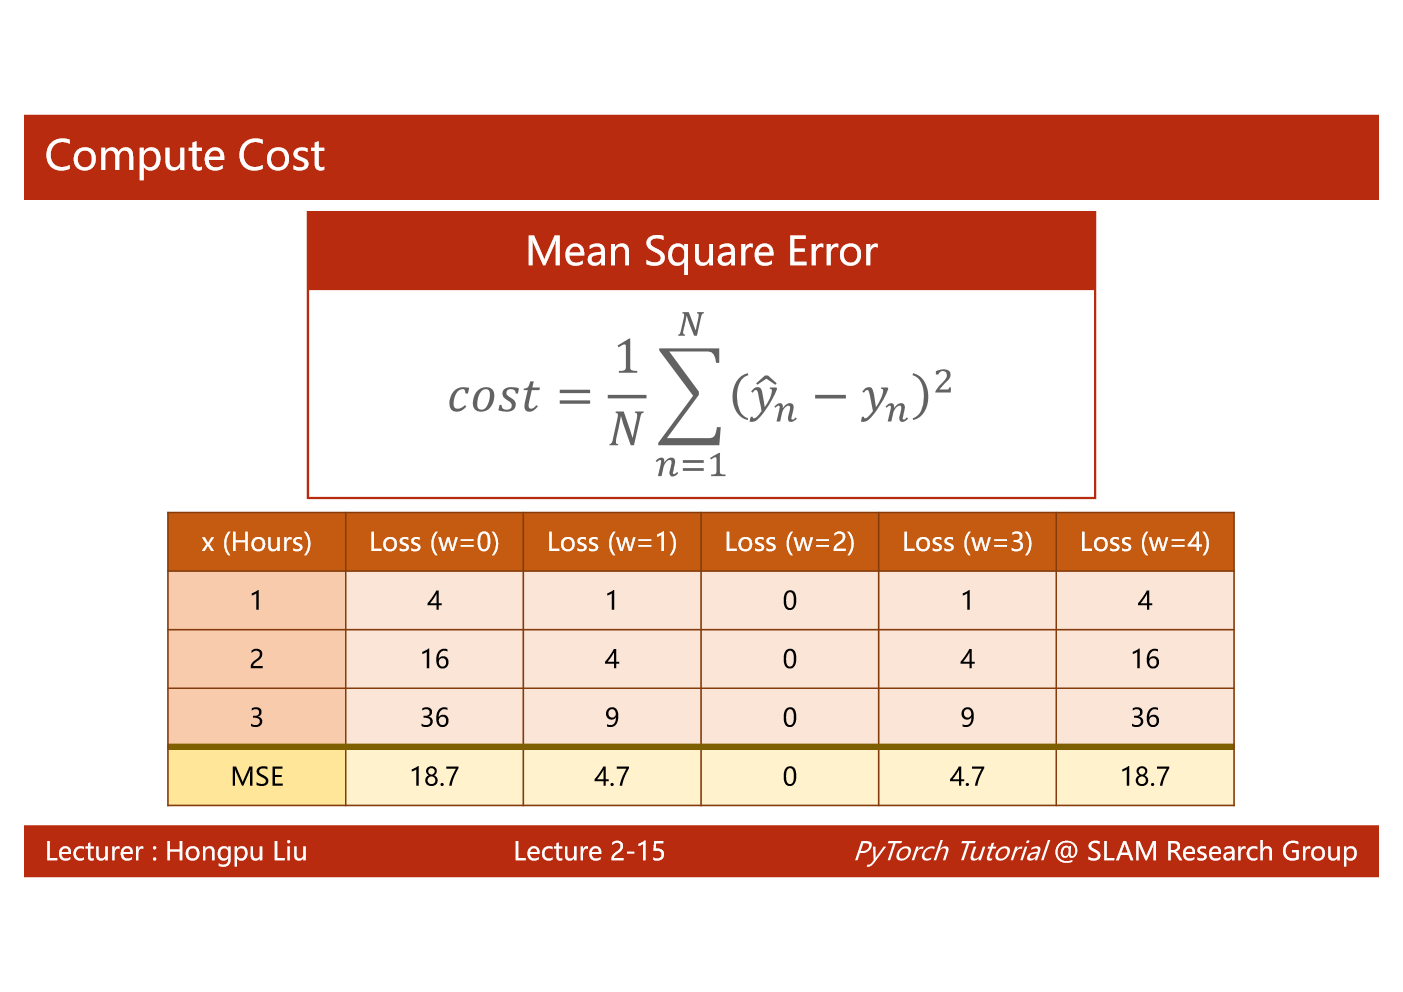
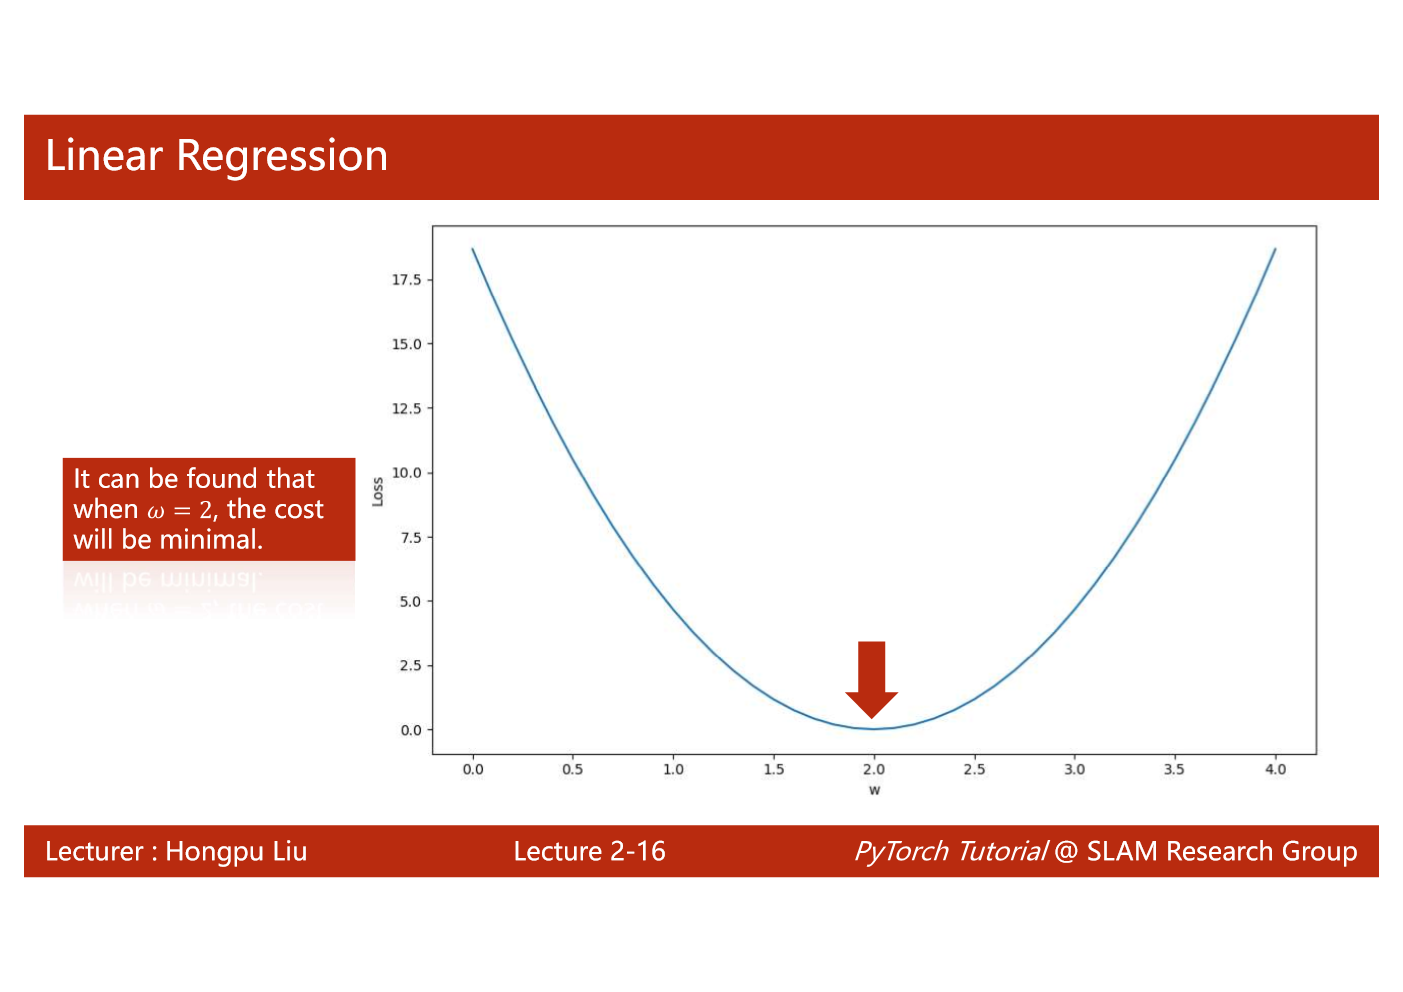
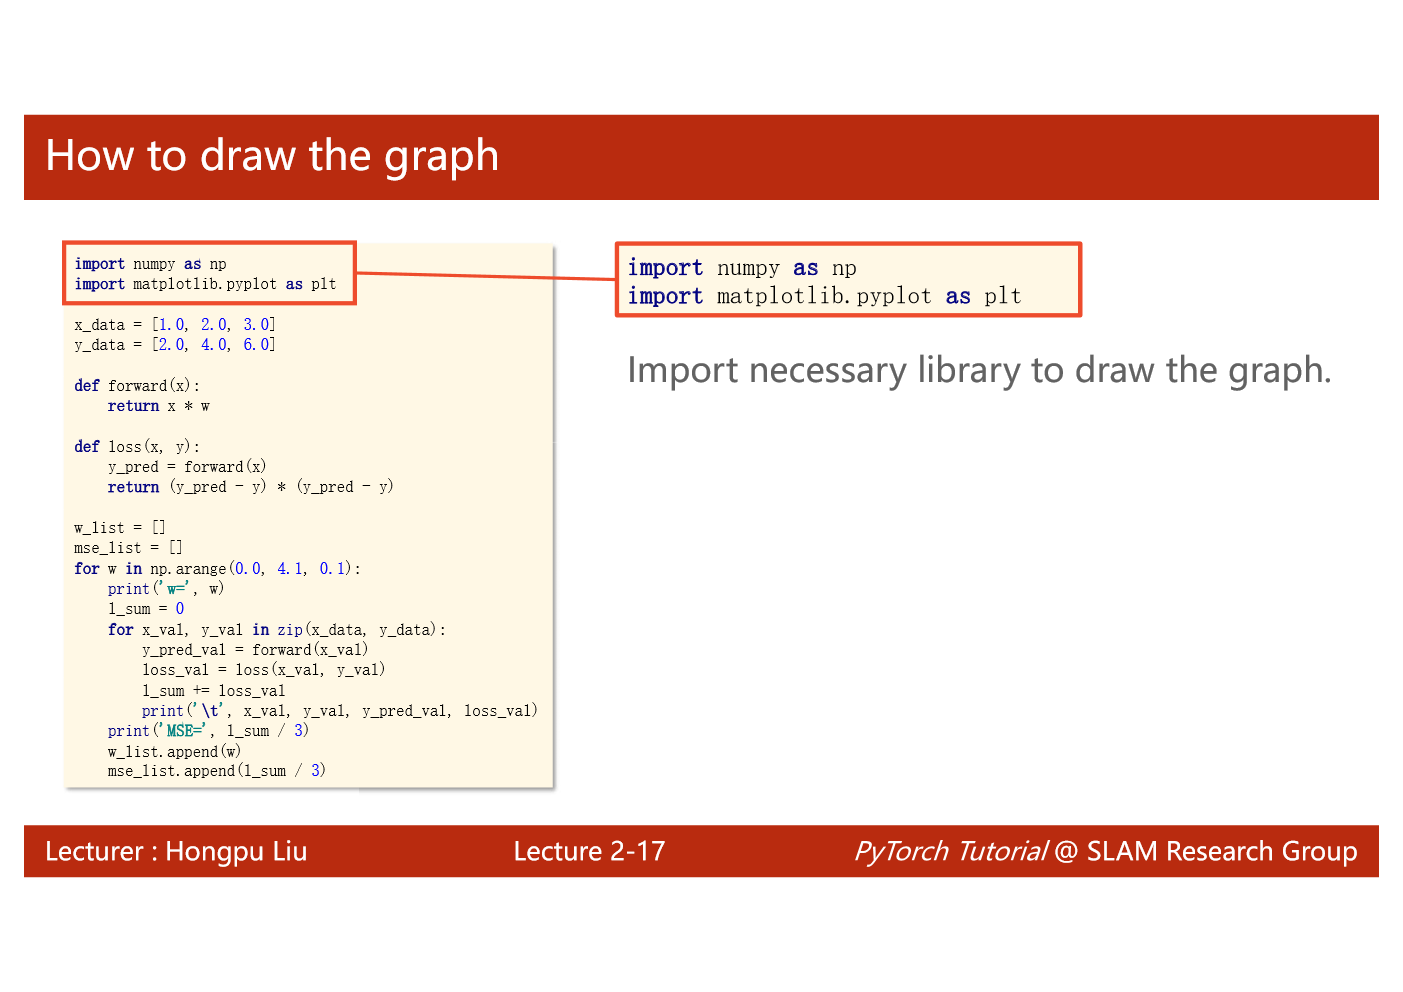
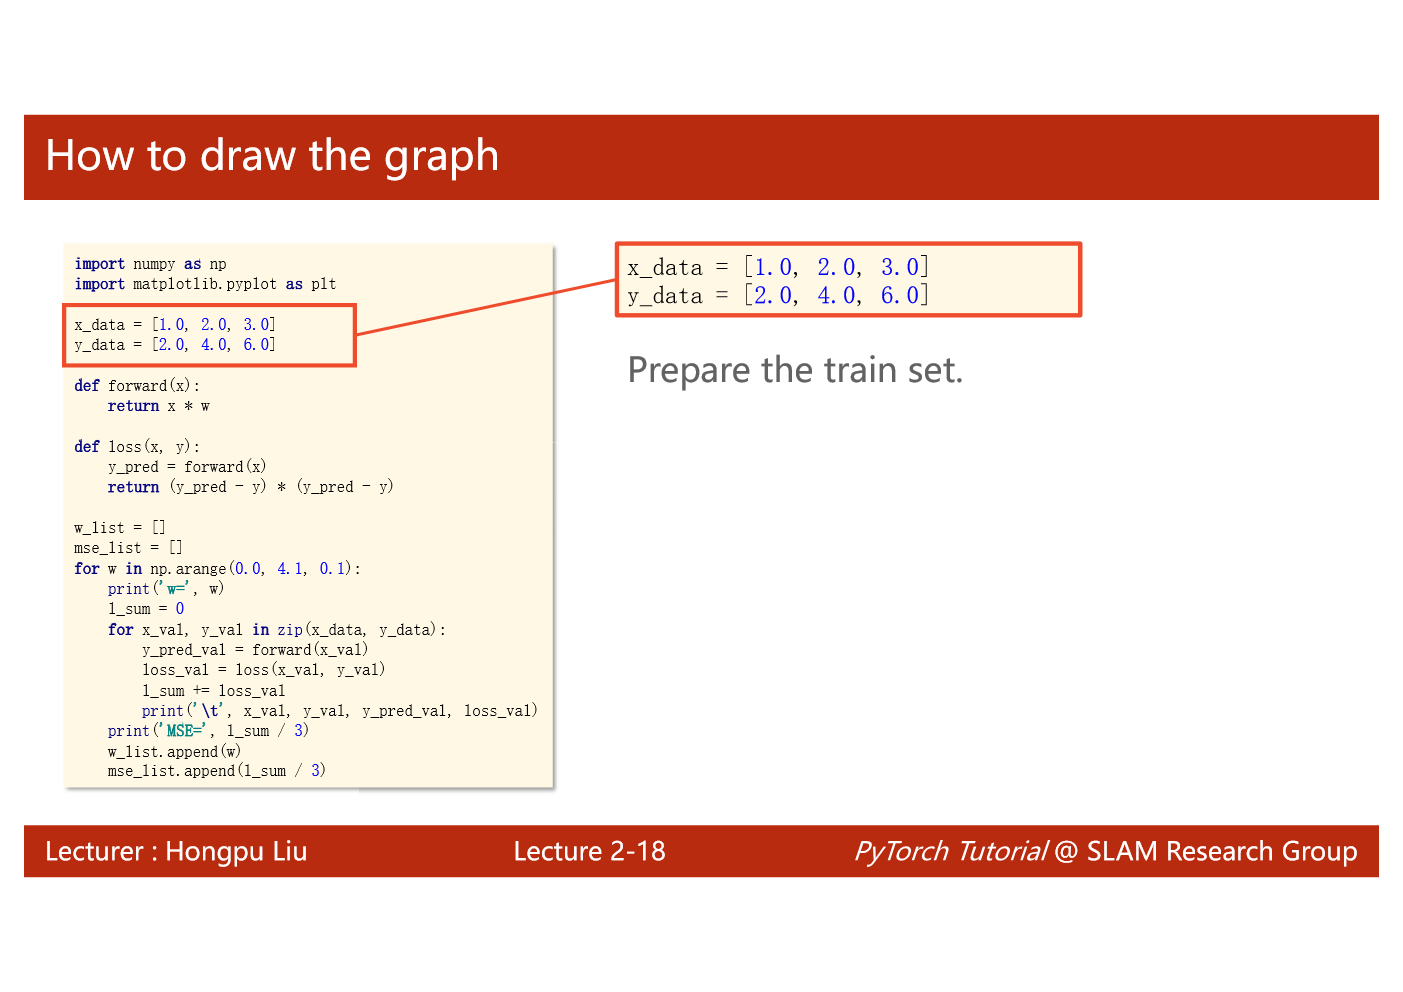
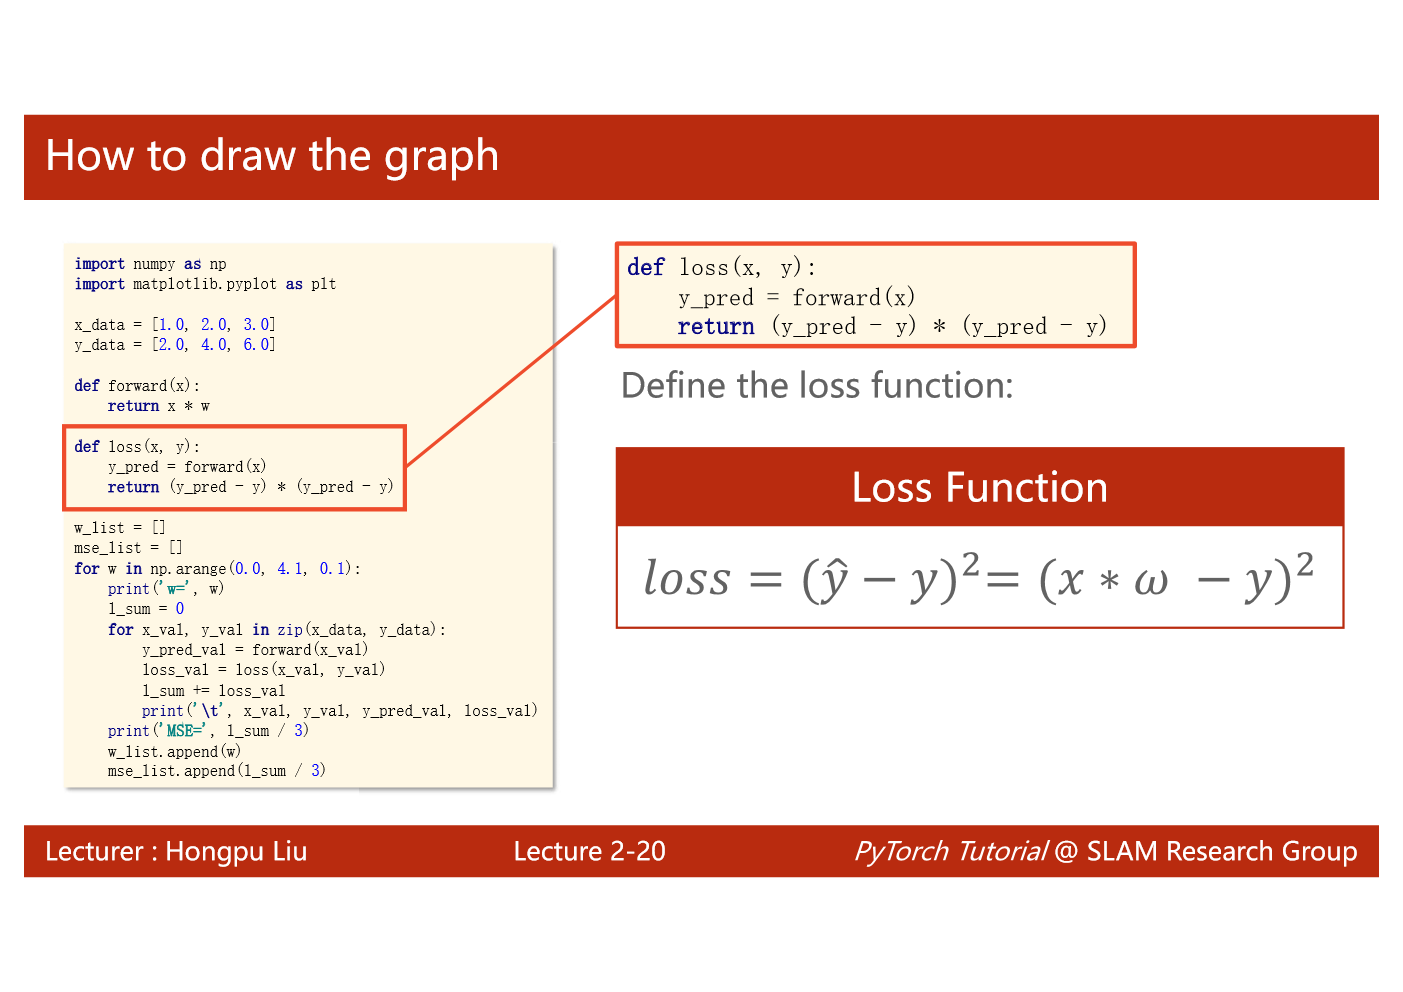
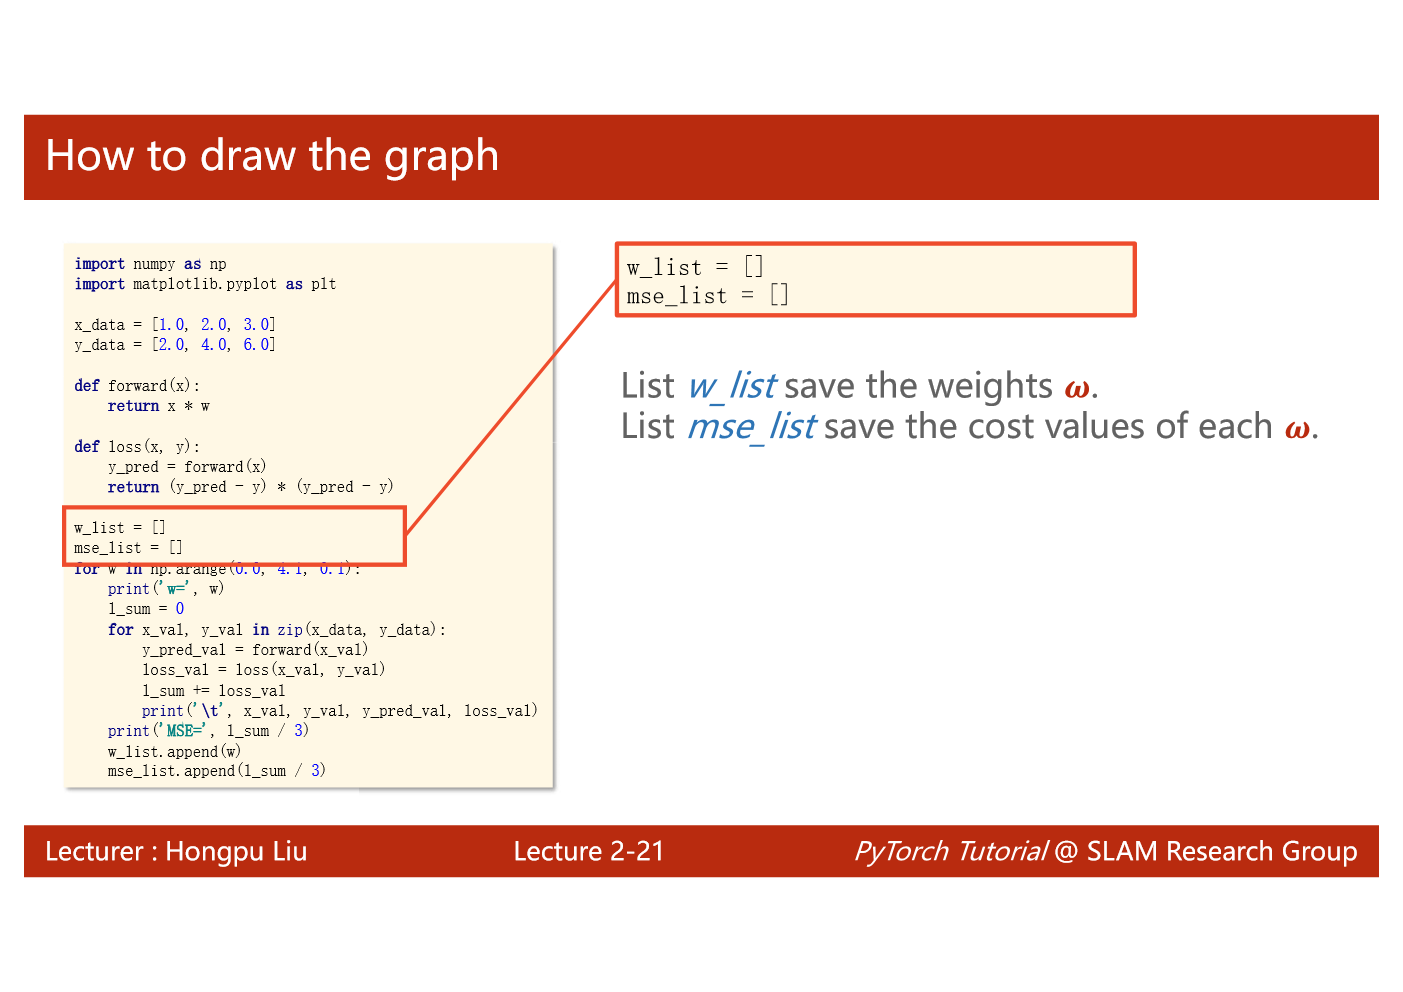
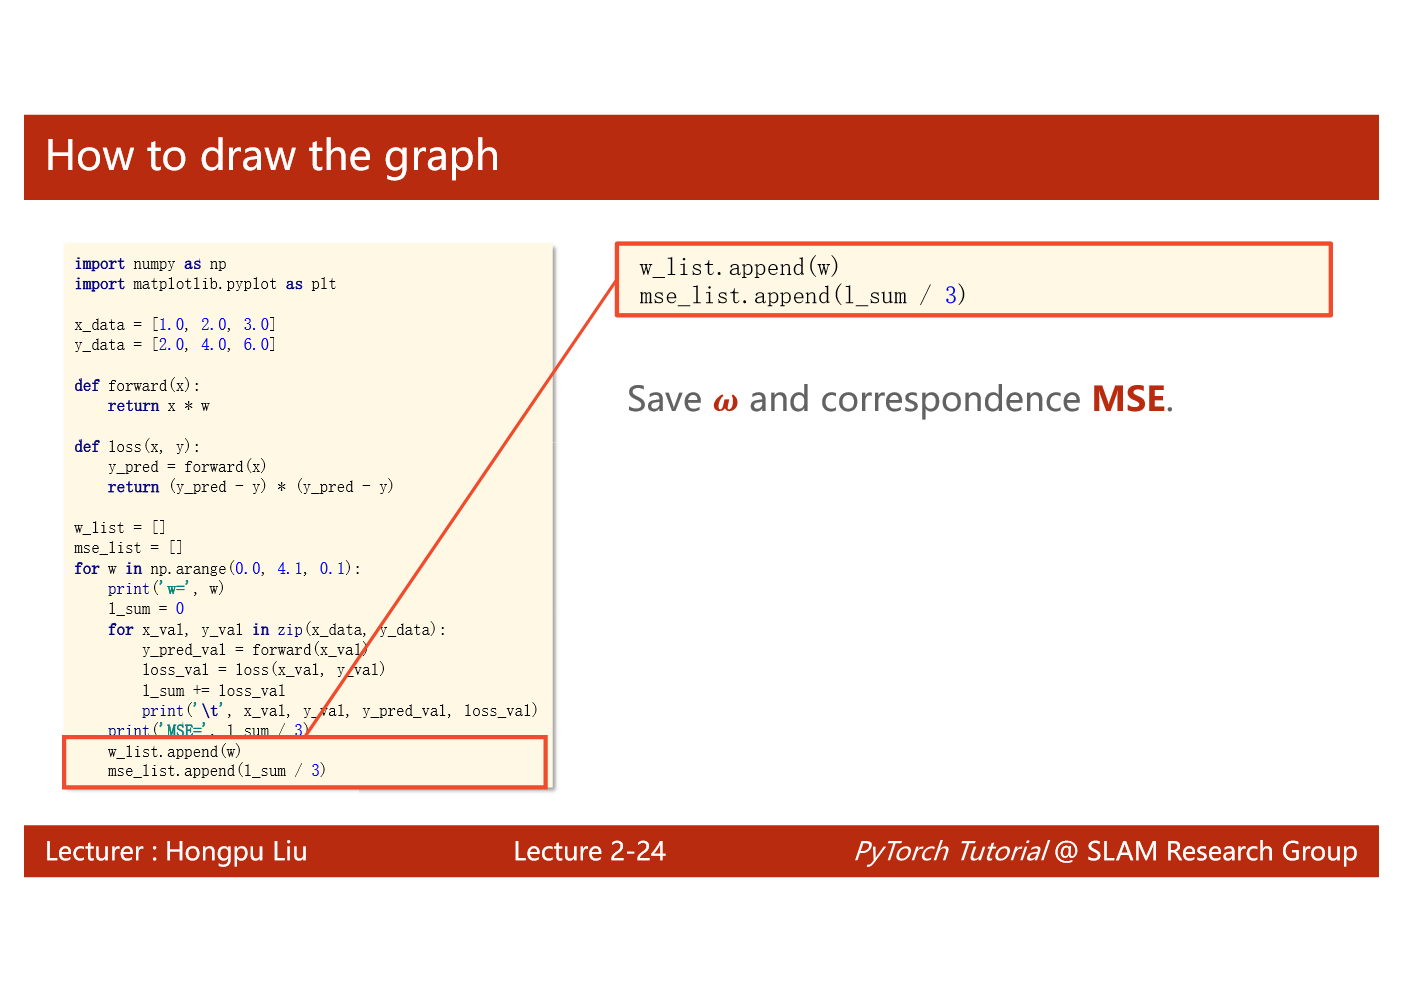
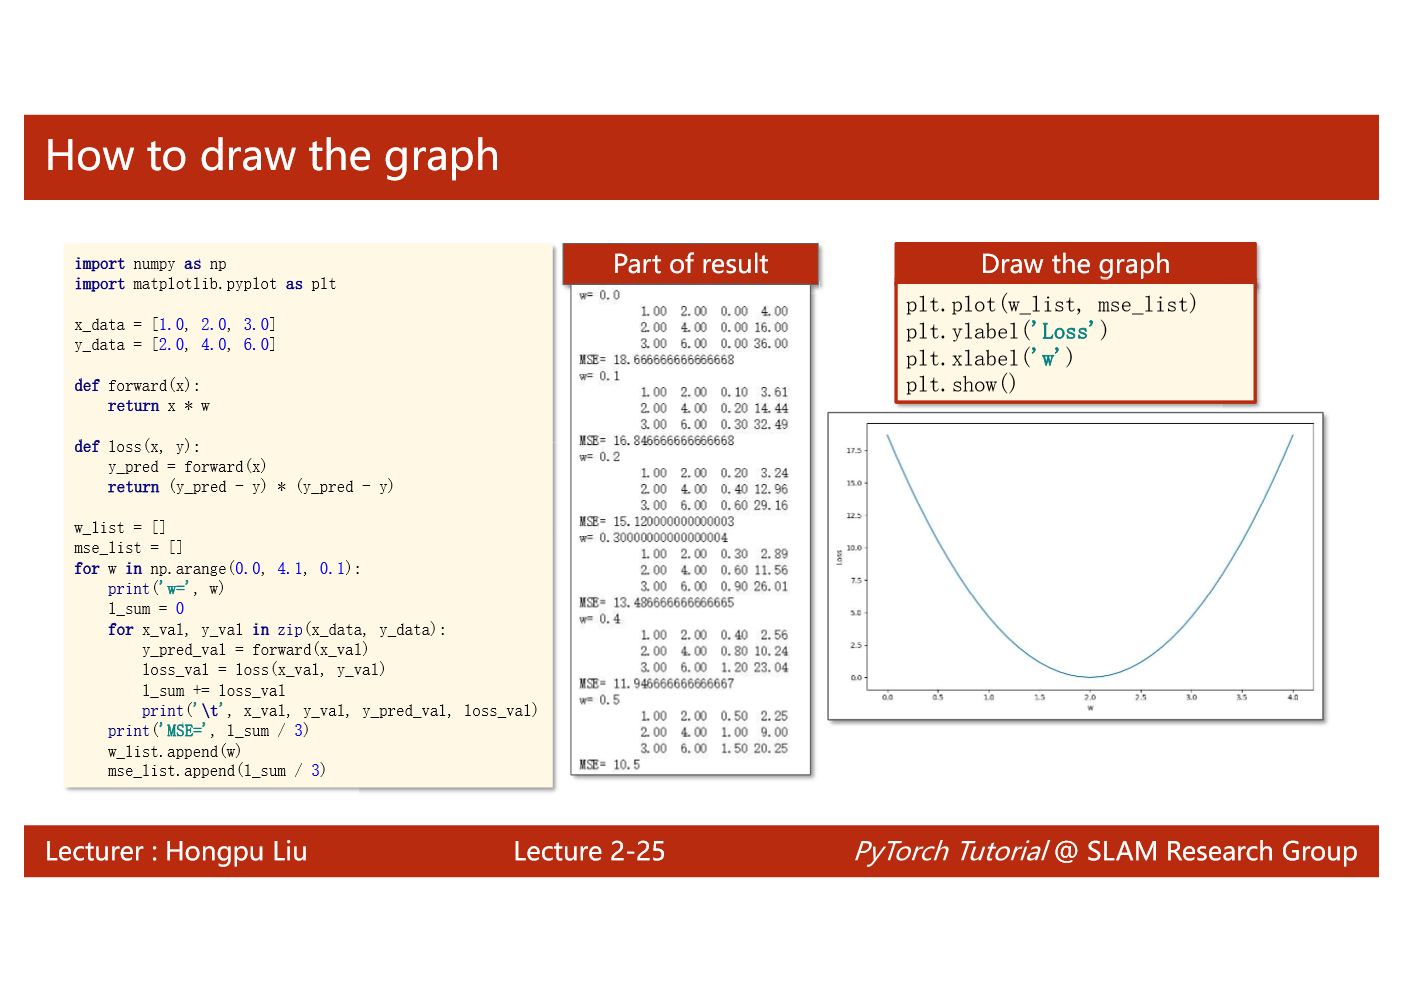
import numpy as npimport matplotlib.pyplot as pltx_data = [1.0, 2.0, 3.0]y_data = [2.0, 4.0, 6.0]def forward(x):return x*wdef loss(x, y):y_pred = forward(x)return (y_pred - y)**2# 穷举法w_list = []mse_list = []for w in np.arange(0.0, 4.1, 0.1):print("w=", w)l_sum = 0for x_val, y_val in zip(x_data, y_data):y_pred_val = forward(x_val)loss_val = loss(x_val, y_val)l_sum += loss_valprint('\t', x_val, y_val, y_pred_val, loss_val)print('MSE=', l_sum/3)w_list.append(w)mse_list.append(l_sum/3)plt.plot(w_list,mse_list)plt.ylabel('Loss')plt.xlabel('w')plt.show()
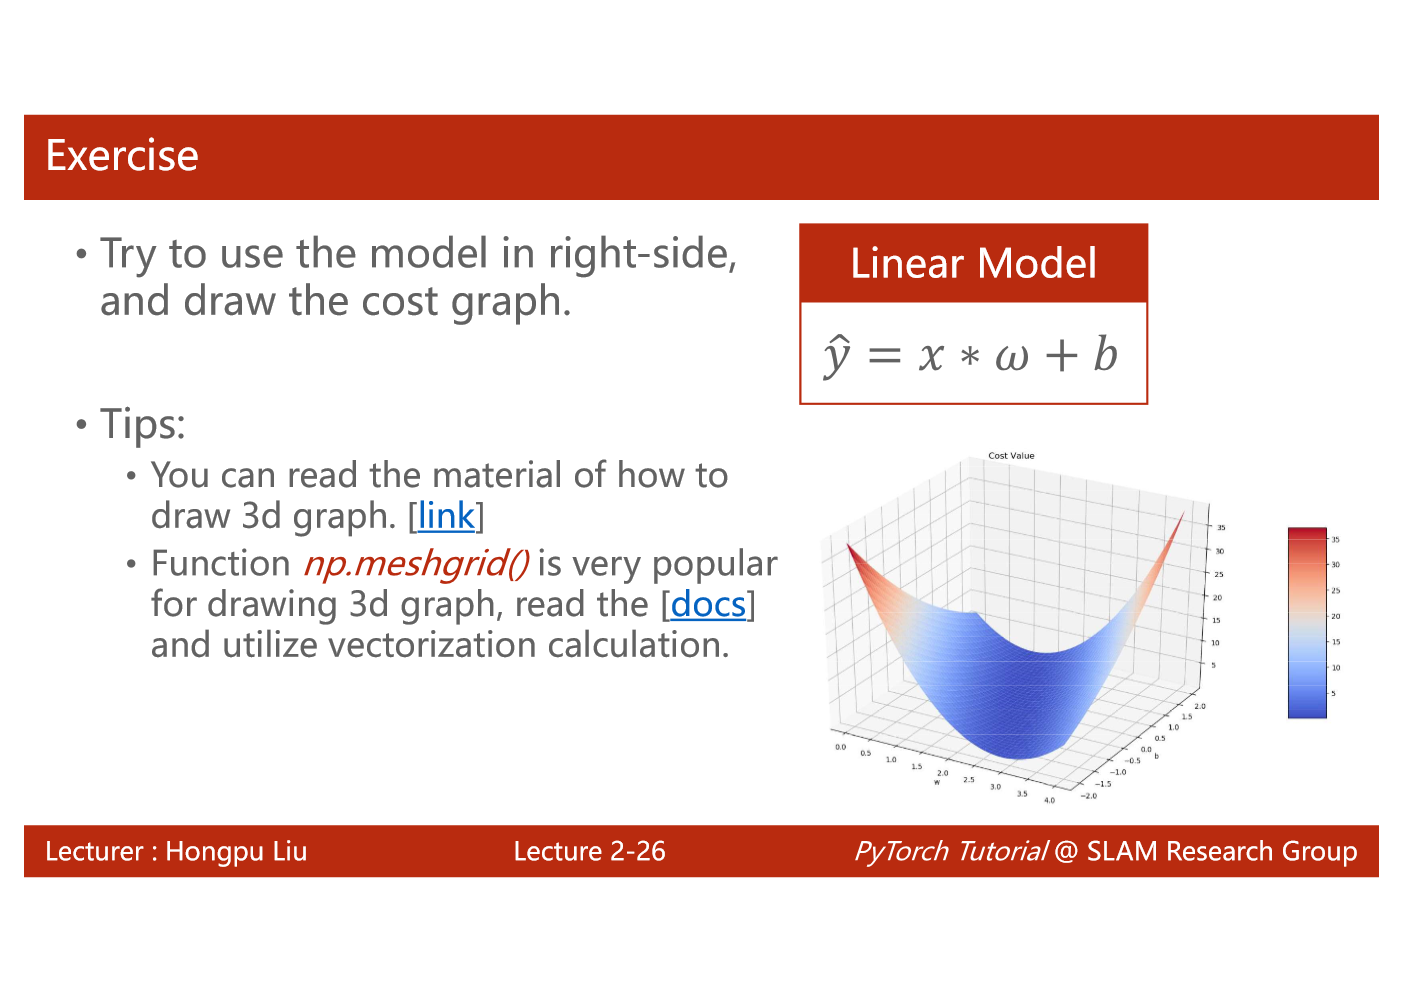
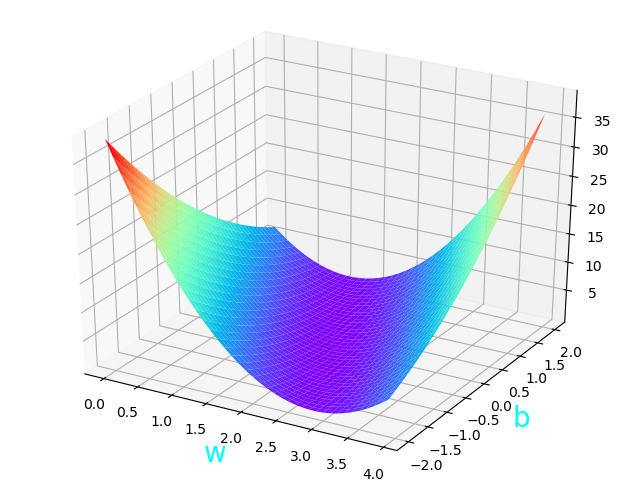
# Numpyimport numpy# For plottingimport matplotlib.pyplot as pltfrom matplotlib import cmfrom mpl_toolkits.mplot3d import Axes3Dx_data = [1.0, 2.0, 3.0]y_data = [2.0, 4.0, 6.0]def forward(w: numpy.ndarray, b: numpy.ndarray, x: float) -> numpy.ndarray:return w * x + bdef loss(y_hat: numpy.ndarray, y: float) -> numpy.ndarray:return (y_hat - y) ** 2w_cor = numpy.arange(0.0, 4.0, 0.1)b_cor = numpy.arange(-2.0, 2.1, 0.1)# 此处直接使用矩阵进行计算w, b = numpy.meshgrid(w_cor, b_cor)mse = numpy.zeros(w.shape)for x, y in zip(x_data, y_data):_y = forward(w, b, x)mse += loss(_y, y)mse /= len(x_data)h = plt.contourf(w, b, mse)fig = plt.figure()ax = Axes3D(fig)plt.xlabel(r'w', fontsize=20, color='cyan')plt.ylabel(r'b', fontsize=20, color='cyan')ax.plot_surface(w, b, mse, rstride=1, cstride=1, cmap=plt.get_cmap('rainbow'))plt.show()


若有收获,就点个赞吧
0 人点赞
