很多程序员在调试代码时都喜欢 print 一些内容,这样看起来更直观,print 完之后又很容易忘记删除掉这些没用的内容,最终将代码提交到 remote,code review 时又不得不删减这些内容重新提交,不但增加不必要的工作量,还让 log tree 的一些节点没有任何价值
IntelliJ IDEA 提供 Evaluate and Log at Breakpoints 功能恰巧可以帮助我们解决这个问题, 来看下面代码:
public static void main(String[] args) {ThreadLocalRandom random = ThreadLocalRandom.current();int count = 0;for (int i = 0; i < 5; i++) {if (isInterested(random.nextInt(10))) {count++;}}System.out.printf("Found %d interested values%n", count);}private static boolean isInterested(int i) {return i % 2 == 0;}
假如我们想在第 15 行查看每次调用,随即出来的 i 的值到底是多少,我们没必要在这个地方添加任何 log,在正常加断点的地方使用快捷键 Shift + 鼠标左键,就会弹出下面的内容
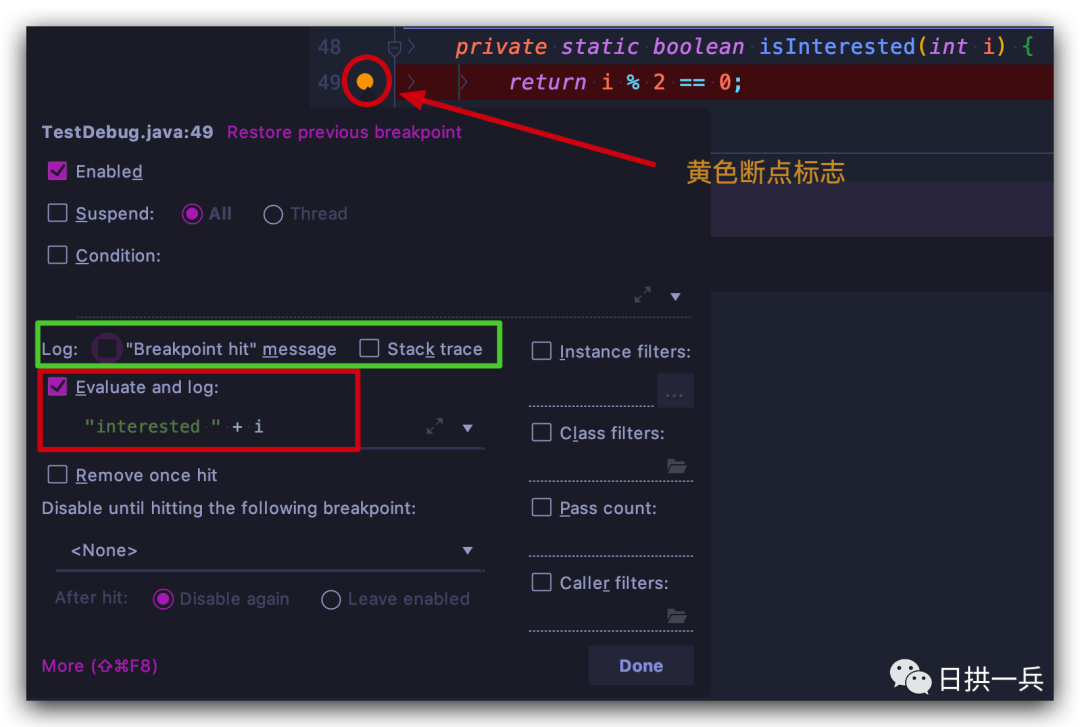
勾选上 Evaluate and log, 并自定义你想查看的 log / 变量,比如这里的 "interested" + i, 这样以 Debug 模式运行程序(正常模式运行,不会打印这些 log):
interested 7interested 5interested 1interested 2interested 0Found 2 interested values
如果你在多处添加了这种断点,简单的看 log 可能偶尔还是不够直观,可以勾选上面图片绿色框线的 "Breakpoint hit" message :
Breakpoint reached at top.dayarch.TestDebug.isInterested(TestDebug.java:49)interested 6Breakpoint reached at top.dayarch.TestDebug.isInterested(TestDebug.java:49)interested 0Breakpoint reached at top.dayarch.TestDebug.isInterested(TestDebug.java:49)interested 9Breakpoint reached at top.dayarch.TestDebug.isInterested(TestDebug.java:49)interested 8Breakpoint reached at top.dayarch.TestDebug.isInterested(TestDebug.java:49)interested 1Found 3 interested valuesDisconnected from the target VM, address: '127.0.0.1:0', transport: 'socket'Process finished with exit code
如果你想要更详细的信息,那就勾选上 Stack trace (大家自己查看运行结果吧),有了这个功能,上面说的一些问题都不复存在了

若有收获,就点个赞吧
0 人点赞
