前言:昨天已经大概介绍了Promethus+Grafana如何搭建,今天继续讲下Promethus报警如何设置,Promethus通过AlertManager实现报警。
一、安装AlertManager
AlertMnager安装方式基本同exporter,解压,修改配置文件,启动即可,下载地址:https://github.com/prometheus/alertmanager/releases/download/v0.15.1/alertmanager-0.15.1.linux-amd64.tar.gz
二、配置文件
alertmanager的配置文件目录在解压出来的文件夹内,我这里的路径在/usr/local/alertmanager/alertmanager.yml,配置如下:
[root@db-monitor-01 alertmanager]# cat alertmanager.ymlglobal:smtp_smarthost: 'xxx:25'smtp_from: 'xxx@8531.cn'smtp_auth_username: 'xxx@8531.cn'smtp_auth_password: 'xxx'smtp_require_tls: falsetemplates:- '/usr/local/alertmanager/template/*.tmpl'route:group_by: ['alertname']repeat_interval: 1mreceiver: xuclreceivers:- name: 'xucl'email_configs:- to: 'xxx@8531.cn'html: '{{ template "alert.html" . }}'headers: { Subject: " {{ .CommonAnnotations.summary }}" }
三、告警规则
memory_over.yml
[root@db-monitor-01 rules]# cat /usr/local/prometheus/rules/memory_over.ymlgroups:- name: NodeMemoryUsagerules:- alert: NodeMemoryUsageexpr: round((node_memory_MemTotal_bytes - (node_memory_MemFree_bytes+node_memory_Buffers_bytes+node_memory_Cached_bytes )) / node_memory_MemTotal_bytes * 100) > 80for: 1mlabels:user: xuclannotations:summary: "{{$labels.instance}}: High Memory usage detected"description: "{{$labels.instance}}: Memory usage is above 80% (current value is:{{ $value }})"value: "{{ $value }}"
node_down.yml
[root@db-monitor-01 rules]# cat /usr/local/prometheus/rules/node_down.ymlgroups:- name: InstanceDownrules:- alert: InstanceDownexpr: up == 0for: 1mlabels:user: xuclannotations:summary: "Instance {{ $labels.instance }} down"description: "{{ $labels.instance }} of job {{ $labels.job }} has been down for more than 1 minutes."
四、修改promethus配置文件
在原先的promethus.yml最后增加如下
alerting:alertmanagers:- static_configs:- targets: ["localhost:9093"]rule_files:- "rules/memory_over.yml"- "rules/node_down.yml"
五、模板文件
[root@db-monitor-01 template]# cat /usr/local/alertmanager/template/alert.tmpl{{ define "alert.html" }}<style type="text/css">table{border-collapse: collapse;margin: 0 auto;text-align: center;}table td, table th{border: 1px solid #cad9ea;color: #666;height: 30px;}table thead th{background-color: #CCE8EB;width: 100px;}table tr:nth-child(odd){background: #fff;}table tr:nth-child(even){background: #F5FAFA;}</style><table width="90%" class="table"><tr><td>报警项</td><td>主机</td><td>报警阀值</td><td>开始时间</td></tr>{{ range $i, $alert := .Alerts }}<tr><td>{{ index $alert.Labels "alertname" }}</td><td>{{ index $alert.Labels "instance" }}</td><td>{{ index $alert.Annotations "value" }}</td><td>{{ $alert.StartsAt }}</td></tr>{{ end }}</table>{{ end }}
六、启动测试
首先启动AlertManager
然后启动Promethus
./alertmanager --log.level=debug./prometheus --config.file=prometheus.yml --storage.tsdb.path="/storage/data" --storage.tsdb.retention=30d
登陆平台查看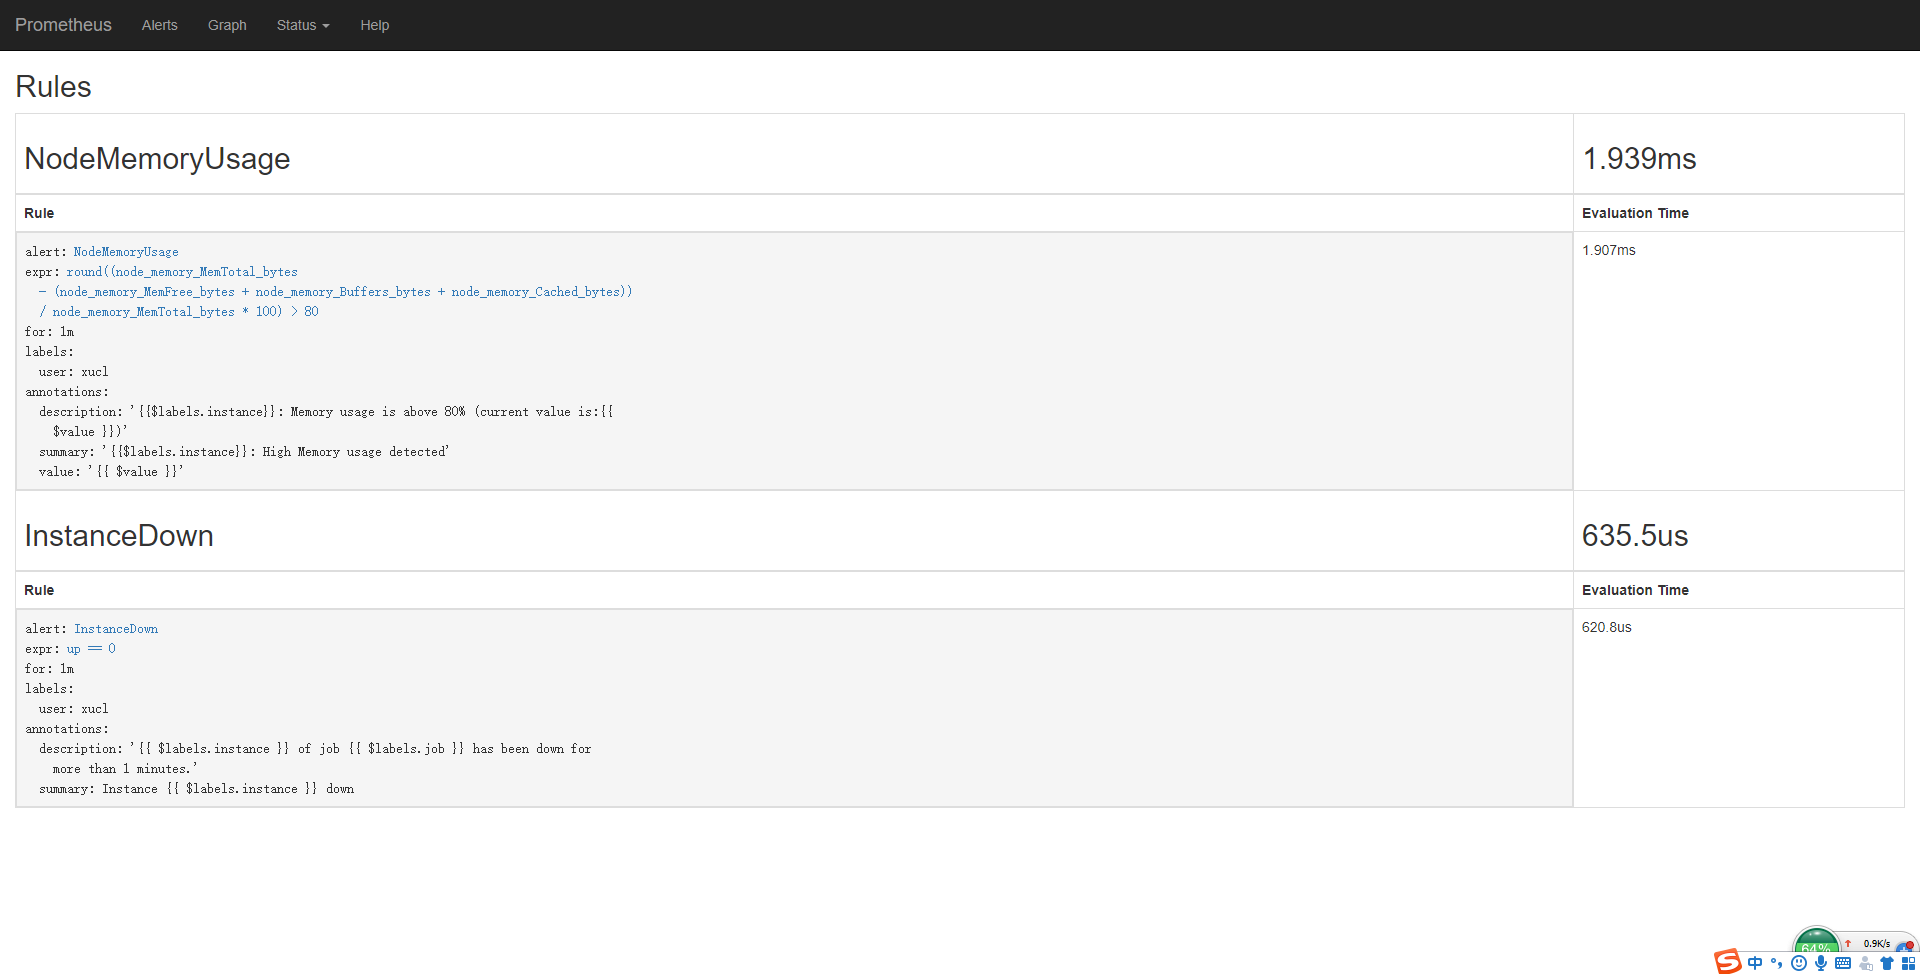
看到报警规则已经生效
再看下报警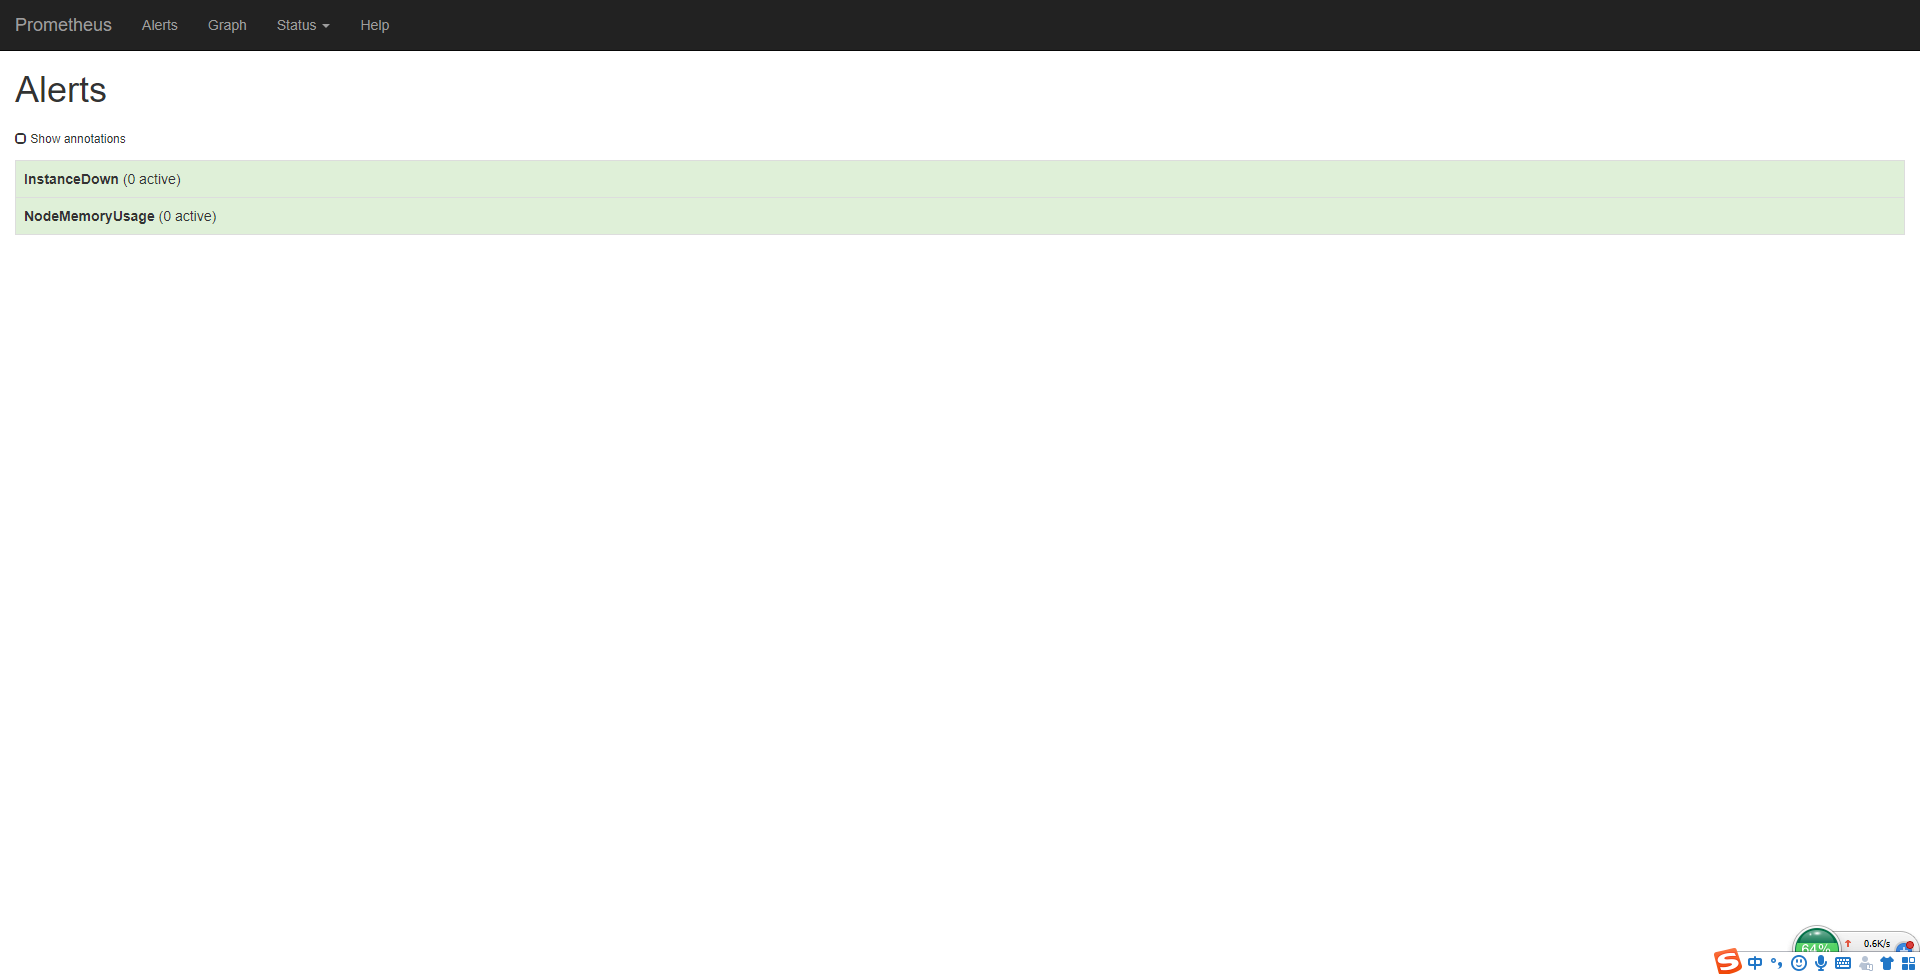
可以尝试调低一点阈值,收到报警邮件如下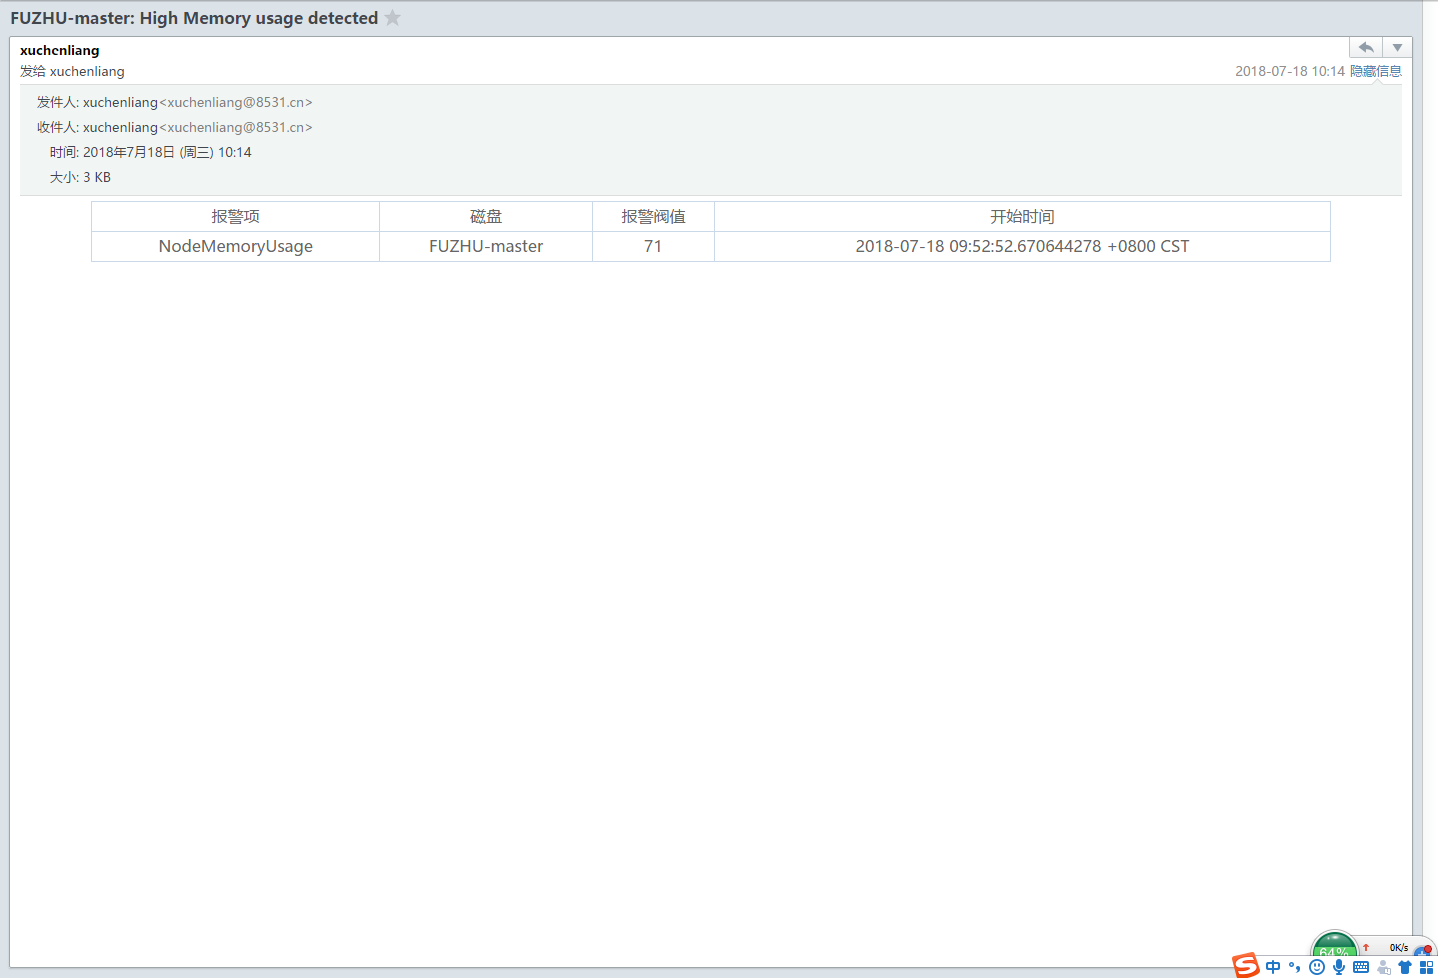

若有收获,就点个赞吧
0 人点赞
