1、描述性统计学、推断性统计学
- Descriptive statistics(描述性统计学)
- Quantitatively describe or summarize the important features of large data sets.
- 当拿到一组数据之后,分析这组数据的特征,有 4 个维度:
- mean(均值):看数据在哪个数的周围,衡量中心趋势
- variance(方差):看数据的离散程度,是比较集中,还是比较分散?
- skewness(偏度):画图、看数据的对称程度,对称?偏左?偏右?
- kurtosis(峰度):数据的最大部分的值
- 偏向于对数据的描述、统计分析(descriptive)
Inferential statistics(推断性统计学)
数据抽出来后,需要分类别,以下介绍 4 种类型(知道对应的特征即可)。
- Nominal Scales
- Distinguishing two different things, no order, only has mode.
- 定义类别而已,如把男生定义为 1,女生定义为 2(不能比较大小)
- Ordinal scales(>、<)
- Making things in order(排序), but the difference are not meaningful.
- 如:ranking mutual funds based on their five-year cumulative returns, we might assign the number top-1 to 10 for the funds performance.
- Interval scales(>、<、+、-)
- Subtract is meaningful
- 间隔、间距,在排序的基础上可进行加减运算(但不能乘除、算比例)
- 如:温度(temperature),哈尔滨温度 -10,北京 0,上海 10
Ratio Scales(>、<、+、-、*、/)
population(总体)
- A population is defined as all members of a specified group.
- A parameter is used to describe the features of a population.
- 描述总体的方差、均值等,均叫总体的参数
- sample(样本)
- A sample is a subset of a population.
- A sample statistic is used to describes the features of a sample.
- 描述样本的方差、均值等,叫样本的统计量
- sample size:样本的大小
- 如抽样 100 人统计平均身高,则样本有 1 个,样本的大小为 100
- frequency distribution(频率分布)
- 示例-1:
- 假设统计全班 20 人的身高分布,大致为 150-180
- 150-160:10
- 160-170:5
- 170-180:5
- 以上分三组,每组间隔为 10,每一组的间隔称 relative interval
- 每组的人数即为绝对频率(absolute frequency)
- 每组人数在总体的占比即相对频率(relative frequency),代表相对占比情况
- 假设统计全班 20 人的身高分布,大致为 150-180
- 示例-2:
- 示例-1:

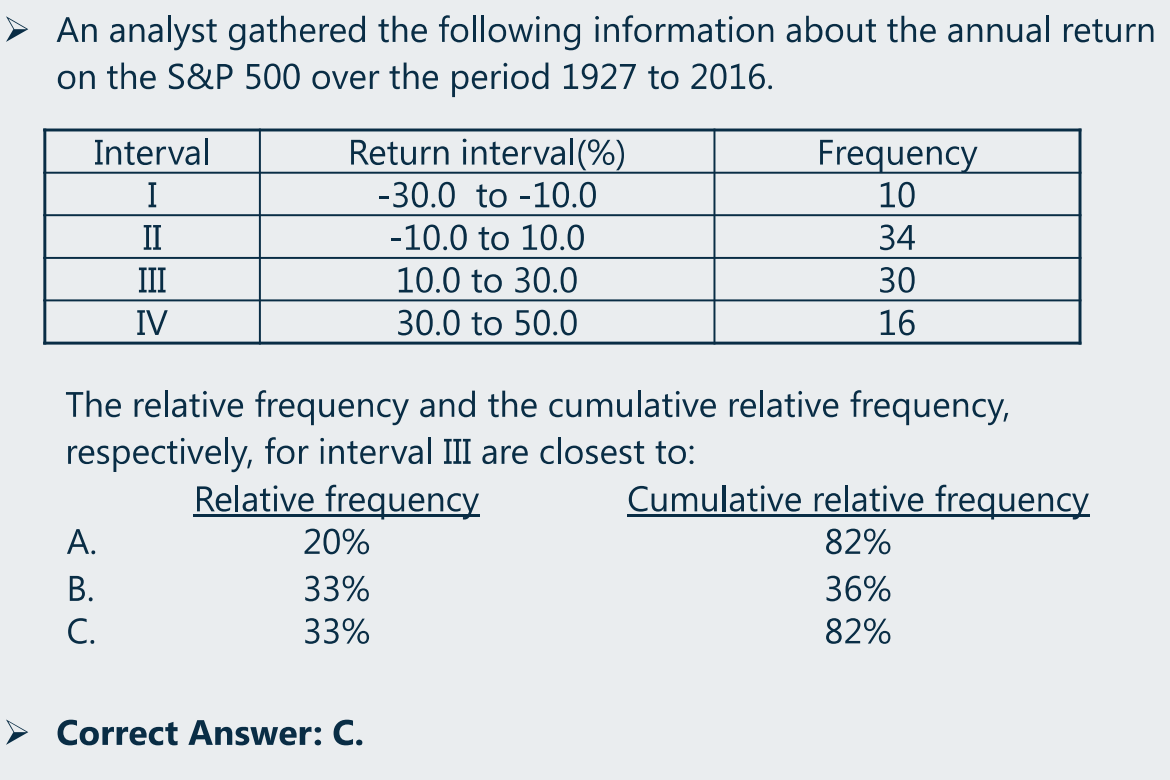
- Relative frequency
- The relative frequency of observations in an interval is the number of observations(the absolute frequency)in the interval divided by the total number of observations.
- Frequency Distribution
- A frequency distribution is a tabular display of data summarized into a relatively small number of intervals.
- Frequency distributions permit analyst to evaluate how data are distributed.
- Cumulative frequency、Cumulative Relative Frequency
- The cumulative relative frequency cumulates(adds up)the relative frequencies as we move from the first interval to the last.
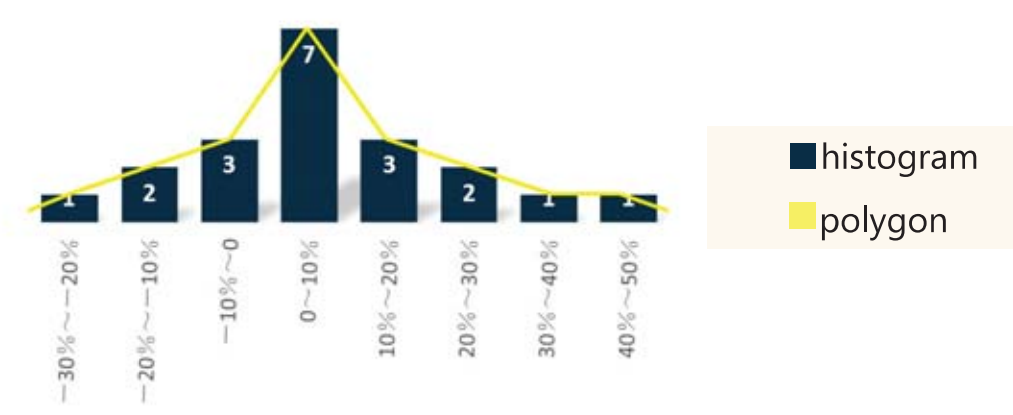
- Histogram and Polygon
- The cumulative relative frequency cumulates(adds up)the relative frequencies as we move from the first interval to the last.
- A histogram is a bar chart of data that have been grouped into a frequency distribution.
- A frequency polygon is a graph of frequency distributions obtained by drawing straight lines joining successive points representing the class frequencies.
4、各种统计指标(均值等)、应用
- mode:众数(出现次数最多的数)
- median:中位数(排序后取中间值)
- mean:均值,有多种均值衡量方式
- Arithmetic mean(算术平均)

- 每个数值的权重均为

- Weighted mean(加权平均)

- 算术平均为加权平均的特例
- Geometric mean(几何平均)

- 主要用于收益率计算

- 收益率加 1,随后开根号后减 1
- Harmonic mean(调和平均)

- 应用:假设购买 3 只股票,每只购买相同的金额 1,但每只股票的股价各不相同,分别为 P1、P2、P3,现在想计算花了 3 块钱购买股票的平均股价是多少?
- 总体思路:平均股价 = 花的金额总数/购买到的总的股票份额

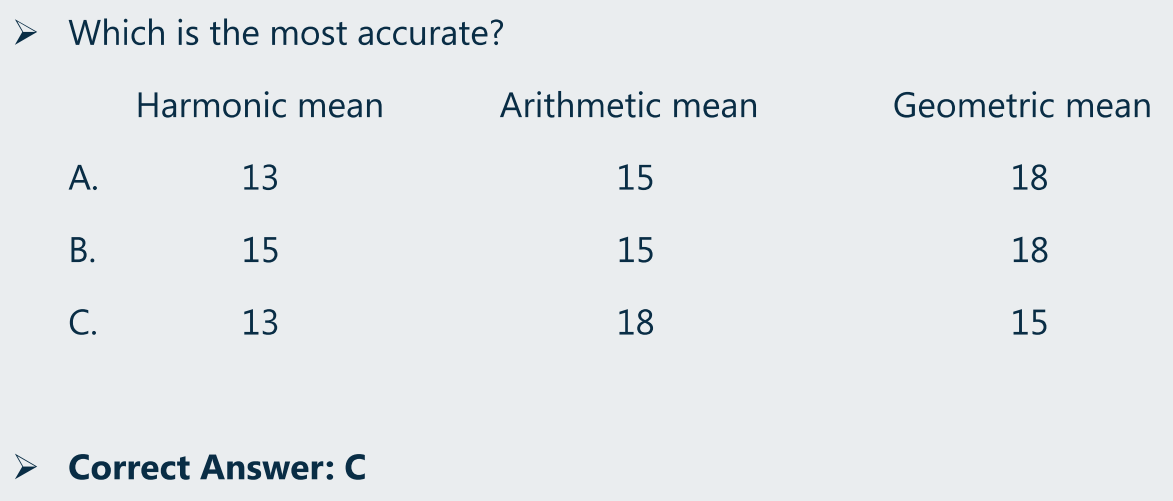
- 不同均值之间的关系:
- Harmonic mean <= Geometric mean <= Arithmetic mean
- 当且仅当数值
 均相同时,三个值相等
 - 记忆技巧:A >= G >= H(英文字母顺序倒过来)
- Arithmetic mean(算术平均)
The use of arithmetic mean and geometric mean when determining investment returns.
- The arithmetic mean is the statistically best extimator of the next year’s returns given only the three years of return outcomes.
- Since past annual returns are compounded each period, the geometric mean of past annual returns is the appropriate measure of past performance.
类别
- Quartile(四分位)
- 第 3 个四分位数:排序后,分四份,从左往右的第 3 份的某位数,该数的左边包含了 75% 的数。
- Quintile(五分位),常考,因为该单词最不常见
- The third quintile:60%,即排序后,某数的左边的个数占总个数的 60%,该数即为第 3 个五分位数
- Deciles(十分位)
- Percentile(百分位)
- Quartile(四分位)
相关计算:
Absolute dispersion(离散程度)
- the amount of variability present without comparison to any reference point or benchmark.
- Range(衡量数值范围)
- Range = maximum value - minumum value
- Mean Absolute Deviation

- 代表偏离均值的绝对偏离情况
- 注意:金融计算器没办法计算绝对值
- Variance(方差)、Standard deviation
- For population(总体)
- 方差:

- 标准差:
 (方差结果开根号)
- 方差:
- For sample(样本)
- 方差:

- 标准差:
 (方差结果开根号)
- 方差:
- 通常,方差/标准差衡量的是绝对离散程度,后面介绍的 CV 是衡量相对离散程度
- 通常使用样本方差来估计总体方差,样本方差叫做总体方差的无偏估计量,一个好的估计量要符合三个性质,其中一个叫无偏性。由于统计学家发现,求样本方差时,除以
 是最接近总体方差的,因此求样本方差时就都除以
 。
。 - 同时,
 的自由度为
的自由度为 。
。- 自由度(degree of freedom):一组数据中,必须确定多少个数才能使得这组数据稳定,确定的数的个数即自由度。如:已知 3 数的均值为
 ,此时已经抽取两个数了,由于均值已知,抽取两个数之后,即可确定第 3 个数了,这是抽取的个数为 2 即为这组数的自由度。
- 自由度(degree of freedom):一组数据中,必须确定多少个数才能使得这组数据稳定,确定的数的个数即自由度。如:已知 3 数的均值为
- 金融计算器计算方差、标准差
- 2ND + 7(即 DATA),可以看到 X01 提示
- 2ND + CE|C(清零,因为之前可能有相关数据)
- 输入数值,然后按 ENTER,随后按下向下箭头会看到 Y01,暂时不管,是线性回归相关,继续按向下箭头,输入新数值即可。
- 最后,按 2ND + 8(即 STAT),随后按向下箭头,即可看到总个数、均值、样本的标准差(如果这组数据是样本数据)、总体的标准差(如果这组数据已经是总体数据)
- For population(总体)
Semivariance、Target Semivariance
均为均值、标准差的结合
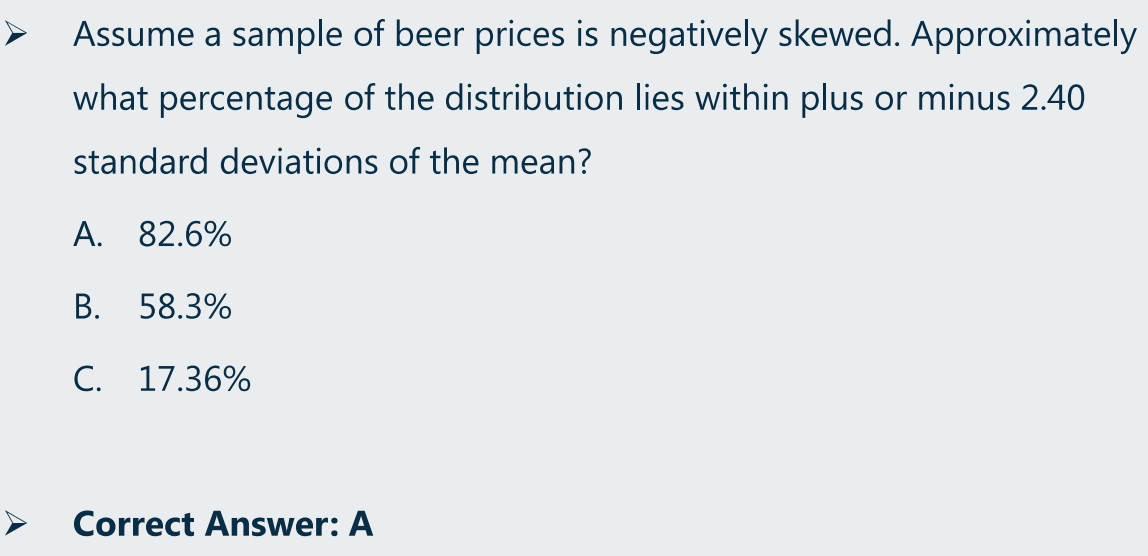
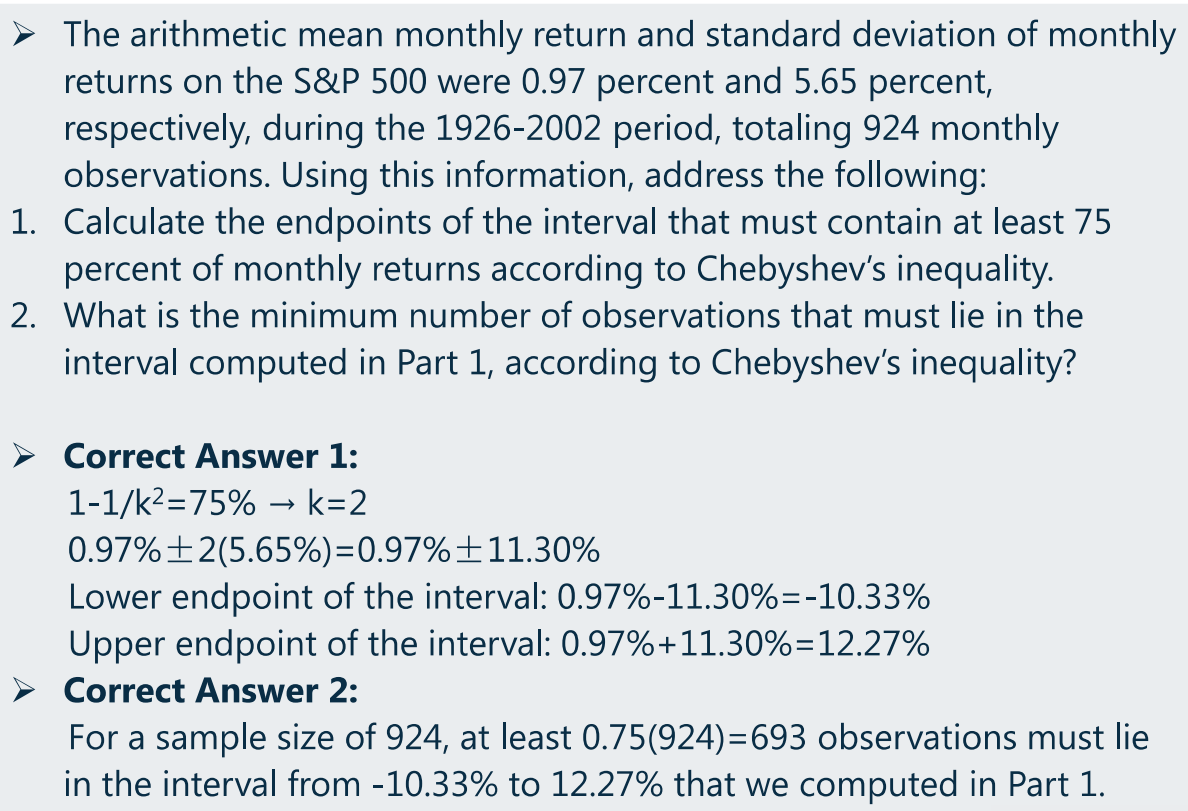
- 切比雪夫不等式
- For any set of observations(samples or population),the proportion of the values that lie within
 standard deviations of the mean is at least
 ,where
 is any constant greater than 1.
- 对于任何一组观测值,个体落在均值周围
 个标准差之内的概率不小于
 (对任意一个
 的数均成立)。
- 个体:

- 均值:

- 标准差:

- 个体:
- 对于任何一组观测值,个体落在均值周围
- This relationship applies regardless of the shape of the distribution(对于任何分布,该结论均成立)
- 该不等式表明,对于大部分数,都在均值周围,极端情况都是小概率
- 考试常见考法:
- 已知
 ,求最小概率(即
 )
) - 已知
 、
、 和最小概率(即已知
 ),求范围(即:
 )
) - 已知总体个数、范围、
 和
和 (即可求
(即可求 ),求在该范围内的个数至少是多少(即:总个数 * 最小概率)
- 已知
- For any set of observations(samples or population),the proportion of the values that lie within
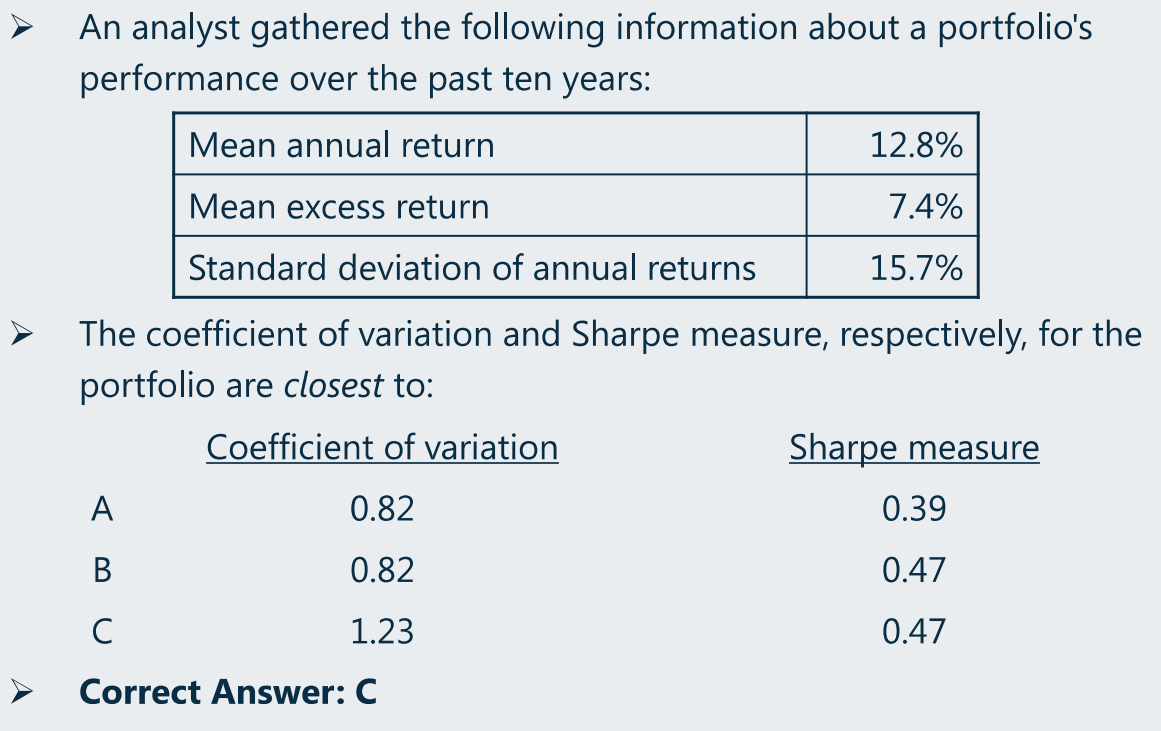
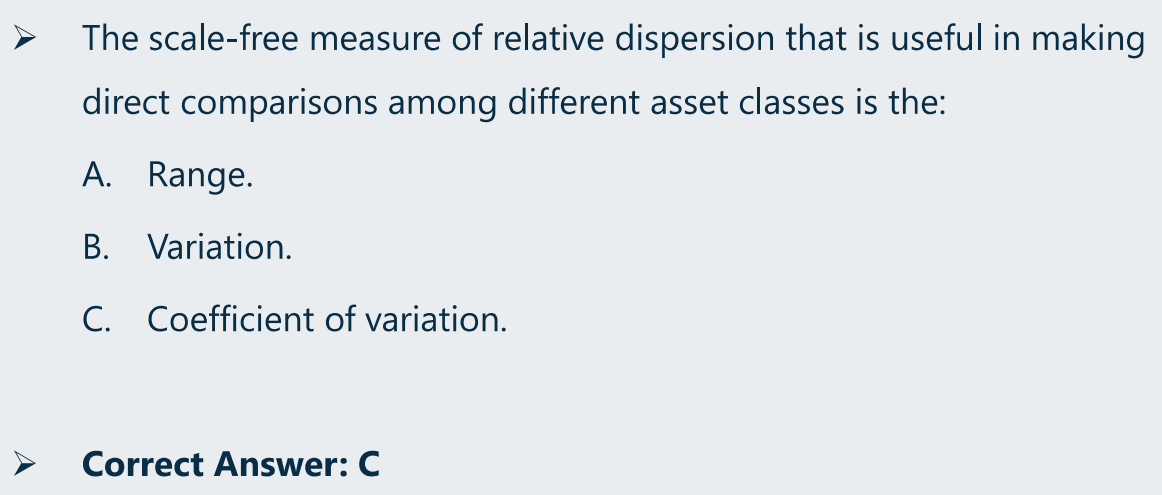
- Coefficient of variation(变异系数)
- measures the amount of dispersion in a distribution(即标准差)relative to the distribution’s mean.(relative dispersion)

- 示例:
- 要求修一段平均 1002 米的路,给三次机会
- 1001、1002、1003
- 要求修一段平均 2 米的路,给三次机会
- 1、2、3
- 以上两者均达到要求,现在评判下,哪个更好?
- 当然是上一个更好
- 使用计算器计算可发现,两组数据的方差/标准差是一样的(即离散程度一样)
- 可见,方差/标准差并不体现规模程度,CV 计算公式即可体现(用均值表示规模)
- 要求修一段平均 1002 米的路,给三次机会
- CV 性质:
- scale-free(剔除了规模因素)
- 衡量的是相对于均值的离散程度(即 relative dispersion,相对离散程度)
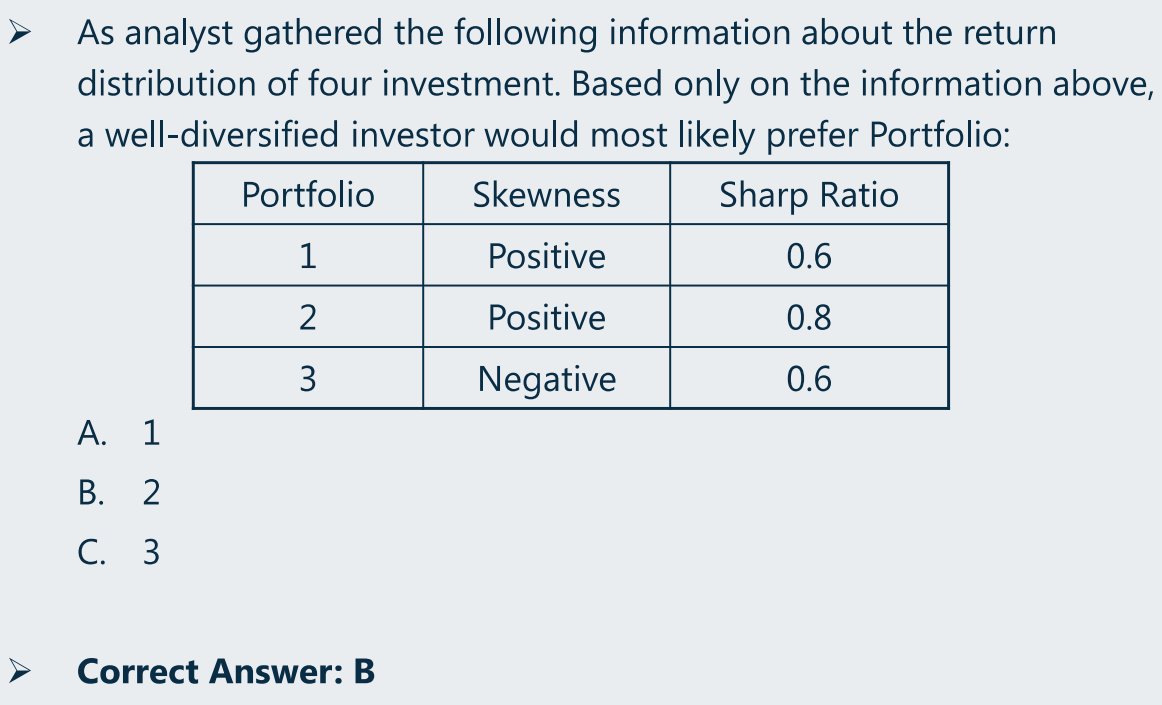
sharp ratio(夏普比率)
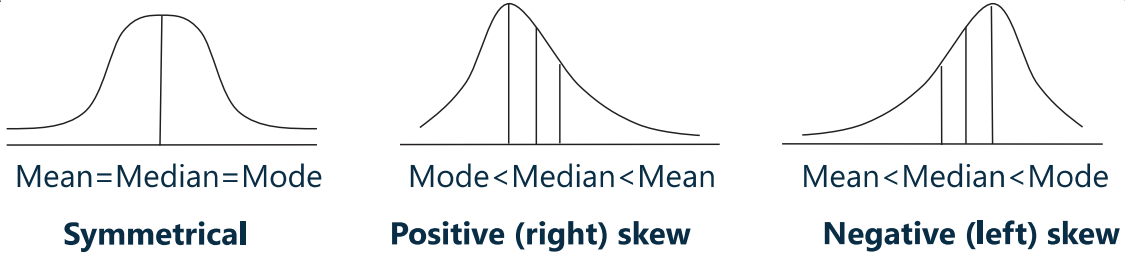
skew(偏度)是最常考的概念
- 判断左偏还是右偏
- 看哪边有长长的尾巴,即往哪偏(如右边有长长尾巴,即为右偏)
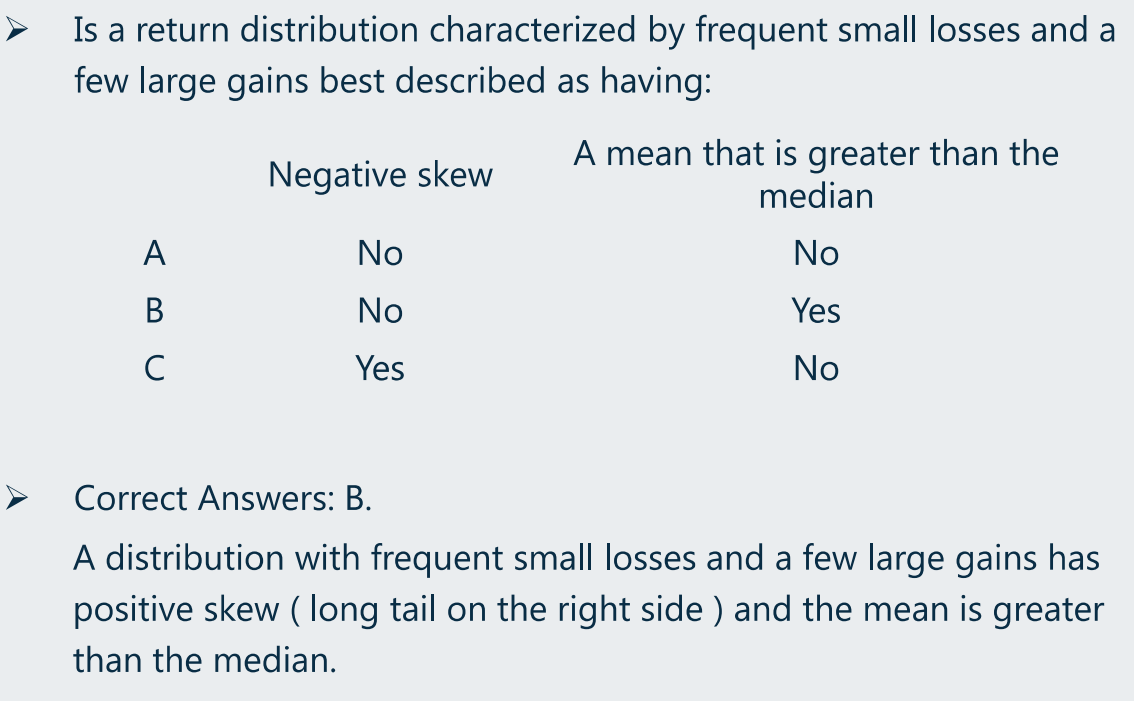
- 右偏的偏度大于 0(Positive skewed)
- A return distribution with positive skew has frequent small losses and a few extreme gains.
- 坐标轴右侧的值更大,公式计算得到时,更偏向于正数
- 右偏的均值也最大,故有:
- Mode(众数)< Median(中位数)< Mean(均值)
- 左偏的偏度小于 0(negative skewed)
- A return distribution with negative skew has frequent small gains and a few extreme losses.
- 坐标轴左侧的值更小,公式计算得到时,更偏向于小的数
- 左偏的情况与右偏相反:
- Mode(众数)> Median(中位数)> Mean(均值)
- 假设一支股票的收益率分布如下:
- -30%、10%、10%、10%
- 是左偏还是右偏?(数据已有,最好还是依据计算结果判断)
- mode:10%
- mean:0%
- mean > mode,即左偏
- Investors should be attracted by a positive skew because the mean return falls above the median.
样本(Sample)的偏度计算公式(不考,了解):
It deals with whether or not a distribution is more or less “peaked” than a normal distribution.
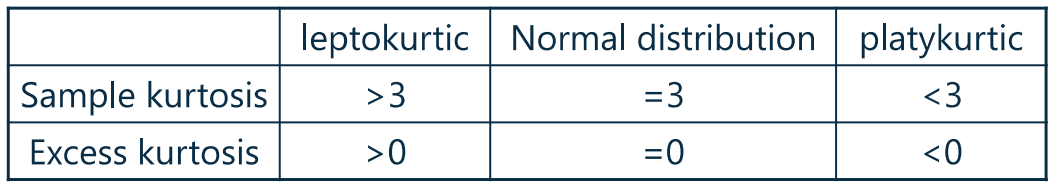
- Kurtosis(峰度)通常是与正太分布进行对比的:
- 正太分布的峰度为 3
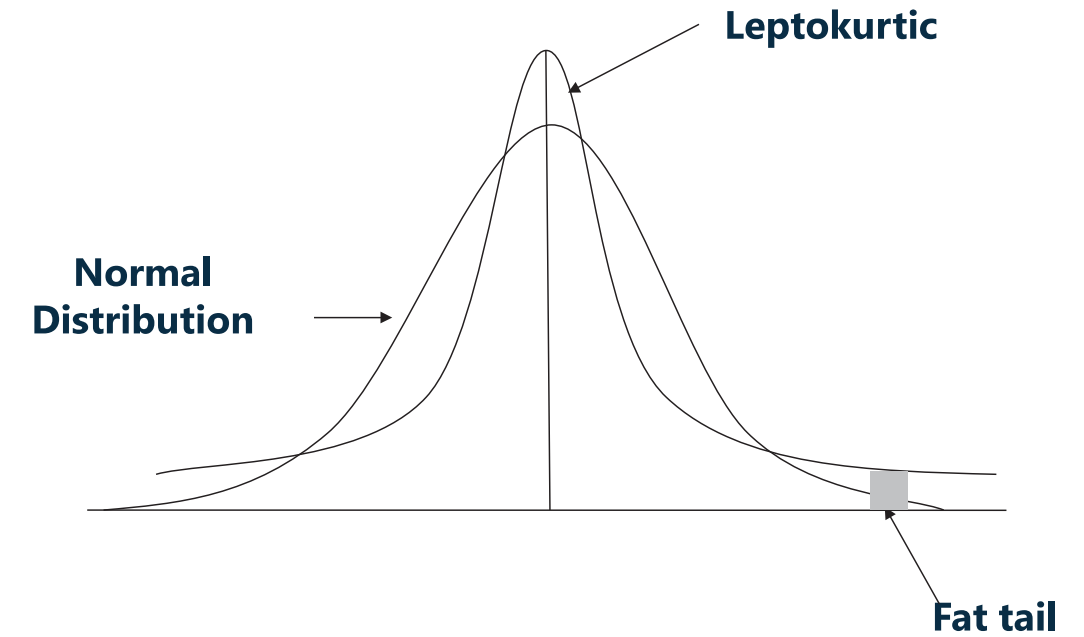
- 峰度比正太分布高,则为高峰(Leptokurtic)
- 高峰肥尾
- 前提:与正太分布的离散程度(即方差)一样
- 高峰时,均值周边的更加集中,即离散度更小,为了保证与正太分布的离散程度一样,则尾部需要更分散,因此导致肥尾。
- A leptokurtic return distribution has more frequent extremely large deviations from the mean than a normal distribution.
- 高峰肥尾
- 峰度比正太分布低,则为低峰(platykurtic)
- 概念:Excess kurtosis = Sample kurtosis - 3
 ,通过以下公式计算目标所求数值在第几位:
 通过描述确定,如第 3 个四分位数,则为
 ,而不是
,而不是 ?因为是某个数的左边(并不包含该数本身)要包含
 。
。


 用以衡量风险(风险并不是 Loss,而是不确定性)

- 样本(Sample)峰度计算公式(不考,了解)
传统金融学中假设投资者是 risk-aversion(风险厌恶),而 risk 并不等于 loss,即风险厌恶不等于损失厌恶。风险即不确定性,高峰肥尾表明极端情况下的不确定性更大,因此投资者不喜欢。
10、例题
(1)measurement scales
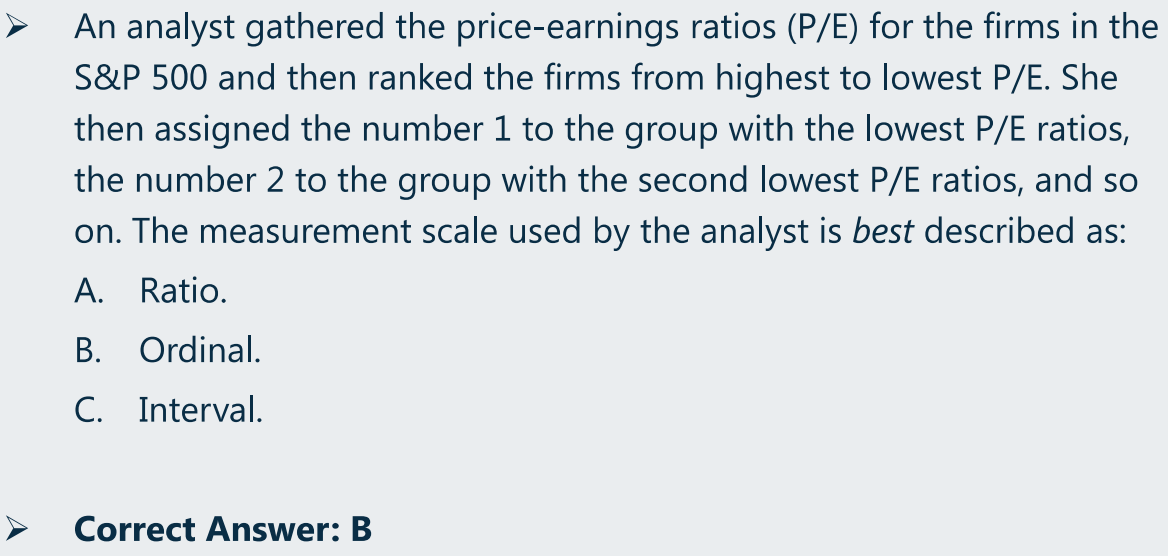
-
(2)frequency distribution
(3)各种平均值计算
(a)HPR(几何平均)及各种平均值对比
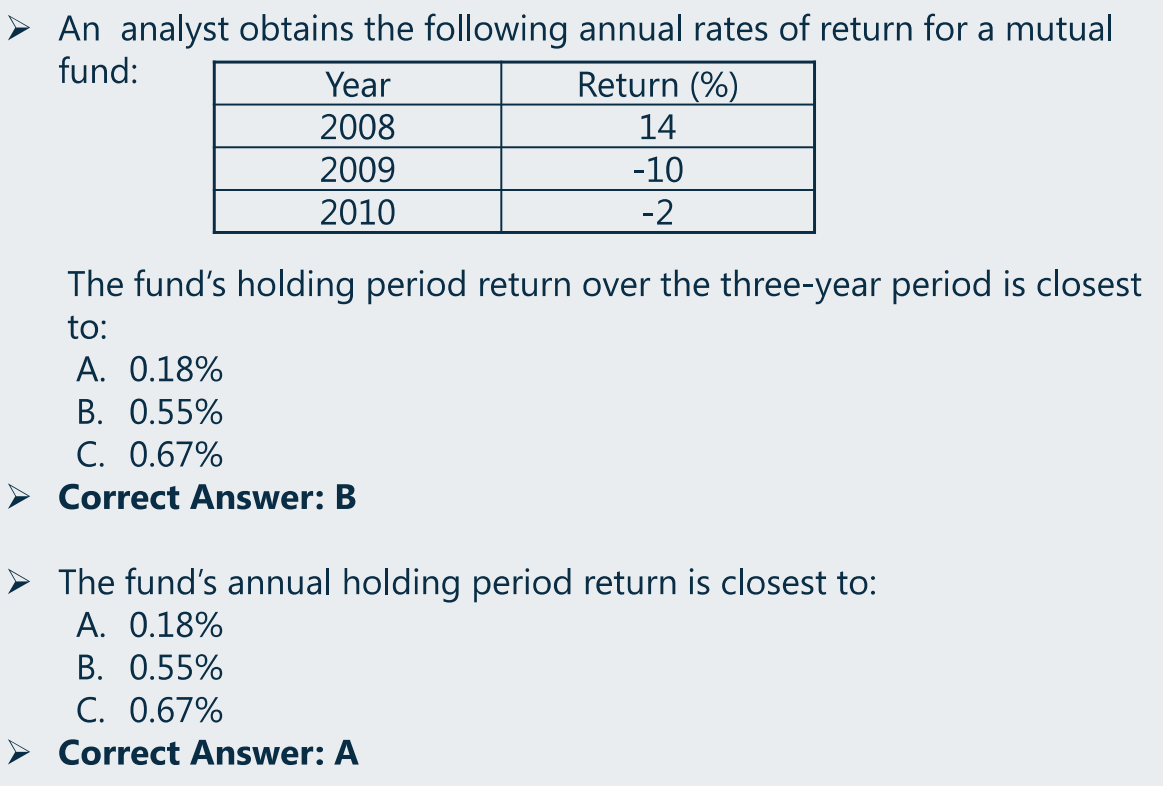
HPR 即持有这么长时间获得的 Real Return,求 Real Return 时是以复利的思想计算,即求几何平均收益率:
- 年化 HPR:
-
(b)算术平均 VS. 几何平均
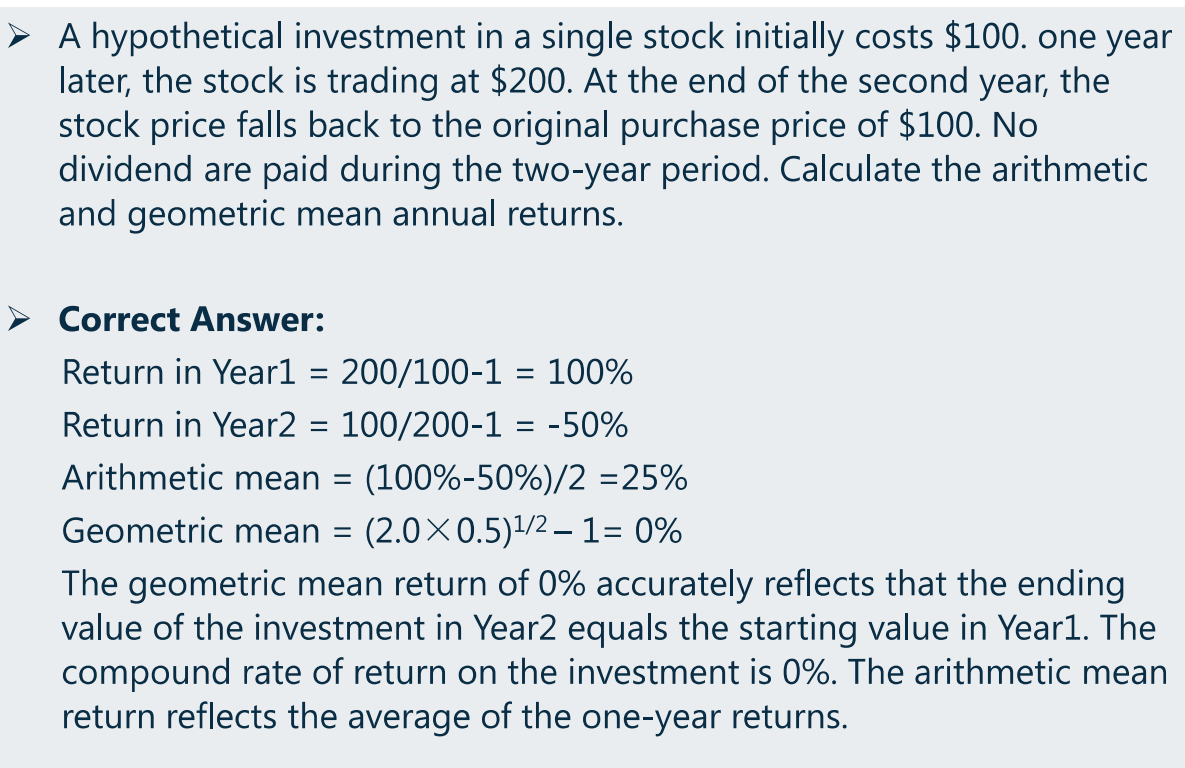
确定现金流量图
- 先算每一期的 HPR,再算几何平均值
-
(4)Quantiles
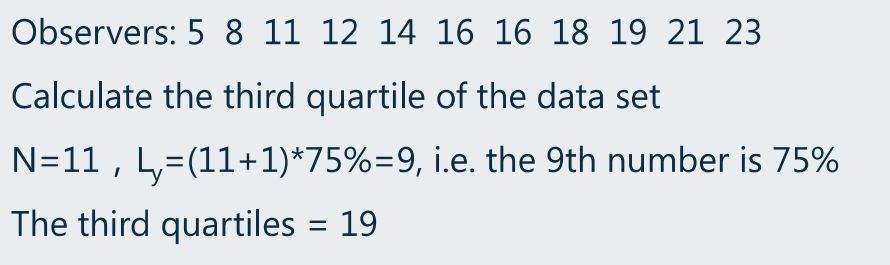
从小到大排序,并统计总个数
 ,通过以下公式计算目标所求数值在第几位:
- 此处即


 通过描述确定,如第 3 个四分位数,则为
-
(6)Coefficient of variation、sharp ratio
(7)skew(偏度)
根据描述,可判断是右偏,因此,mean > median
- 如果是:
- frequent small gain + a few large loss,则为左偏

(8)Leptokurtic、platykurtic
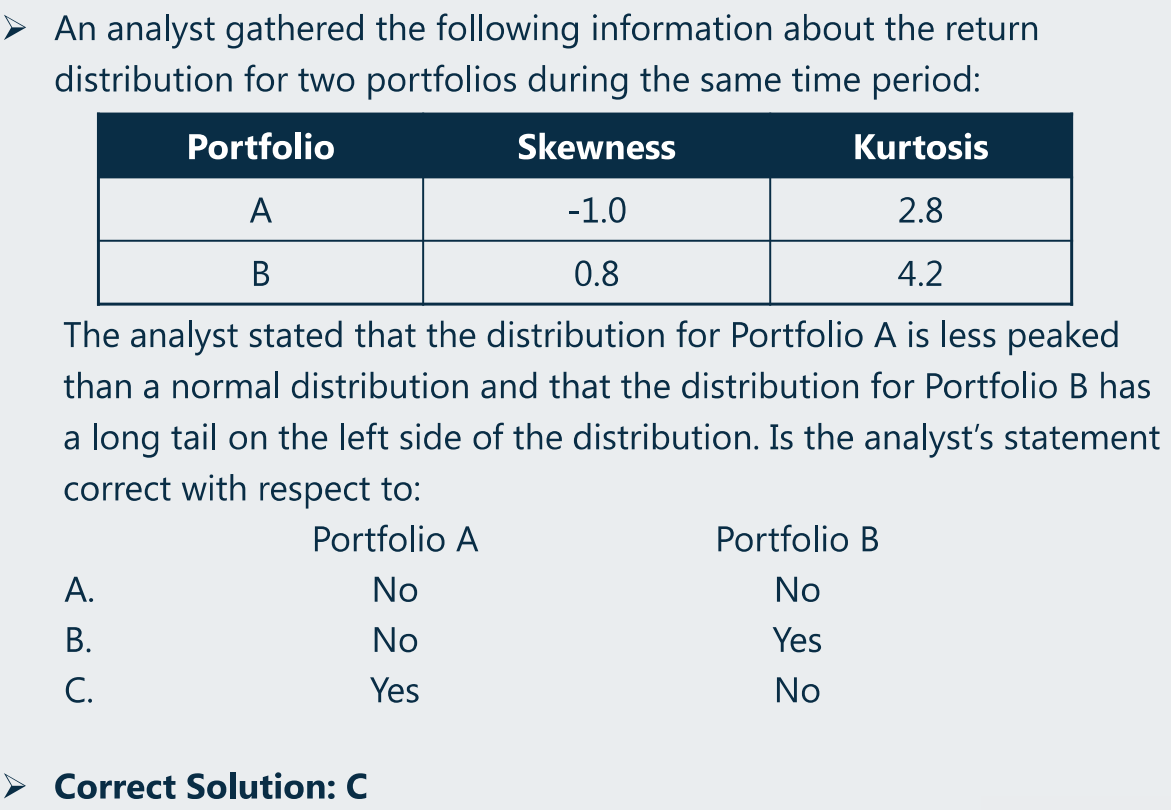
- A:左偏、低峰
- B:右偏、高峰

若有收获,就点个赞吧
0 人点赞
