jps
显示系统内所有HotSpot虚拟机进程
jps -l :用于查看java进程信息
imac@ArthurdeiMac jvm-test % jps -l2038 org.jetbrains.idea.maven.server.RemoteMavenServer362381 org.jetbrains.jps.cmdline.Launcher20142382 com.intellij.rt.junit.JUnitStarter2383 sun.tools.jps.Jps
jstat
收集HotSpot虚拟机各方面的运行参数
jstat -gc 2477 1000 10
S0C S1C S0U S1U EC EU OC OU MC MU CCSC CCSU YGC YGCT FGC FGCT GCT512.0 512.0 0.0 0.0 5632.0 1661.1 13824.0 7763.3 5504.0 4943.3 640.0 568.9 3 0.006 1 0.006 0.012512.0 512.0 0.0 0.0 5632.0 2161.2 13824.0 7763.3 5504.0 4943.3 640.0 568.9 3 0.006 1 0.006 0.012512.0 512.0 0.0 0.0 5632.0 2661.2 13824.0 7763.3 5504.0 4943.3 640.0 568.9 3 0.006 1 0.006 0.012512.0 512.0 0.0 0.0 5632.0 3161.2 13824.0 7763.3 5504.0 4943.3 640.0 568.9 3 0.006 1 0.006 0.012512.0 512.0 0.0 0.0 5632.0 3661.2 13824.0 7763.3 5504.0 4943.3 640.0 568.9 3 0.006 1 0.006 0.012512.0 512.0 0.0 0.0 5632.0 4161.2 13824.0 7763.3 5504.0 4943.3 640.0 568.9 3 0.006 1 0.006 0.012512.0 512.0 0.0 0.0 5632.0 4661.2 13824.0 7763.3 5504.0 4943.3 640.0 568.9 3 0.006 1 0.006 0.012512.0 512.0 0.0 0.0 5632.0 5161.3 13824.0 7763.3 5504.0 4943.3 640.0 568.9 4 0.006 1 0.006 0.012512.0 512.0 0.0 0.0 5632.0 500.0 13824.0 12646.7 5504.0 4939.7 640.0 568.3 4 0.009 2 0.012 0.020512.0 512.0 0.0 0.0 5632.0 1102.5 13824.0 12646.7 5504.0 4939.7 640.0 568.3 4 0.009 2 0.012 0.020
jstat -gcutil 2472 1s 10
imac@ArthurdeiMac jvm-test %S0 S1 E O M CCS YGC YGCT FGC FGCT GCT0.00 0.00 57.12 56.99 89.73 88.88 3 0.006 1 0.005 0.0110.00 0.00 66.00 56.99 89.73 88.88 3 0.006 1 0.005 0.0110.00 0.00 74.88 56.99 89.73 88.88 3 0.006 1 0.005 0.0110.00 0.00 83.75 56.99 89.73 88.88 3 0.006 1 0.005 0.0110.00 0.00 92.63 56.99 89.73 88.88 3 0.006 1 0.005 0.0110.00 0.00 8.88 91.48 89.76 88.80 4 0.008 2 0.011 0.0200.00 0.00 19.56 91.48 89.76 88.80 4 0.008 2 0.011 0.0200.00 0.00 28.44 91.48 89.76 88.80 4 0.008 2 0.011 0.0200.00 0.00 37.32 91.48 89.76 88.80 4 0.008 2 0.011 0.0200.00 0.00 46.20 91.48 89.76 88.80 4 0.008 2 0.011 0.020
jinfo
查看正在运行的java程序的扩展参数,支持运行时,修改部分参数
jinfo -flags 10736
Attaching to process ID 10736, please wait...
Debugger attached successfully.
Server compiler detected.
JVM version is 25.271-b09
Non-default VM flags: -XX:CICompilerCount=3 -XX:InitialHeapSize=20971520 -XX:MaxHeapSize=20971520
 -XX:MaxNewSize=6815744 -XX:MinHeapDeltaBytes=524288 -XX:NewSize=6815744 -XX:OldSize=14155776
 -XX:+UseCompressedClassPointers -XX:+UseCompressedOops -XX:+UseFastUnorderedTimeStamps
 -XX:-UseLargePagesIndividualAllocation -XX:+UseParallelGC
Command line:  -agentlib:jdwp=transport=dt_socket,address=127.0.0.1:53620,suspend=y,server=n -ea -Xms20m
-Xmx20m -Didea.test.cyclic.buffer.size=1048576
-javaagent:D:\Program\Idea\Idea2020.3\plugins\java\lib\rt\debugger-agent.jar -Dfile.encoding=UTF-8
jmap
用来查看堆内存使用状况,一般结合jhat使用
jmap -histo:live 2637
num     #instances         #bytes  class name
----------------------------------------------
   1:            65       10266768  [B
   2:          3143         231160  [C
   3:           969         109288  java.lang.Class
   4:          3144          75456  java.lang.String
   5:           735          44896  [Ljava.lang.Object;
   6:           646          20672  java.util.concurrent.ConcurrentHashMap$Node
   7:           472          15104  java.util.HashMap$Node
   8:           216           9696  [I
   9:           586           9376  java.lang.Object
  10:            19           7144  java.lang.Thread
  11:           103           6592  java.net.URL
  12:            51           6480  [Ljava.util.HashMap$Node;
  13:            24           6464  [Ljava.util.concurrent.ConcurrentHashMap$Node;
  省略了部分内容
 335:             1             16  sun.util.locale.provider.AuxLocaleProviderAdapter$NullProvider
 336:             1             16  sun.util.locale.provider.SPILocaleProviderAdapter
 337:             1             16  sun.util.resources.LocaleData
 338:             1             16  sun.util.resources.LocaleData$LocaleDataResourceBundleControl
Total         12796       10903304
jmap -dump:format=b,file=heapdump.dump 2673
可以打印堆转储文件,会暂停引用,慎用
Dumping heap to /Users/imac/Development/Workspace/IdeaWorkspace/jvm-test/heapdump.dump ...
jmap -heap 11488
Heap Configuration:
   MinHeapFreeRatio         = 0
   MaxHeapFreeRatio         = 100
   MaxHeapSize              = 20971520 (20.0MB)
   NewSize                  = 6815744 (6.5MB)
   MaxNewSize               = 6815744 (6.5MB)
   OldSize                  = 14155776 (13.5MB)
   NewRatio                 = 2
   SurvivorRatio            = 8
   MetaspaceSize            = 21807104 (20.796875MB)
   CompressedClassSpaceSize = 1073741824 (1024.0MB)
   MaxMetaspaceSize         = 17592186044415 MB
   G1HeapRegionSize         = 0 (0.0MB)

Heap Usage:
PS Young Generation
Eden Space:
   capacity = 5767168 (5.5MB)
   used     = 3799528 (3.6235122680664062MB)
   free     = 1967640 (1.8764877319335938MB)
   65.88204123757102% used
From Space:
   capacity = 524288 (0.5MB)
   used     = 516112 (0.4922027587890625MB)
   free     = 8176 (0.0077972412109375MB)
   98.4405517578125% used
To Space:
   capacity = 524288 (0.5MB)
   used     = 0 (0.0MB)
   free     = 524288 (0.5MB)
   0.0% used
PS Old Generation
   capacity = 14155776 (13.5MB)
   used     = 3465240 (3.3047103881835938MB)
   free     = 10690536 (10.195289611816406MB)
   24.47933620876736% used
jhat
用于解析dump文件,并启动一个webserver,可以用浏览器查看。使用不多
jhat heapdump.dump
Reading from heapdump.dump...
Dump file created Fri Jan 15 22:36:38 CST 2021
Snapshot read, resolving...
Resolving 12822 objects...
Chasing references, expect 2 dots..
Eliminating duplicate references..
Snapshot resolved.
Started HTTP server on port 7000
Server is ready.
jstack
一种堆栈跟踪工具,用于生成虚拟机当前时刻的线程快照
jstack 2849
Found one Java-level deadlock:
=============================
"pool-1-thread-2":
  waiting for ownable synchronizer 0x00000007157631d0, (a java.util.concurrent.locks.ReentrantLock$NonfairSync),
  which is held by "pool-1-thread-1"
"pool-1-thread-1":
  waiting for ownable synchronizer 0x0000000715763200, (a java.util.concurrent.locks.ReentrantLock$NonfairSync),
  which is held by "pool-1-thread-2"

Java stack information for the threads listed above:
===================================================
"pool-1-thread-2":
        at sun.misc.Unsafe.park(Native Method)
        - parking to wait for  <0x00000007157631d0> (a java.util.concurrent.locks.ReentrantLock$NonfairSync)
        at java.util.concurrent.locks.LockSupport.park(LockSupport.java:175)
        at java.util.concurrent.locks.AbstractQueuedSynchronizer.parkAndCheckInterrupt(AbstractQueuedSynchronizer.java:836)
        at java.util.concurrent.locks.AbstractQueuedSynchronizer.acquireQueued(AbstractQueuedSynchronizer.java:870)
        at java.util.concurrent.locks.AbstractQueuedSynchronizer.acquire(AbstractQueuedSynchronizer.java:1199)
        at java.util.concurrent.locks.ReentrantLock$NonfairSync.lock(ReentrantLock.java:209)
        at java.util.concurrent.locks.ReentrantLock.lock(ReentrantLock.java:285)
        at com.xusheng.DeadLockDemo$DeadLock2.run(DeadLockDemo.java:40)
        at java.lang.Thread.run(Thread.java:748)
        at java.util.concurrent.ThreadPoolExecutor.runWorker(ThreadPoolExecutor.java:1149)
        at java.util.concurrent.ThreadPoolExecutor$Worker.run(ThreadPoolExecutor.java:624)
        at java.lang.Thread.run(Thread.java:748)
"pool-1-thread-1":
        at sun.misc.Unsafe.park(Native Method)
        - parking to wait for  <0x0000000715763200> (a java.util.concurrent.locks.ReentrantLock$NonfairSync)
        at java.util.concurrent.locks.LockSupport.park(LockSupport.java:175)
        at java.util.concurrent.locks.AbstractQueuedSynchronizer.parkAndCheckInterrupt(AbstractQueuedSynchronizer.java:836)
        at java.util.concurrent.locks.AbstractQueuedSynchronizer.acquireQueued(AbstractQueuedSynchronizer.java:870)
        at java.util.concurrent.locks.AbstractQueuedSynchronizer.acquire(AbstractQueuedSynchronizer.java:1199)
        at java.util.concurrent.locks.ReentrantLock$NonfairSync.lock(ReentrantLock.java:209)
        at java.util.concurrent.locks.ReentrantLock.lock(ReentrantLock.java:285)
        at com.xusheng.DeadLockDemo$DeadLock1.run(DeadLockDemo.java:26)
        at java.lang.Thread.run(Thread.java:748)
        at java.util.concurrent.ThreadPoolExecutor.runWorker(ThreadPoolExecutor.java:1149)
        at java.util.concurrent.ThreadPoolExecutor$Worker.run(ThreadPoolExecutor.java:624)
        at java.lang.Thread.run(Thread.java:748)

Found 1 deadlock.
jconsole
hprof
用于分析cpu及内存使用情况
java -agentlib:hprof=cpu=times,interval=10 com.xusheng.JpsDemo
CPU TIME (ms) BEGIN (total = 30) Fri Jan 15 23:51:40 2021
    rank   self  accum   count trace method
   1 10.00% 10.00%      10 300991 sun.net.www.ParseUtil.decode
   2  6.67% 16.67%     836 300929 java.lang.AbstractStringBuilder.ensureCapacityInternal
   3  3.33% 20.00%       1 301768 java.lang.Class.getMethod0
   4  3.33% 23.33%      10 301018 java.io.File.getName
   5  3.33% 26.67%      10 300947 java.nio.HeapByteBuffer.put
   6  3.33% 30.00%      10 300923 sun.nio.cs.ThreadLocalCoders.decoderFor
   7  3.33% 33.33%       1 301596 java.security.Permissions.add
   8  3.33% 36.67%      55 300506 java.lang.String.charAt
   9  3.33% 40.00%      11 300717 sun.net.util.URLUtil.urlNoFragString
  10  3.33% 43.33%       1 300162 java.lang.invoke.MethodHandle.<clinit>
  11  3.33% 46.67%       1 301351 sun.misc.PerfCounter.<clinit>
  12  3.33% 50.00%      11 301024 sun.misc.URLClassPath$3.run
  13  3.33% 53.33%       2 301857 sun.nio.cs.StreamEncoder.writeBytes
  14  3.33% 56.67%      33 300772 java.lang.StringBuffer.append
  15  3.33% 60.00%     846 300993 java.lang.String.charAt
  16  3.33% 63.33%       1 301532 java.io.FilePermission.init
  17  3.33% 66.67%       1 301486 sun.net.www.protocol.file.Handler.createFileURLConnection
  18  3.33% 70.00%       6 301398 java.nio.DirectByteBuffer.asLongBuffer
  19  3.33% 73.33%      10 300994 java.io.UnixFileSystem.normalize
  20  3.33% 76.67%       2 300407 java.io.File.exists
  21  3.33% 80.00%       1 301238 sun.misc.URLClassPath$FileLoader.getResource
  22  3.33% 83.33%       1 300741 sun.misc.SharedSecrets.getJavaUtilZipFileAccess
  23  3.33% 86.67%      16 300261 java.lang.StringCoding.encode
  24  3.33% 90.00%       2 301069 java.net.URLClassLoader.findClass
  25  3.33% 93.33%       1 300091 java.lang.ClassValue.<init>
  26  3.33% 96.67%       4 300304 java.lang.reflect.Field.getName
  27  3.33% 100.00%      20 300832 java.lang.Character.toLowerCase
CPU TIME (ms) END
VisualVM
jdk自带的可视化工具。可以查看动态堆内存每个区域大小、cpu使用率等信息,同时也可以打印堆转储文件

mat
可视化hprof文件分析,可以方便定位内存相关问题

Arthas
thread

thread 22

thread -n 3
排名前3的线程
thread | grep pool
查看线程池状态
thread -b
jad com.xusheng.ArthasDemo
反编译代码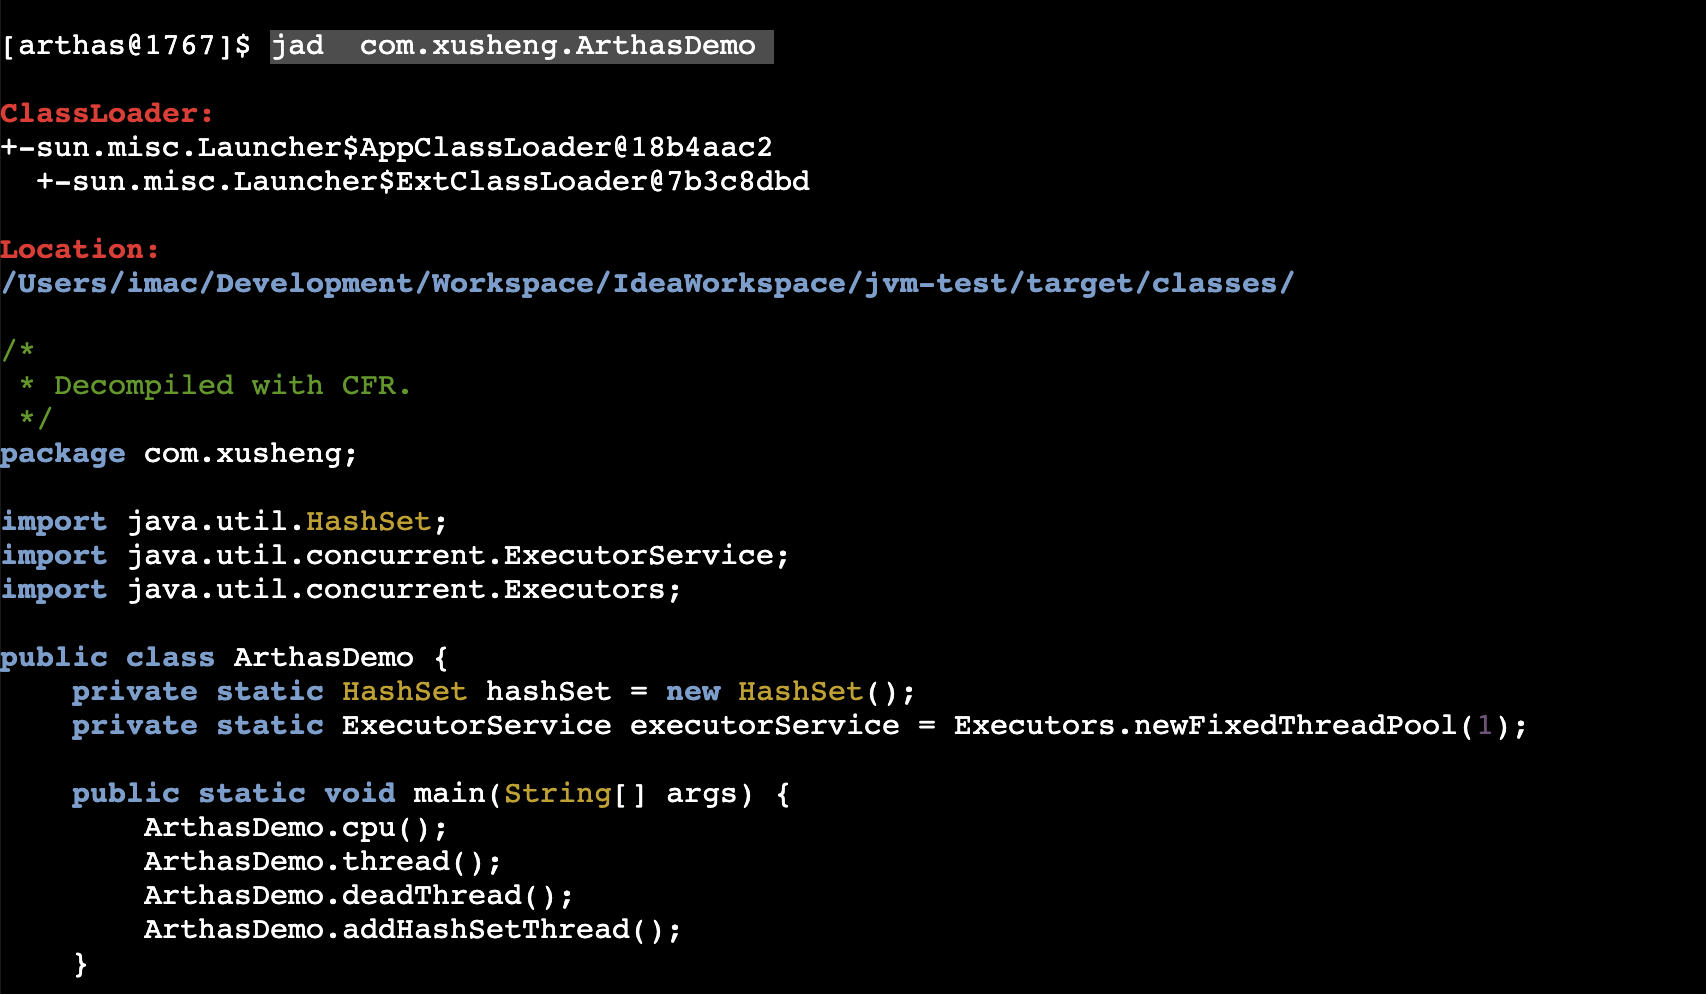
ognl ‘@com.xusheng.ArthasDemo@hashSet’
获取类的静态成员变量信息
ognl ‘@com.xusheng.ArthasDemo@hashSet.size()’
获取类的静态成员变量大小
ognl ‘@com.xusheng.ArthasDemo@hashSet.add(“123”)’
为类的静态成员添加元素

trace com.xusheng.controller.TestController test
查看耗时
monitor -c 5 com.xusheng.TestServiceImpl test

若有收获,就点个赞吧
0 人点赞
