图表在中后台系统中是一个非常常见的可视化表现形式,也使得数据变得更为的直观。这一小节,我们将通过使用图表类库 G2 来制作一个图表。
备注:阿里提供了 BizCharts 对 G2 进行了封装,在实际开发中可以很方便的进行使用。本小节会从基本的 G2 应用开始,让你体验一下组件开发需要涉及到哪些细节。
引入依赖
G2 需要额外引入,让我们先安装一下吧:
cnpm install @antv/g2 --save
创建图表组件
接着,我们新建一个图表组件于 src/components/SampleChart.js。
import React from 'react';import G2 from '@antv/g2';class SampleChart extends React.Component {constructor(props) {super(props);this.containerRef = React.createRef();}render() {return (<div ref={this.containerRef} />);}}export default SampleChart;
此处我们看到了一个新的属性 ref,通过该属性我们可以获取经过 render 后的真实节点的引用。如果 ref 的节点是一个 dom 元素,那么你得到的是文档中真实的 dom 节点,如果 ref 的节点是一个 component,那么你获得将是该 component 渲染后的实例。而在这里,我们获取的是 div 的 dom。
其中 React.createRef 是 React 提供的一个创建引用的便捷方法。
在获取了 dom 元素后,我们便可以对其进行图表的初始化了。
class SampleChart extends React.Component {componentDidMount() {// G2 初始化图形代码this.chart = new G2.Chart({// this.containerRef.current 即为引用container: this.containerRef.current,width: 450,height: 300});// 下文会介绍this.refreshChart();}// ...}
componentDidMount 是 React 组件生命周期方法之一,在组件被添加到真实文档后触发。因而我们在这时,ref 可以拿到当前真实的 dom 元素。
这不仅仅适用于 G2,同样适用于那些依赖于真实 dom 元素的库(例如 jQuery)。之后,我们实现数值渲染:
class SampleChart extends React.Component {refreshChart = () => {// 接收 data 属性作为数据源this.chart.source(this.props.data);// 此处为硬编码,配置源自 G2 官方示例: https://github.com/antvis/g2// 实际开发中需要封装,推荐直接使用 BizCharts。this.chart.interval().position('genre*sold').color('genre');this.chart.render();};// ...}
一个基本的图表组件完成了,但是还有一些小细节还需要考虑。本小节最后会将其补充完成,不过也很欢迎你先想想还漏了哪些东西。
使用图表
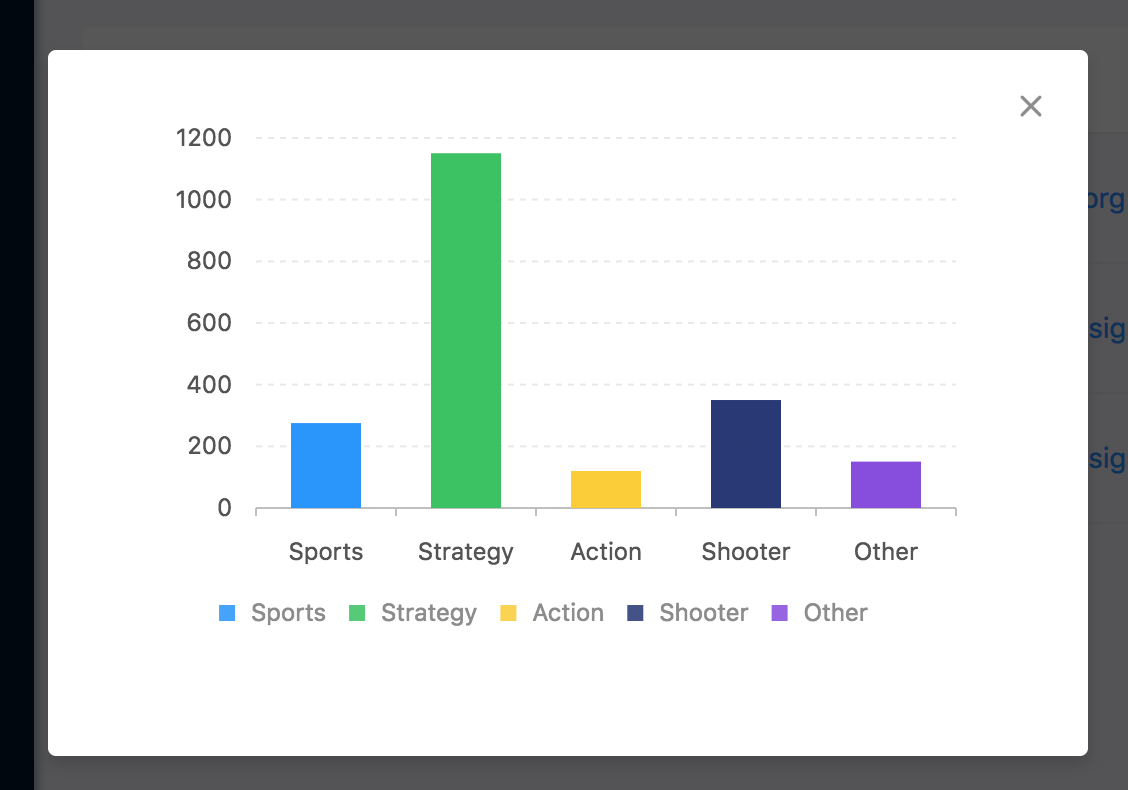
同样的,我们需要在 model 和 mock 中加入对应的数据获取步骤。返回的数据格式如下(这是 G2 官方样例数据):
{result: [{ genre: 'Sports', sold: 275 },{ genre: 'Strategy', sold: 1150 },{ genre: 'Action', sold: 120 },{ genre: 'Shooter', sold: 350 },{ genre: 'Other', sold: 150 },]}
具体的代码可以详见 src/model/cards.js、 src/service/cards.js 和 mock/cards.js 中的内容。在之前章节已经介绍过它们的内容因而略过。
回到我们上一节开发的 list 页面,我们更新一下 state 添加相关状态:
state = {// ...statisticVisible: false,id: null,};
然后,我们为表格添加额外的一列用于点击展示图表:
columns = [// ...{title: '',dataIndex: '_',render: (_, { id }) => {return (<Button onClick={() => { this.showStatistic(id); }}>图表</Button>);},},];
添加展示逻辑。
class List extends React.Component {showStatistic = (id) => {this.props.dispatch({type: 'cards/getStatistic',payload: id,});// 更新 state,弹出包含图表的对话框this.setState({ id, statisticVisible: true });};handleStatisticCancel = () => {this.setState({statisticVisible: false,});}// ...}
增加表格的对话框,将我们做好的组件加进去:
render() {const { /* ... */ statisticVisible, id } = this.state;const { /* ... */ statistic } = this.props;return (<div>{/* ... */}<Modal visible={statisticVisible} footer={null} onCancel={this.handleStatisticCancel}><SampleChart data={statistic[id]} /></Modal></div>);}
好了,现在点击“图表”按钮便可以欣赏到你的图表啦。
更多思考
我们回到之前设计的 SampleChart,想想还缺少些什么。
首先,我们现在的逻辑只接收初始化时获取的 data 画图,如果 data 更新图表并不会更新。因而,我们需要监听组件更新事件,更新时重新画图。
componentDidUpdate() {this.refreshChart();}
考虑另外一点,如果当前的 data 没有变化我们图表当然不需要重新绘制。因而,添加一个检查只有 data 更新时才重绘:
componentDidUpdate(prevProps) {if (prevProps.data !== this.props.data) {this.refreshChart();}}
接着,还有一个问题。如果这个组件不再被使用,那么初始化的图表也应该随着组件一并被销毁。所以,我们还需要监听一下卸载事件:
componentWillUnmount() {if (this.chart) {this.chart.destroy();}}
这样,图表的生命周期就与组件的生命同步了。
最后一点,就是该图表的耦合性过高。我们还需要将一些耦合的部分拆分出来。你可以参考 BizCharts 的实现作为课外阅读。

若有收获,就点个赞吧
0 人点赞
