library(ggplot2)library(ggalluvial)library(RColorBrewer)color = brewer.pal(n = 2, 'Set2')ggplot(data, aes(axis1 = axis1, axis2 = axis2, y = Freq))+geom_alluvium(aes(fill = axis3))+scale_x_discrete(limits = c("axis1", 'axis2'),expand = c(.1, .05),)+geom_stratum()+geom_text(stat = "stratum", aes(label = after_stat(stratum)))+theme_minimal()+theme_classic()+scale_fill_manual(values = c("#66C2A5", "#FC8D62"))
note: data整理为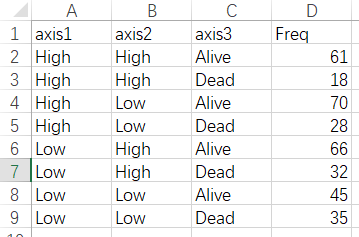
图还是很漂亮的~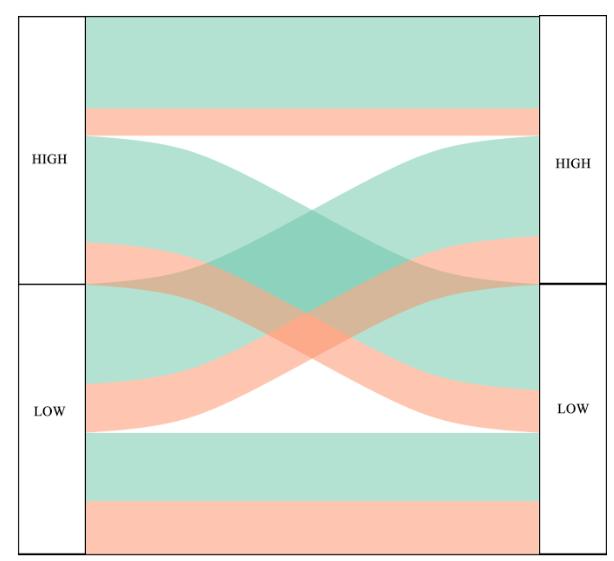

若有收获,就点个赞吧
0 人点赞
