一步运行
## complete GSEA moduledata_gse <- runGSEA(data_hyper,dir = "gse_out",GO = TRUE,KEGG = TRUE)
分步运行
计算
## step only resolvedata_gse <- gseResolve(data_hyper,GO = FALSE,KEGG = TRUE)
结果整理
## step summary resultsgseSummary(data_gse,dir = "gse_out",prefix = "4-runGSEA",top = 10)
辅助工具
自定义GO注释的富集分析
gseGO2(geneList,ont = "ALL",TERM2GENE,TERM2NAME = NA,organism = "UNKNOW",keyType = "SYMBOL",exponent = 1,minGSSize = 10,maxGSSize = 500,eps = 1e-10,pvalueCutoff = 0.05,pAdjustMethod = "BH",verbose = TRUE,seed = FALSE,by = "fgsea",...)
可视化工具
gsea 图
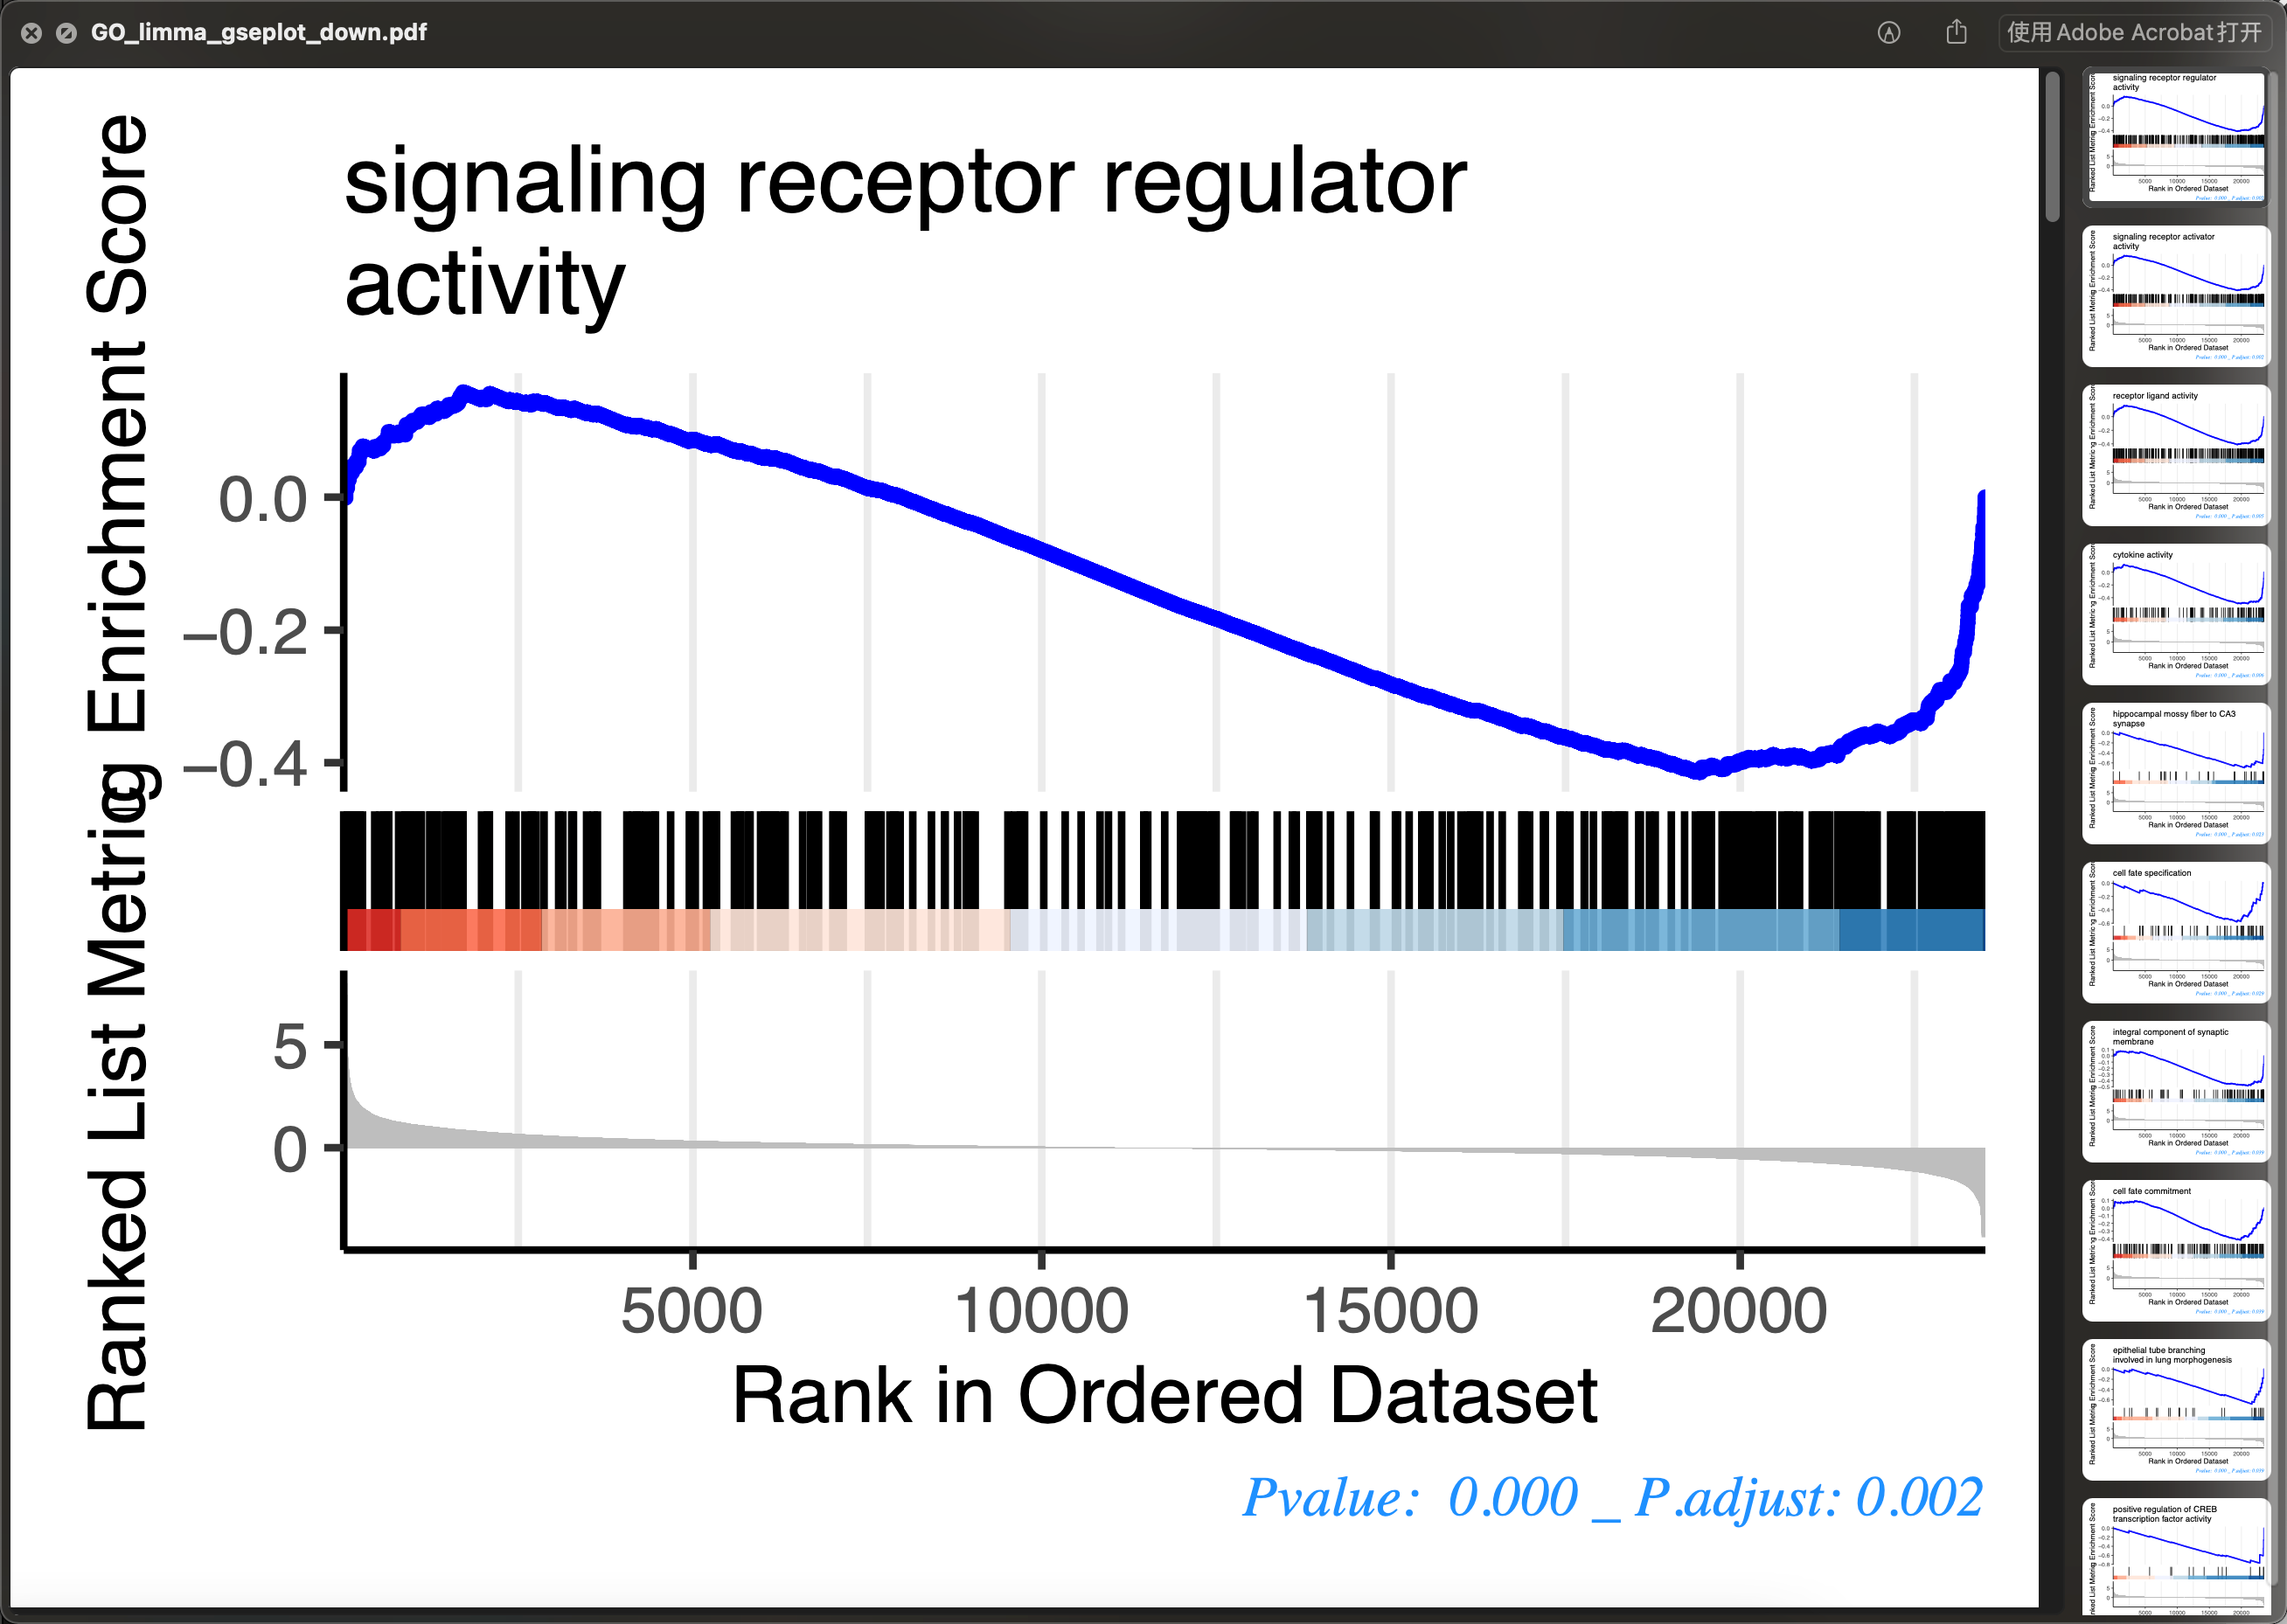
p_gsea_list <- GSEAplot(gsob,top = 10)down_plots_pdf <- "GO_limma_gseplot_down.pdf"pdf(down_plots_pdf,height = 3,width = 4)invisible(lapply(p_gsea_list[["down_plots"]], print))dev.off()
gse 柱状图
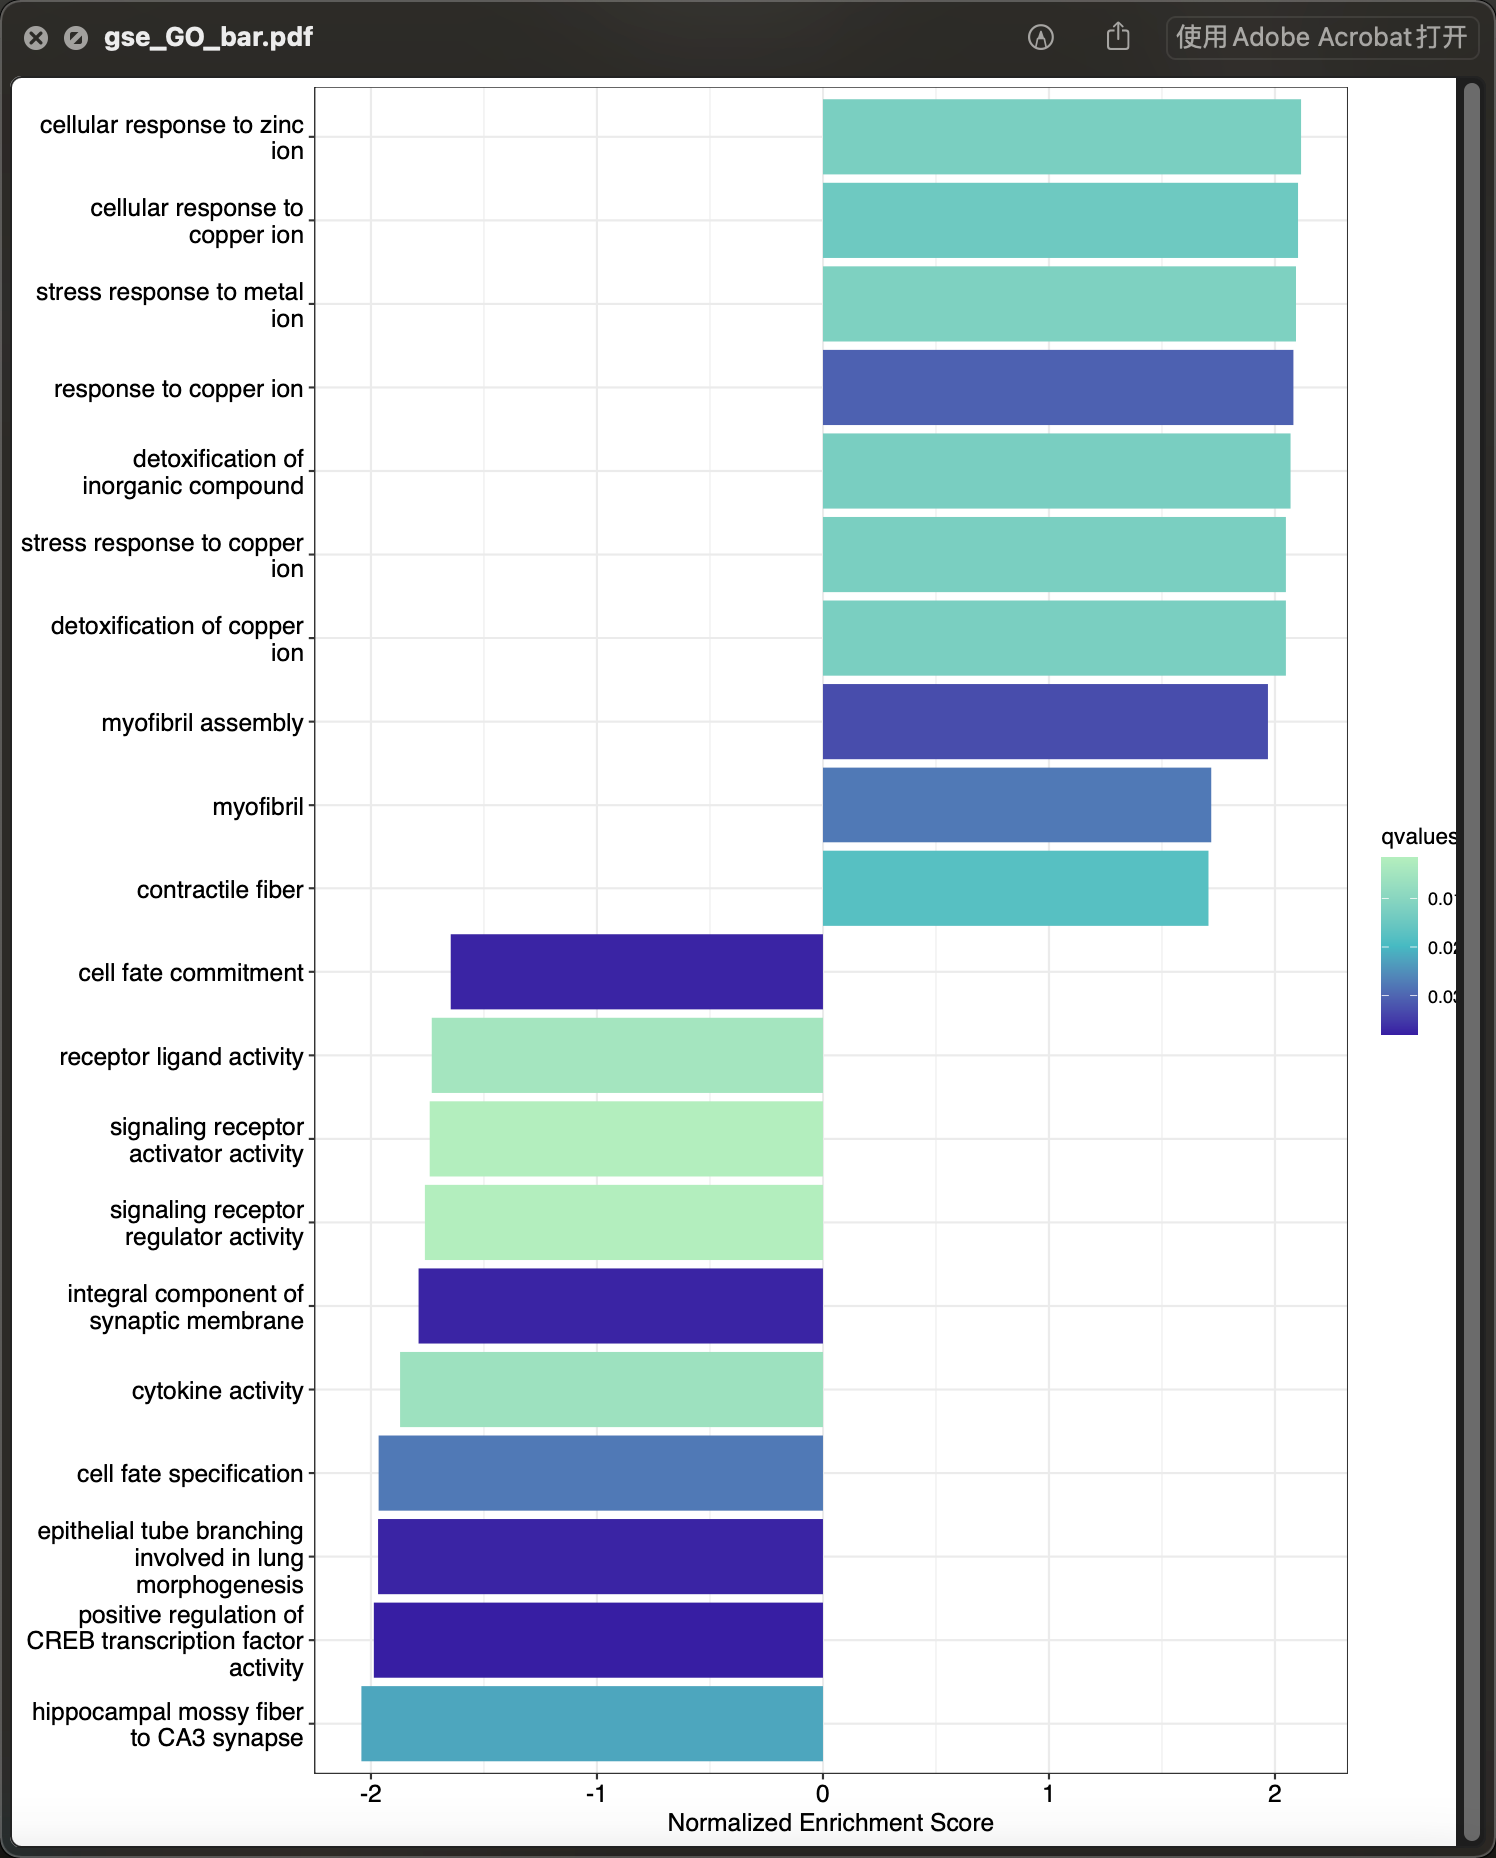
gsob <- gseRes(data_gse)[["gseGO_res"]][["limma"]]p_gsegbar <- GSEAbar(gsob,top = 10)ggplot2::ggsave(p_gsegbar,filename = "gse_GO_bar.pdf", width = 3000,height = 3600,units = "px",limitsize = FALSE,device = cairo_pdf)

若有收获,就点个赞吧
0 人点赞
