sin = Plot[Sin@x, {x, 0, 2 Pi}];pts = First@Cases[sin, Line[coords_List] :> coords, Infinity];Graphics@Point@pts
1.用点勾勒

2.用线勾勒
Graphics[Line@pts]

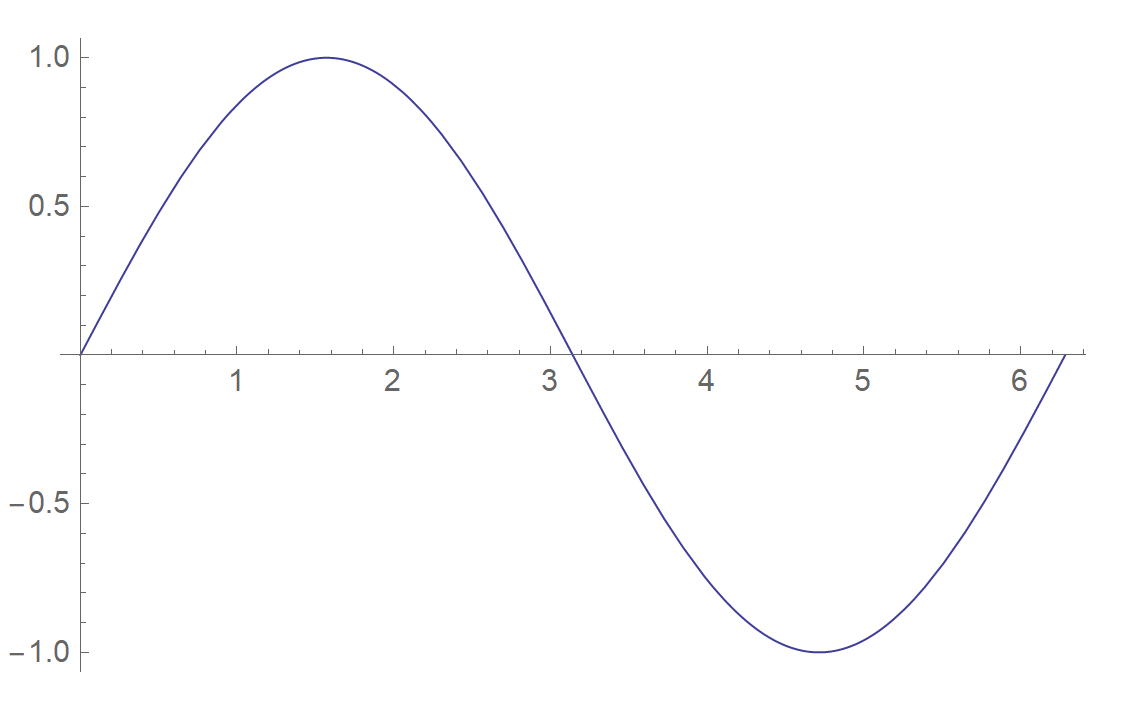
3.填上颜色和坐标轴
Graphics[{Hue[0.67, 0.6, 0.6], Line@pts},Axes -> Automatic, AspectRatio -> 1/GoldenRatio]

若有收获,就点个赞吧
0 人点赞
