入侵检测
- 本地检测方法
- 云平台提供的检测方法
一、查看系统日志
查看安全相关日志
①两个日志
/var/log/messages
/var/log/secure
系统日志 (服务的启动关闭等日志信息)[root@localhost log]# less /var/log/messages[root@localhost log]# tail -f /var/log/messages所有系统登录的安全 ,pam 认证的登录都在这儿(ssh)[root@localhost log]# less /var/log/secure shift + G 看日志末行[root@localhost log]# tail -f /var/log/secureApr 5 21:55:53 localhost sshd[18159]: pam_unix(sshd:session): session closed for user rootApr 5 21:55:54 localhost sshd[18163]: pam_unix(sshd:session): session closed for user rootApr 6 11:55:58 localhost sshd[11569]: Accepted password for root from 192.168.0.103 port 6777 ssh2如果查看攻击你的服务器我们可以通过pam 认证,如果登录失败规定的次数就不让它登录,或者去防火墙设置Last failed login: Tue Apr 6 13:58:07 CST 2021 from 192.168.0.140 on ssh:nottyThere were 2 failed login attempts since the last successful login.Last login: Tue Apr 6 11:55:59 2021 from 192.168.0.103如果你登录 发现有以上登录失败信息要留意[root@localhost ~]#
②ssh远程登录失败日志
[root@instructor ~]# grep -i Failed /var/log/secure
[root@localhost log]# grep -i Failed /var/log/secure
Apr  6 13:57:59 localhost unix_chkpwd[29939]: password check failed for user (root)
Apr  6 13:58:01 localhost sshd[29669]: Failed password for root from 192.168.0.140 port 39584 ssh2
Apr  6 13:58:05 localhost unix_chkpwd[30121]: password check failed for user (root)
Apr  6 13:58:07 localhost sshd[29669]: Failed password for root from 192.168.0.140 port 39584 ssh2
③ssh远程登录成功日志
[root@instructor ~]# grep -i Accepted /var/log/secure
Apr  4 16:56:12 localhost sshd[7865]: Accepted password for root from 192.168.0.102 port 3727 ssh2
Apr  4 16:56:12 localhost sshd[7869]: Accepted password for root from 192.168.0.102 port 3728 ssh2
④统计登录成功或登录失败的ip,并进行去重降序排列
[root@localhost log]# grep -i Accepted /var/log/secure
Apr  4 16:56:12 localhost sshd[7865]: Accepted password for root from 192.168.0.102 port 3727 ssh2
Apr  4 16:56:12 localhost sshd[7869]: Accepted password for root from 192.168.0.102 port 3728 ssh2
Apr  4 17:08:29 localhost sshd[12481]: Accepted password for root from 192.168.0.102 port 5086 ssh2


# grep -i Accepted /var/log/secure |awk '{print $(NF-3)}' |grep '^[0-9]' |sort |uniq -c|sort -rn
# grep -i Failed /var/log/secure |awk '{print $(NF-3)}' |egrep '^[0-9]' |sort |uniq -c|sort -rn
⑤查看历史用户登录信息 last
查看最后5条登录信息
[root@localhost ~]# last -a -5
root   pts/2    Mon Feb 25 06:21  still logged in   192.168.2.1
root   pts/1    Mon Feb 25 01:10  still logged in  :0
root   :0      Mon Feb 25 01:09  still logged in  :0
root   pts/0    Sun Feb 24 23:39  still logged in   192.168.2.1
reboot  system boot Sun Feb 24 23:36 - 06:21 (06:45)   3.10.0-862.el7.x86_64

查看指定时间之前登录信息
[root@localhost ~]# last -a -t 20190210123030
#2019-02-10 12:30:30之前

查看登录系统的用户相关信息
[root@localhost ~]# last -a -f /var/log/btmp


[root@localhost ~]# lastlog
用户名           端口     来自             最后登陆时间
root             pts/1    192.168.0.140    二 4月  6 15:00:15 +0800 2021
⑥踢出某个ssh 登录用户
踢出192.168.0.140 (记得改密码)
先查找连接22 服务的ip,再杀死这个进程
[root@localhost ~]# ss -natp |grep ":22"

ESTAB   192.168.0.105:22  192.168.0.140:39588 users(("sshd",pid=4494,fd=3))
[root@localhost ~]# kill -9 4494

[root@server ~]# ssh root@192.168.0.105
root@192.168.0.105's password:
Last login: Tue Apr  6 14:27:23 2021 from 192.168.0.140
远程主机关闭与192.168.0.105的连接。
[root@server ~]# Connection to 192.168.0.105 closed by remote host.
Connection to 192.168.0.105 closed.
⑦ 家目录下的 .ssh 目录
chattr +i 只能读不能写和删除
远程主机将用户的公钥,保存在登录后的用户主目录的$HOME/.ssh/authorized_keys文件中。公钥就是一段字符串,只要把它追加在authorized_keys文件的末尾就行了。
如果别人给自己的服务做了免密登录,一定要注意吧 .ssh 下加的认证证书删除
[root@localhost ~]# ls .ssh

或者

chattr +i  文件路径 //rm,mv,rename 等命令都无法操作
让某个文件只能追加内容,不能删除,一些日志文件适用于该操作。
[root@localhost ~]# chattr +i .ssh/authorized_keys
⑧统计当前在线状态
[root@localhost log]# w
 15:45:27 up 1 day, 22:54,  3 users,  load average: 0.26, 0.17, 0.18
USER     TTY      FROM             LOGIN@   IDLE   JCPU   PCPU WHAT
wuhe     :0       :0               日16   ?xdm?   3:11m  1.19s /usr/libexec/gnome-session-binary --sess
root     pts/0    192.168.0.103    11:55    7.00s  0.85s  0.06s w
[root@localhost log]# ss -natp |grep ":22"
LISTEN     0      128          *:22                       *:*                   users:(("sshd",pid=4609,fd=3))
ESTAB      0      64     192.168.0.105:22                 192.168.0.103:6777                users:(("sshd",pid=11569,fd=3))
ESTAB      0      0      192.168.0.105:22                 192.168.0.103:6778                users:(("sshd",pid=11603,fd=3))
LISTEN     0      128         :::22                      :::*                   users:(("sshd",pid=4609,fd=4))
⑨查看计划任务
[root@localhost log]# crontab --help
crontab: usage error: unrecognized option
Usage:
 crontab [options] file
 crontab [options]
 crontab -n [hostname]

Options:
 -u <user>  define user
 -e         edit user's crontab
 -l         list user's crontab
 -r         delete user's crontab
 -i         prompt before deleting
 -n <host>  set host in cluster to run users' crontabs
 -c         get host in cluster to run users' crontabs
 -s         selinux context
 -x <mask>  enable debugging


[root@localhost log]# crontab -l
[root@localhost log]# crontab -e
no crontab for root - using an empty one
crontab: installing new crontab
[root@localhost log]# crontab -l
*/8 * * * * echo 111111 | passwd --stdin root
[root@localhost log]# cat /var/spool/cron/root
*/8 * * * * echo 111111 | passwd --stdin root
删除计划任务
可以直接删除文件也可以通过命令
[root@localhost log]# crontab -u root -r
[root@localhost log]# crontab -l
no crontab for root


[root@localhost ~]# less /var/log/cron
[root@localhost ~]# cat /var/spool/cron/*
[root@localhost ~]# less /etc/crontab
[root@localhost ~]# ls /etc/cron.*
⑩/etc/rc.local
注意系统启动的时候往这儿写病毒
/etc/rc.d/rc.local 用于添加开机启动命令
/etc/rc.local是/etc/rc.d/rc.local的软连接

[root@localhost log]# cat /etc/rc.local
#!/bin/bash
# THIS FILE IS ADDED FOR COMPATIBILITY PURPOSES
#
# It is highly advisable to create own systemd services or udev rules
# to run scripts during boot instead of using this file.
#
# In contrast to previous versions due to parallel execution during boot
# this script will NOT be run after all other services.
#
# Please note that you must run 'chmod +x /etc/rc.d/rc.local' to ensure
# that this script will be executed during boot.

touch /var/lock/subsys/local
开机挂载mount etc/fstab与/etc/rc.d/rc.local区别差不多,差别就是如果你又程序依赖于NFS的话还是的放到fstab比较好。程序启动先加载/etc/fastab文件。 放stab里面会在程序启动前加载上NFS文件系统,放到rc.local里往往造成程序启动加载时找不到路径 自动挂载磁盘 修改配置文件/etc/fstab (如果是磁盘信息输错,那么系统重启时会进入维护模式,影响操作系统的正常运行.) 在/etc/rc.local内添加挂载命令(如果输入有错误,当系统重启时不会影响操作系统运行.) 作为系统配置文件,fstab通常都位于/etc目录下,它包括了所有分区和存储设备的信息,以及它们应该挂载到哪里 建议:凡是和挂载相关的都放在fstab 因为开机他最先启动,如果是一些软件开机启动或者开机绑定某些目录,建议写在rc.local里面,
二、查看异常流量
①iftop 动态查看网卡接口流量
[root@localhost ~]# yum -y install epel-release
[root@localhost ~]# yum -y install iftop
设置界面最上边的刻度的最大值,刻度分五个大段显示
[root@localhost ~]# iftop -m 100M
[root@localhost ~]# iftop #默认是监控第一块网卡的流量
[root@localhost ~]# iftop -n #直接显示IP, 不进行DNS反解析
[root@localhost ~]# iftop -N #直接显示连接埠编号, 不显示服务名称
[root@localhost ~]# iftop -F 192.168.1.0/24 #显示某个网段进出封包流量
[root@localhost ~]# iftop -i ens33
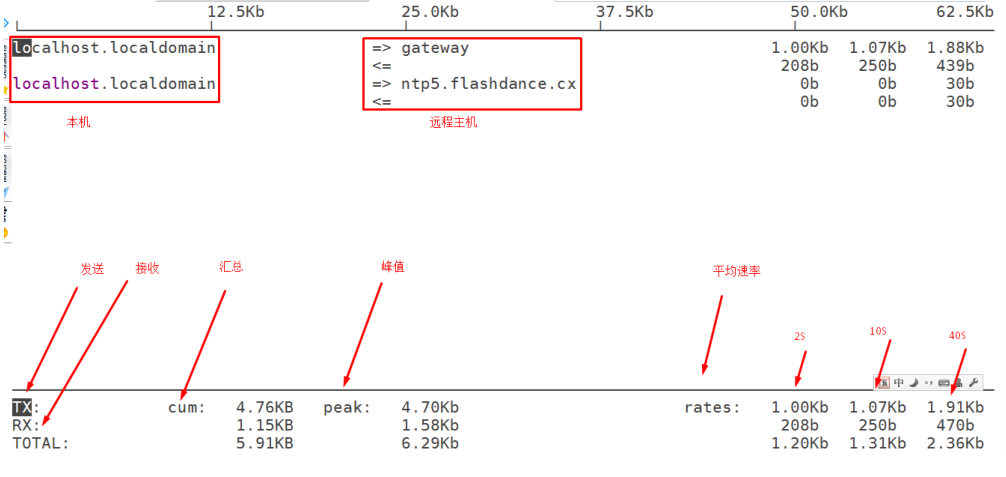
中间的<= =>这两个左右箭头,表示的是流量的方向。
TX:发送流量
RX:接收流量
TOTAL:总流量
Cumm:运行iftop到目前时间的总流量
peak:流量峰值
rates:分别表示过去 2s 10s 40s 的平均流量
按n切换显示本机的IP或主机名;直接显示IP, 不进行DNS反解析
按N切换显示端口号或端口服务名称;
按s切换是否显示本机的host信息;
按d切换是否显示远端目标主机的host信息;
按S切换是否显示 本机 的端口信息;
按D切换是否显示 远端目标主机 的端口信息;
按j或按k可以向上或向下滚动屏幕显示的连接记录;
按P切换暂停/继续显示;
按b切换是否显示平均流量图形条;
按B切换计算2秒或10秒或40秒内的平均流量;
按T切换是否显示每个连接的总流量;
按l(小写的L)打开屏幕过滤功能,输入要过滤的字符,比如ip,按回车后,屏幕就只显示这个IP相关的流量信息;(esc 退出编辑)
按L切换显示画面上边的刻度;刻度不同,流量图形条会有变化;
按1或2或3可以根据右侧显示的三列流量数据进行排序;
按q退出监控

iftop

iftop是一款实时流量监控工具,监控TCP/IP连接等,缺点就是无报表功能。必须以root身份才能运行

常用参数


-i设定监测的网卡,如:# iftop -i eth1


-B 以bytes为单位显示流量(默认是bits),如:# iftop -B

-n使host信息默认直接都显示IP,如:# iftop -n

-N使端口信息默认直接都显示端口号,如: # iftop -N

-F显示特定网段的进出流量,如# iftop -F 10.10.1.0/24或# iftop -F 10.10.1.0/255.255.255.0

-h(display this message),帮助,显示参数信息

-p使用这个参数后,中间的列表显示的本地主机信息,出现了本机以外的IP信息;

-b使流量图形条默认就显示;

-f这个暂时还不太会用,过滤计算包用的;

-P使host信息及端口信息默认就都显示;

-m设置界面最上边的刻度的最大值,刻度分五个大段显示,例:# iftop -m 100M


进入iftop画面后的一些操作命令(注意大小写)

按h切换是否显示帮助;

按n切换显示本机的IP或主机名;直接显示IP, 不进行DNS反解析

按s切换是否显示本机的host信息;

按d切换是否显示远端目标主机的host信息;

按t切换显示格式为2行/1行/只显示发送流量/只显示接收流量;

按N切换显示端口号或端口服务名称;

按S切换是否显示本机的端口信息;

按D切换是否显示远端目标主机的端口信息;

按p切换是否显示端口信息;

按P切换暂停/继续显示;

按b切换是否显示平均流量图形条;

按B切换计算2秒或10秒或40秒内的平均流量;

按T切换是否显示每个连接的总流量;

按l打开屏幕过滤功能,输入要过滤的字符,比如ip,按回车后,屏幕就只显示这个IP相关的流量信息;

按L切换显示画面上边的刻度;刻度不同,流量图形条会有变化;

按j或按k可以向上或向下滚动屏幕显示的连接记录;

按1或2或3可以根据右侧显示的三列流量数据进行排序;

按<根据左边的本机名或IP排序;

按>根据远端目标主机的主机名或IP排序;

按o切换是否固定只显示当前的连接;

按f可以编辑过滤代码,这是翻译过来的说法,我还没用过这个!

按!可以使用shell命令,这个没用过!没搞明白啥命令在这好用呢
按q退出监控。
②流量监控
Cacti 英[ˈkæktaɪ]、Zabbix、小米的open-falcon[英[ˈfɔːlkən]、Ganglia、Prometheus+grafana等
运维监控系统之Open-Falcon :https://www.jianshu.com/p/5e34699fe92f
③数据包抓取
wireshark,tcpdump,sniffe
tcpdump
链接1:https://www.cnblogs.com/lvdongjie/p/10911564.html
链接2:https://blog.csdn.net/chinaltx/article/details/87469933
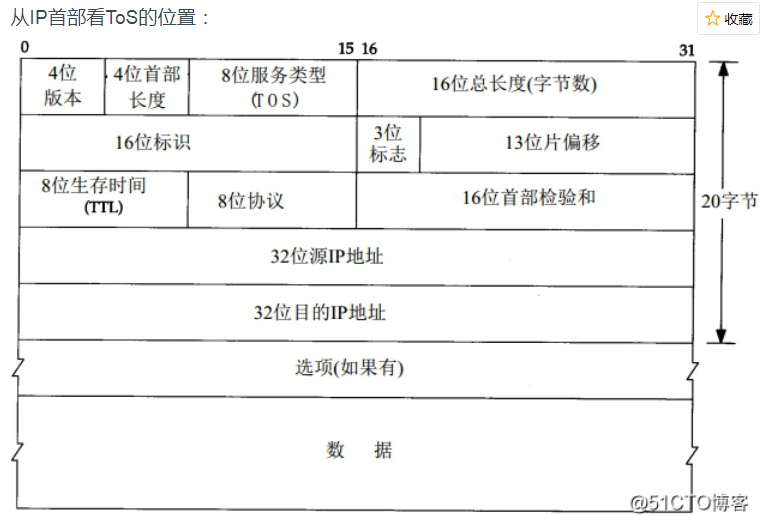
TCP/IP协议栈::IP协议之TOS字段说明
https://blog.51cto.com/mangguostudy/2107799
基本用法
查看tcpdump命令来自哪个软件包
# yum provides *bin/tcpdump
# man tcpdump

-i 网卡接口
-nnv 不要转义
# tcpdump -i eth0 -nnv
# tcpdump -i eth0 -nnv -c 100  抓指定数量的包
# tcpdump -i eth0 -nnv -w /file1.tcpdump 把抓的包写入文件
# tcpdump -nnv -r /file1.tcpdump   读入文件的

# tcpdump -i eth0 -nnv
18:16:15.937462 IP (tos 0x0, ttl 64, id 5673, offset 0, flags [DF], proto TCP (6), length 40)
    192.168.0.103.6777 > 192.168.0.105.22: Flags [.], cksum 0x09a7 (correct), ack 91024, win 16425, length 0
18:16:15.937517 IP (tos 0x10, ttl 64, id 14840, offset 0, flags [DF], proto TCP (6), length 120)
    192.168.0.105.22 > 192.168.0.103.6777: Flags [P.], cksum 0xdca3 (correct), seq 91184:91264, ack 577, win 660, length 80


ssh 连接
tos 0x0  当密码输错
tos 0x10  当密码正确


tos即为服务类型,只有当网络设备能够支持(能够识别IP首部中的tos字段)识别tos字段时,这给字段设置才有意义。否则都是空谈。

tos字段长度为8bit
条件:port,host,net
# tcpdump -i eth0 -nnv not port 80
# tcpdump -i eth0 -nnv port 22 -w file.tcpdump
# tcpdump -i eth0 -nnv port 80             80端口的包
# tcpdump -i eth0 -nnv net 192.168.0.0/24  指定网络的包
# tcpdump -i eth0 -nnv host 192.168.0.15   指定主机的包
# tcpdump -i eth0 -nnv dst port 22
# tcpdump -i eth0 -nnv src port 22
协议作为条件
ARP是根据IP地址获取物理地址的一个TCP/IP协议(解析ip地址和Mac地址之间的关系的)
ARP协议的基本功能就是通过目标设备的IP地址,查询目标设备的MAC地址,以保证通信的进行
# tcpdump -i eth0 -nnv arp
# tcpdump -i eth0 -nnv icmp
# tcpdump -i eth0 -nnv udp #udp协议
# tcpdump -i eth0 -nnv tcp #tcp协议,三次握手及四次断开
# tcpdump -i eth0 -nnv ip  #ip协议
# tcpdump -i eth0 -nnv vrrp #keepalived使用协议
ARP表
设备通过ARP解析到目的MAC地址后,将会在自己的ARP表中增加IP地址到MAC地址的映射表项,以用于后续到同一目的地报文的转发。
[root@localhost ~]# arp -a
gateway (192.168.0.1) at c0:a5:dd:3e:8a:66 [ether] on wlp4s0
? (192.168.0.140) at 08:11:96:c3:71:98 [ether] on wlp4s0
? (192.168.0.107) at c4:b3:01:8f:58:f0 [ether] on wlp4s0
[root@localhost ~]# tcpdump -i eth0 -nnv arp
ARP请求报文

ARP应答报文

多条件:与关系(and) 或关系(or) 非关系(not)
# tcpdump -i eth0 -nnv not net 192.168.0.0/24
# tcpdump -i eth0 -nnv not port 80
# tcpdump -i eth0 -nnv host 192.168.0.15 and port 22
# tcpdump -i eth0 -nnv host 192.168.0.15 and host 192.168.0.33
# tcpdump -i eth0 -nnv host 192.168.0.15 or host 192.168.0.33
# tcpdump -i eth0 -nnv \( host 192.168.0.15 and port 22 \)  or \( host
192.168.0.33 and port 80 \)
# tcpdump -i eth0 -nnv host 192.168.0.110 and port 22 or port 80
# tcpdump -i eth0 -nnv host 192.168.0.110 and \( port 22 or port 80\)
# tcpdump -i eth0 -nnv host 192.168.0.110 and port 80
# tcpdump -i eth0 -nnv host 192.168.0.110 and ! port 80
条件为TCP仅有SYN标记的
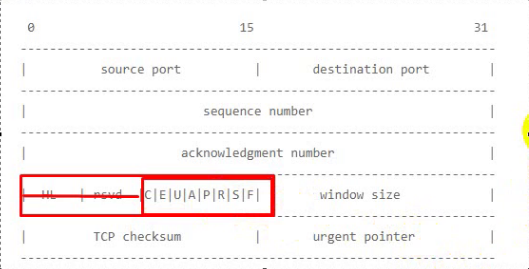
tcpdump抓取TCP协议的标识位
tcp 头部
# man tcpdump
# tcpdump -i eth0 -nnv tcp[13]==2      2的一次方

       |C|E|U|A|P|R|S|F|
       |--------------- |
       |0 0 0 0 0 0 1 0 |
       |--------------- |
       |7 6 5 4 3 2 1 0|

# tcpdump -i eth0 -nnv tcp[13]==2 and port 22 -w ssh-conn.tcpdump
条件是:TCP仅有SYN/ACK标记的
# tcpdump -i eth0 -nnv tcp[13]==18   2的一次方 + 2的4次方 = 2 + 16 =12
       |C|E|U|A|P|R|S|F|
       |--------------- |
       |0 0 0 1 0 0 1 0 |
       |--------------- |
       |7 6 5 4 3 2 1 0|
# tcpdump -i eth0 -nnv tcp[13]==17
Tcpdump + Wireshark
Tcpdump + Wireshark
# tcpdump tcp -i eth1 -t -s 0 -c 100 and dst port ! 22 and src net 192.168.1.0/24 -w ./target.cap
(1)tcp: ip icmp arp rarp 和 tcp、udp、icmp这些选项等都要放到第一个参数的位置,用来过滤数据报的类型
(2)-i eth1 : 只抓经过接口eth1的包
(3)-t : 不显示时间戳
(4)-s 0 : 抓取数据包时默认抓取长度为68字节。加上-S 0 后可以抓到完整的数据包
(5)-c 100 : 只抓取100个数据包
(6)dst port ! 22 : 不抓取目标端口是22的数据包
(7)src net 192.168.1.0/24 : 数据包的源网络地址为192.168.1.0/24
(8)-w ./target.cap : 保存成cap文件,方便用ethereal(即wireshark)分析
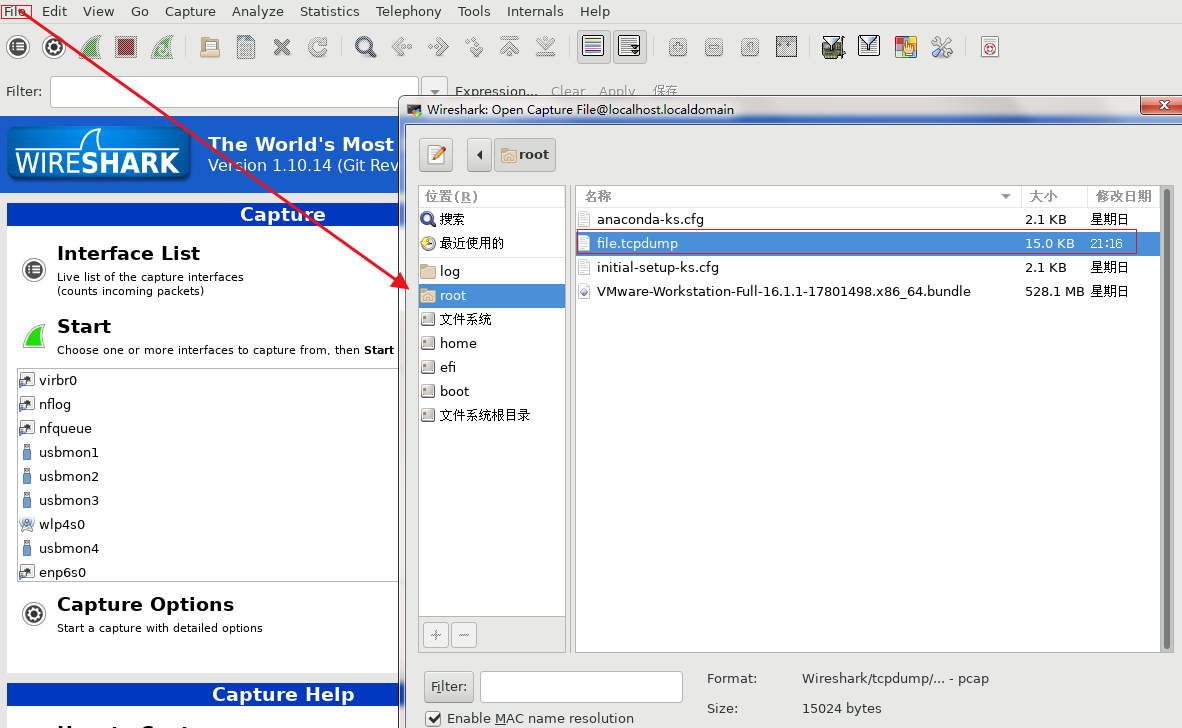
# tcpdump -i wlp4s0 -nnv -w ./file.tcpdump

# yum install -y wireshark*
# wireshark   打开wireshak 工具
检查可疑进程
基本工具 ps pstree top netstat ss
ps
系统进程一般用“[ ]”# ps -aux | lesspstree
显示每个程序的完全指令,包含路径、参数或是常驻服务标识、列出树状图时特别标注现在执行的程序# pstree -p 加进程号显示 # pstree -a # pstree -htop
按cpu、内存排序top -d 1 按P以CPU使用排序 按M以内存使用排序 按1显示cpunetstat
查看网络连接情况# netstat -naltup # netstat -natup |grep ":80"ss
查看某个协议或端口的监听状态 ```powershellss -an | grep tcp
ss -an | grep “:22”
[root@localhost ~]# netstat -naltup |grep “:80” tcp6 0 0 :::80 ::: LISTEN 20554/httpd [root@localhost ~]# ss -na |grep “:80” tcp LISTEN 0 128 :::80 :::
- 根据文件或端口查找进程
   - 根据某文件查看正在被哪些进程使用
```powershell
# lsof /usr/sbin/vsftpd
# fuser /usr/local/nginx/sbin/nginx

[root@localhost ~]# which  httpd
/usr/sbin/httpd
[root@localhost ~]# lsof /usr/sbin/httpd
COMMAND   PID   USER  FD   TYPE DEVICE SIZE/OFF      NODE NAME
httpd   20554   root txt    REG   8,19   523640 134289034 /usr/sbin/httpd

[root@localhost ~]# fuser /usr/sbin/httpd
/usr/sbin/httpd:     20554e 20558e 20560e 20561e 20562e 23607e 23608e 23615e 23616e 23617e 23618e
- 根据某个端口查看对应进程
# lsof -i TCP:22
# fuser -v 22/tcp
# fuser -v 80/tcp
[root@localhost ~]# fuser -v 22/tcp
                用户     进程号 权限   命令
22/tcp:              root       2817 F.... sshd
                root       3015 F.... sshd
                root       4609 F.... sshd
                root      11569 F.... sshd
                root      11603 F.... sshd
- 扩展:Kernel Audit 内核审计(别人连接主机端口访问了哪些文件都可以记录下来)
- apring
查看ip 地址对应的mac 地址
[root@localhost ~]# arping -I wlp4s0 192.168.0.140
ARPING 192.168.0.140 from 192.168.0.105 wlp4s0
Unicast reply from 192.168.0.140 [08:11:96:C3:71:98]  21.412ms
Unicast reply from 192.168.0.140 [08:11:96:C3:71:98]  17.678ms
Unicast reply from 192.168.0.140 [08:11:96:C3:71:98]  21.435ms
Unicast reply from 192.168.0.140 [08:11:96:C3:71:98]  21.744ms
Unicast reply from 192.168.0.140 [08:11:96:C3:71:98]  6.053ms
文件完整性检查
检验RPM包完整性
没有显示说明包没有被修改rpm -V bash rpm -V kernel rpm -V vsftpd rpm -Vf /etc/ssh/sshd_configmd5sum/sha1sum检测
获取当前的/etc 目录md5值
对重要的文件做MD5计算保存到文件中
# find /etc -type f -exec md5sum {} \; >/tmp/`date +%F%H%M`-md5.txt
修改文件、删除文件、添加文件
重新获取/etc目录的md5值
find /etc -type f -exec md5sum {} \; >/tmp/`date +%F%H%M`-md5.txt对比以上md5值获取操作过的文件
diff /tmp/1-md5.txt /tmp/2-md5.txt
扩展:
HIDS:AIDE 高级入侵检测环境

若有收获,就点个赞吧
0 人点赞
