一、基本环境搭建
1. R语言环境:
集合python和R studio环境的Anaconda 清华镜像。
安装R而非R studio。R studio 3.6.1与TCGAbiolinks不兼容。
2. R包:
R devtools: Tools to Make Developing R Packages Easier
在R console中使用以下命令安装:
install.packages("devtools")
TCGAbiolinks: An R/Bioconductor package for integrative analysis with GDC data
Colaprico, A. et al. TCGAbiolinks: An R/Bioconductor package for integrative analysis of TCGA data. Nucleic Acids Res. 44, e71 (2016).
TCGAbiolinks的获取方式(推荐使用github,Biocmanager易出错)
通过github安装
devtools::install_github(repo = "BioinformaticsFMRP/TCGAbiolinks")
通过Biocmanager安装
# 当前R的版本是"3.5",对应的TCGAbiolinks版本是"3.7" or "3.8"if (!requireNamespace("BiocManager", quietly = TRUE))install.packages("BiocManager")BiocManager::install("TCGAbiolinks", version = "3.8")
通过命令加载以下package:
library(TCGAbiolinks)library(dplyr)library(DT)
EDASeq
通过Biocmanager安装 ```r if (!requireNamespace(“BiocManager”, quietly = TRUE)) install.packages(“BiocManager”)
BiocManager::install(“EDASeq”)
<a name="ElF0I"></a>#### [TCGAWorkflow](http://bioconductor.org/packages/release/workflows/html/TCGAWorkflow.html)通过Biocmanager安装```rif (!requireNamespace("BiocManager", quietly = TRUE))install.packages("BiocManager")BiocManager::install("TCGAWorkflow")
edgeR
通过Biocmanager安装
if (!requireNamespace("BiocManager", quietly = TRUE))install.packages("BiocManager")BiocManager::install("edgeR")
Citation (from within R, enter citation("edgeR")):
Robinson MD, McCarthy DJ, Smyth GK (2010). “edgeR: a Bioconductor package for differential expression analysis of digital gene expression data.” Bioinformatics, 26(1), 139-140. doi: 10.1093/bioinformatics/btp616. McCarthy DJ, Chen Y, Smyth GK (2012). “Differential expression analysis of multifactor RNA-Seq experiments with respect to biological variation.” Nucleic Acids Research, 40(10), 4288-4297. doi: 10.1093/nar/gks042.
二、基本信息
TCGA(The Cancer Genome Atlas, 癌症基因组图谱)项目最早始于2005年,由美国政府出资,美国国家癌症研究所(National Cancer Institute)和美国人类基因组研究所(National Human Genome Research Institute)共同监督,旨在应用高通量的基因组分析技术,以帮助人们对癌症有个更好的认知,从而提高对于癌症的预防、诊断和治疗能力。
TCGA是由多个组织机构和单位共同在支持和维护的项目,主要分为负责测序的GCCs(genome characterization centers)和负责生物信息分析的GDACs(genome data analysis centers)。
TCGA第一阶段的测试项目,是以胶质母细胞瘤、肺癌和卵巢癌作为研究重点。其后的第二阶段,计划到2014年完成20-25种不同癌型的分析,而TCGA超额完成任务,已经收录包括10种罕见癌型在内的33种类型的癌症。
作为目前最大的癌症基因信息数据库,TCGA的全面不仅仅体现在众多癌型上,还体现在多组学数据,包括基因表达数据、miRNA表达数据、拷贝数变异、DNA甲基化、SNP。
1. 基本术语
| 缩写 | 全称 | 中文 |
|---|---|---|
| DEG | differentially expressed gene | 差异表达基因 |
| GDC | genomic data commons | |
| Omics | 组学 | |
| CPM | count per million | |
| MDS | multi-dimensional scaling | 多维尺度分析/变换 |
| FPKM | expected number of Fragments Per Kilobase of transcript sequence per Millions base pairssequenced | 每百万fragments中来自某一基因每千碱基fragments的数目 |
| padj | 显著性P值(P.adjust)的校正值 |
2. 基本参数(augment)
| 参数名 | 描述 |
|---|---|
| query | A quoted string of chars containing the request with the syntax given in the details section |
3. TCGA数据结构
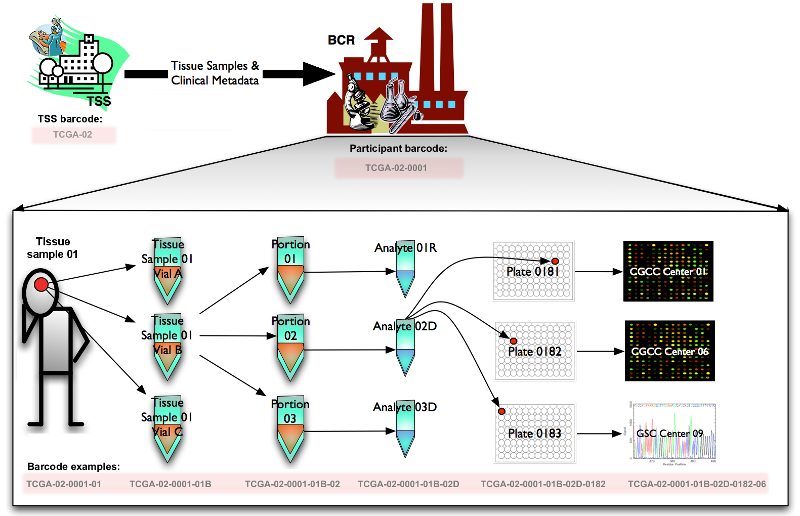 TCGA的数据单位为带有独特编号(barcode)的元数据(metadata)。这个元数据的类型非常多样,主要为测序(sequencing)数据或者特征(characterization)数据集合。
Barcode的数据结构如下,数据结构的类型代表了这条元数据的处理路径: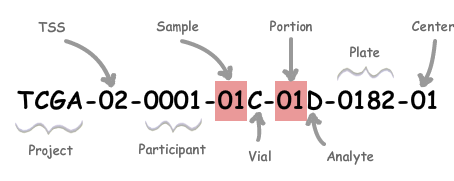
Barcode“TCGA-02-0001-01C-01D-0182-01”代表数据为癌症图谱项目(TCGA, The Cancer Genome Atlas Program)中,由编号为“02”的组织来源机构(TSS, Tissue Source Site)提供的编号为“0001”的样本提供者(患者/参与者/participant)提供的编号为“01”的样品。将这个样品分离一部分到编号为“C”的容器(瓶子,vial)中,样品的编号为“01”的区域(portion)被分成多个用于分析的单位(analyte),选取编号为“D”的analyte,加入编号为“0182”的板子(plate)中,送至编号为“01”的分析中心进行分析(测序等)得到的元数据。
具体的数据表对应如下:
| Label | Identifier for | Value | Value Description | Possible Values |
|---|---|---|---|---|
| Analyte | Molecular type of analyte for analysis | D | The analyte is a DNA sample | See Code Tables Report |
| Plate | Order of plate in a sequence of 96-well plates | 182 | The 182nd plate | 4-digit alphanumeric value |
| Portion | Order of portion in a sequence of 100 - 120 mg sample portions | 1 | The first portion of the sample | 01-99 |
| Vial | Order of sample in a sequence of samples | C | The third vial | A to Z |
| Project | Project name | TCGA | TCGA project | TCGA |
| Sample | Sample type | 1 | A solid tumor | Tumor types range from 01 - 09, normal types from 10 - 19 and control samples from 20 - 29. See Code Tables Report for a complete list of sample codes |
| Center | Sequencing or characterization center that will receive the aliquot for analysis | 1 | The Broad Institute GCC | See Code Tables Report |
| Participant | Study participant | 1 | The first participant from MD Anderson for GBM study | Any alpha-numeric value |
| TSS | Tissue source site | 2 | GBM (brain tumor) sample from MD Anderson | See Code Tables Report |
4. 基本函数/命令
1) TCGAbiolinks library
1> 使用TCGAbiolinks:::getGDCprojects()$project_id获取project list(以project_id显示)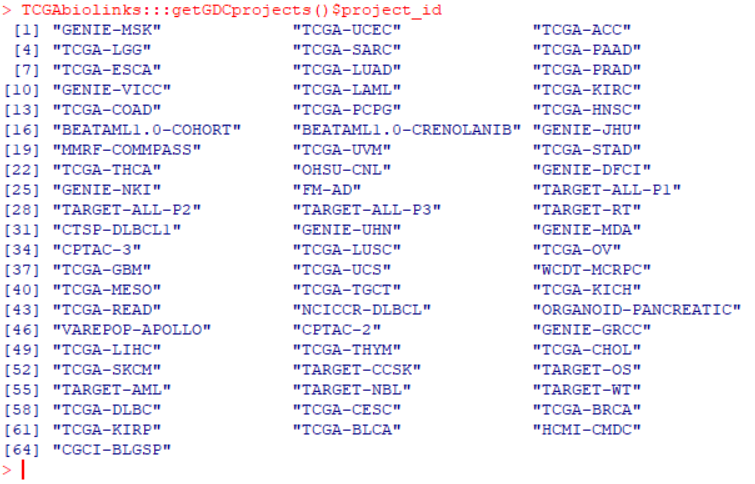
2> 使用TCGAbiolinks:::getProjectSummary(``project_id``)获取指定project_id的project信息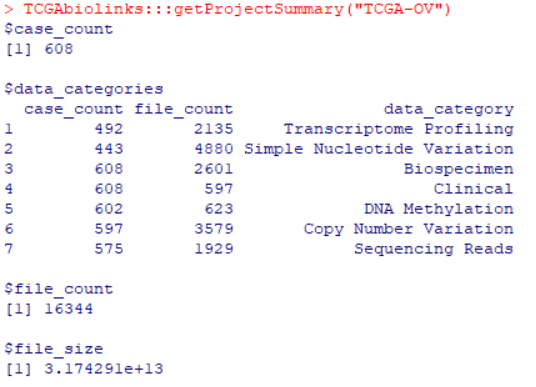
data_category:数据类型(转录本、DNA甲基化等) case_count:病例数量 file_count:文件数量 3> 使用
GDCquery(project, data.category, data.type, workflow.type, legacy = FALSE, access, platform, file.type, barcode, experimental.strategy, sample.type)获取GDC数据
例:
# 定位到ID为"TCGA-BRCA"的project,选择数据分类为Transcriptome Profiling,# 数据类型为Gene Expression Quantification,工作流类型为HTSeq - Counts。GDCquery(project = "TCGA-BRCA",data.category = "Transcriptome Profiling",data.type = "Gene Expression Quantification",workflow.type = "HTSeq - Counts")2) plyr library
Tools for Splitting, Applying and Combining Data
3) default
| 命令 | 描述 |
|---|---|
| getwd() | 查看工作目录 |
| help(package=”package_name”) | 查询名为“package_name”的包的信息 |
4) limma library
Linear Models for Microarray Data
用于microarray data的data analysis, linear models and differential expression。
5) biomaRt library
Interface to BioMart databases (e.g. Ensembl, COSMIC ,Wormbase and Gramene)
6) SummarizedExperiment library
The SummarizedExperiment container contains one or more assays, each represented by a matrix-like object of numeric or other mode. The rows typically represent genomic ranges of interest and the columns represent samples.
三、Example-based Procedure
1. Example1-基因表达差异分析(乳腺癌)
差异基因表达的分析图主要为火山图、Venn图(Venn Diagram)和聚类图(heatmap clustering)表示。
火山图
火山图可以直观地显示两个样本之间差异基因表达的分布情况,example如下: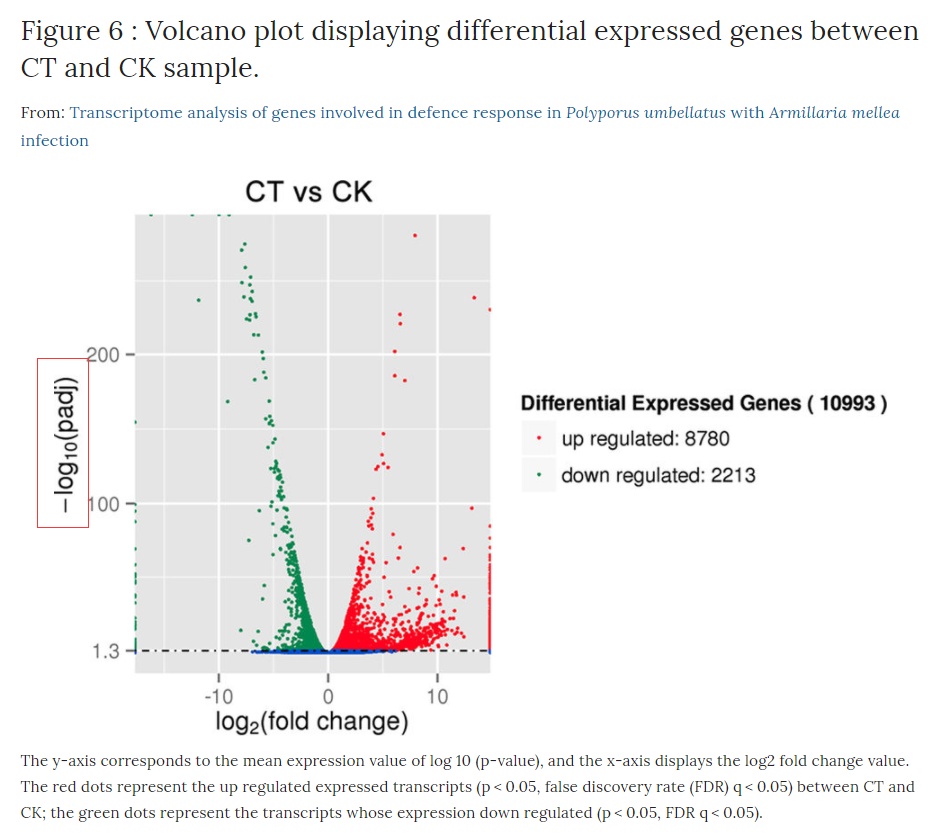
火山图的y轴是-log10(Qvalue/padj),即qvalue(pvalue校正后的值)取-log10,因此数值越高说明qvalue越小即越显著。横坐标是Log2 fold change,即对fold change取log2,所以越靠两侧的点(每个点代表一个基因),其基因表达量上调或者下调幅度越大。
作者:jlyq617
链接:https://www.jianshu.com/p/e2828ef9c7e5
来源:简书
著作权归作者所有。商业转载请联系作者获得授权,非商业转载请注明出处。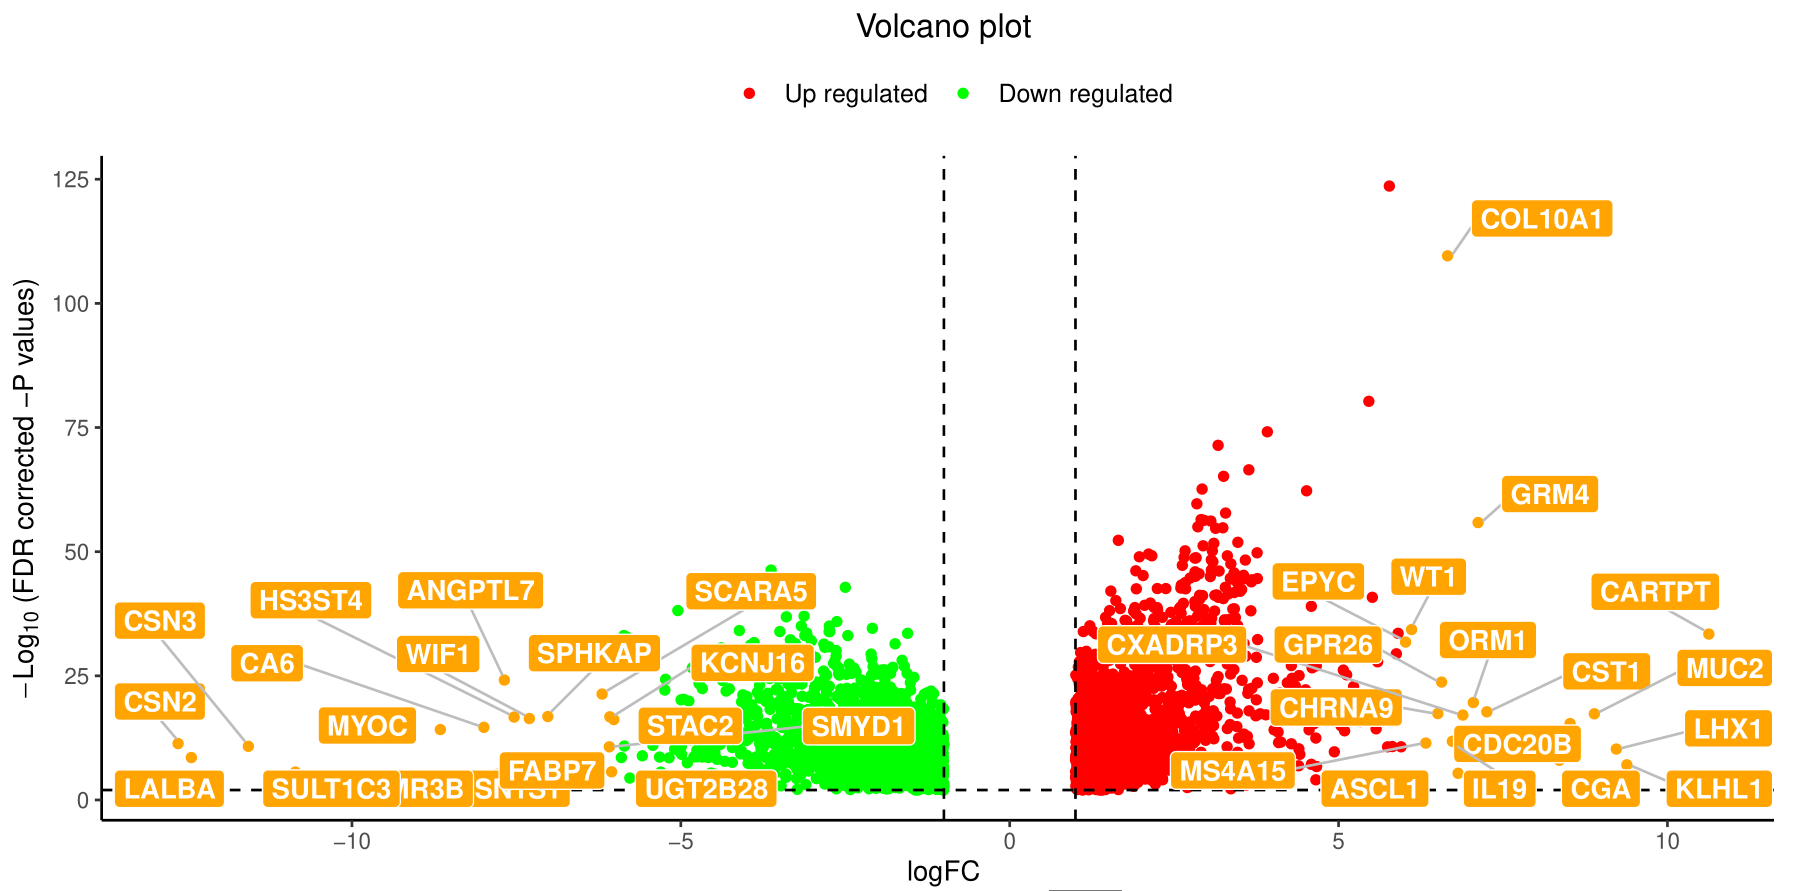
注意
如果文章中使用了TCGAbiolinks,请引用命令citation("TCGAbiolinks")返回的引用文献:
- Antonio Colaprico, Tiago Chedraoui Silva, Catharina Olsen, Luciano Garofano, Claudia Cava, Davide Garolini, Thais Sabedot, Tathiane Malta, Stefano M. Pagnotta, Isabella Castiglioni,Michele Ceccarelli, Gianluca Bontempi Houtan Noushmehr. TCGAbiolinks: An R/Bioconductor package for integrative analysis of TCGA data Nucleic Acids Research (05 May 2016) 44 (8): e71. (doi:10.1093/nar/gkv1507)
- Silva, Tiago C., et al. “TCGA Workflow: Analyze cancer genomics and epigenomics data using Bioconductor packages.” F1000Research 5 (2016).
- Mounir, Mohamed, et al. “New functionalities in the TCGAbiolinks package for the study and integration of cancer data from GDC and GTEx.” PLoS computational biology 15.3 (2019): e1006701.
如果文章中使用了ELMER分析,请引用:
- Yao, L., Shen, H., Laird, P. W., Farnham, P. J., & Berman, B. P. “Inferring regulatory element landscapes and transcription factor networks from cancer methylomes.” Genome Biol 16 (2015): 105.
- Yao, Lijing, Benjamin P. Berman, and Peggy J. Farnham. “Demystifying the secret mission of enhancers: linking distal regulatory elements to target genes.” Critical reviews in biochemistry and molecular biology 50.6 (2015): 550-573.
更多信息
1. 外链
1) 02-TCGAbiolinks包中的函数
2) RNA-seq的counts,RPM, RPKM, FPK值到底有什么区别?
3) R语言biomaRt工具包学习笔记
4) biomart
5) TCGA Barcode
6) 数据挖掘专题 | TCGA数据挖掘如何入门?
7) ⭐RPKM、FPKM、TPM详解
8) ⭐Illumina桥式PCR技术
9) ⭐R数据可视化1: 火山图
2. library/函数信息
1) plyr library
2) limma library-Linear Models for Microarray Data
3) biomaRt library
4) SummarizedExperiment library
5) TCGAbiolinks library
引用

若有收获,就点个赞吧
0 人点赞
